. 2024 Sep 21;120(11):1336-1350.
doi: 10.1093/cvr/cvae103.

Novel formylpeptide receptor 1/2 agonist limits hypertension-induced cardiovascular damage

Affiliations

Novel formylpeptide receptor 1/2 agonist limits hypertension-induced cardiovascular damage

Jaideep Singh et al. Cardiovasc Res. .

Abstract

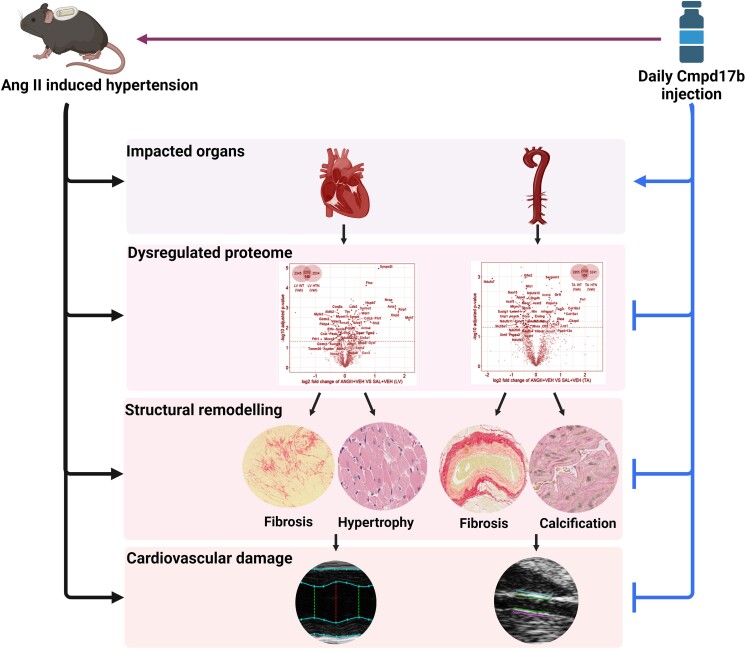
Aims: Formylpeptide receptors (FPRs) play a critical role in the regulation of inflammation, an important driver of hypertension-induced end-organ damage. We have previously reported that the biased FPR small-molecule agonist, compound17b (Cmpd17b), is cardioprotective against acute, severe inflammatory insults. Here, we reveal the first compelling evidence of the therapeutic potential of this novel FPR agonist against a longer-term, sustained inflammatory insult, i.e. hypertension-induced end-organ damage. The parallels between the murine and human hypertensive proteome were also investigated.

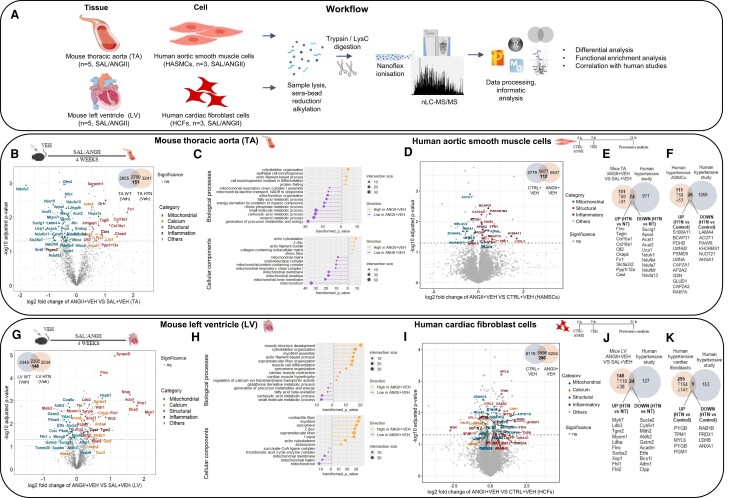
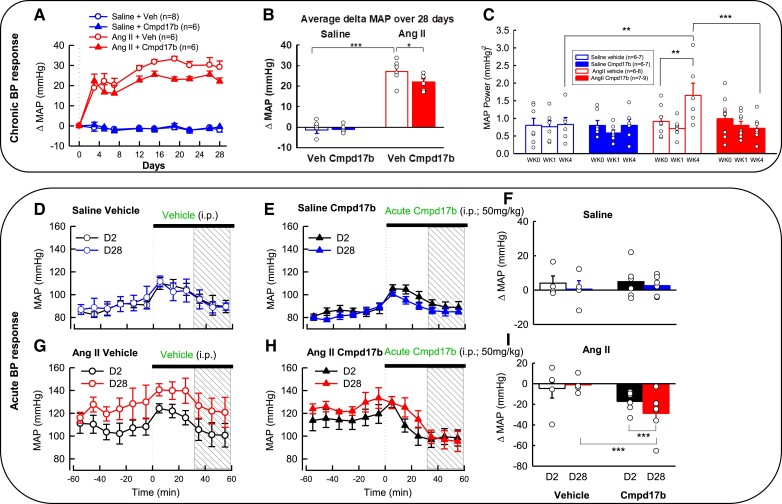
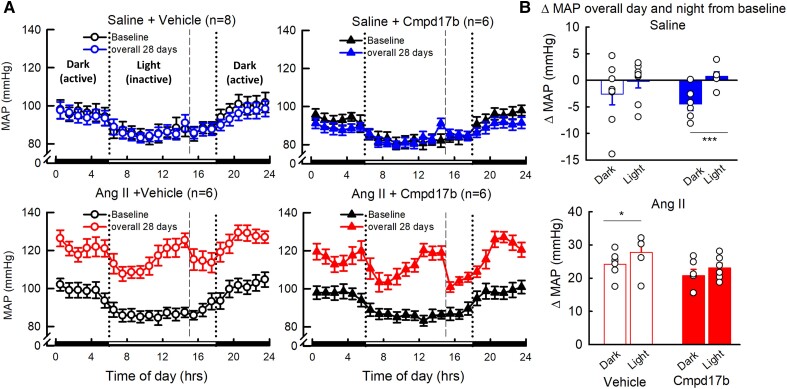
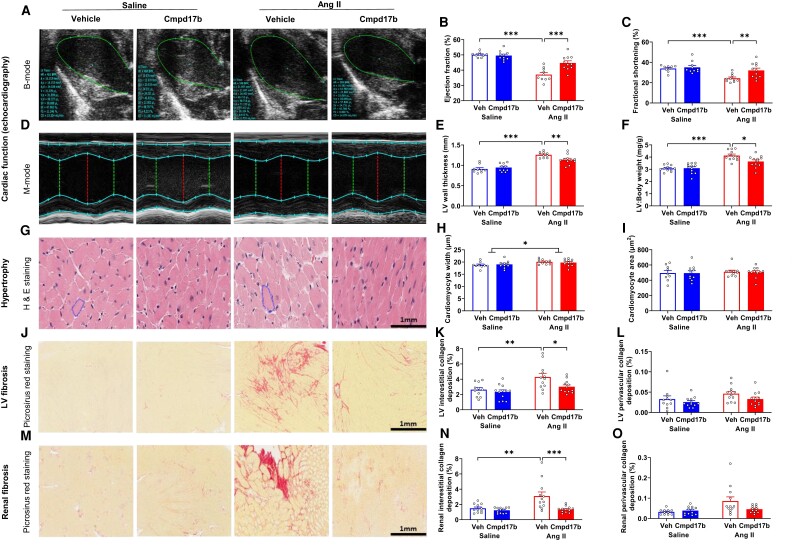
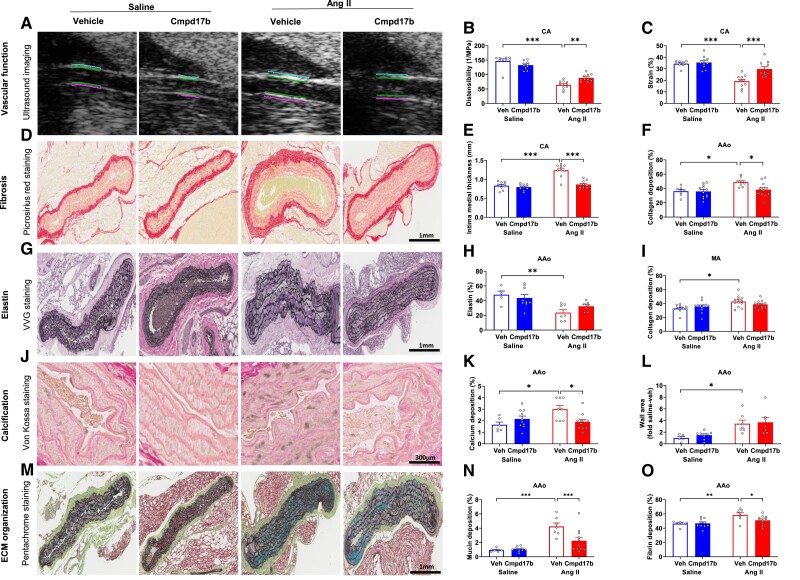
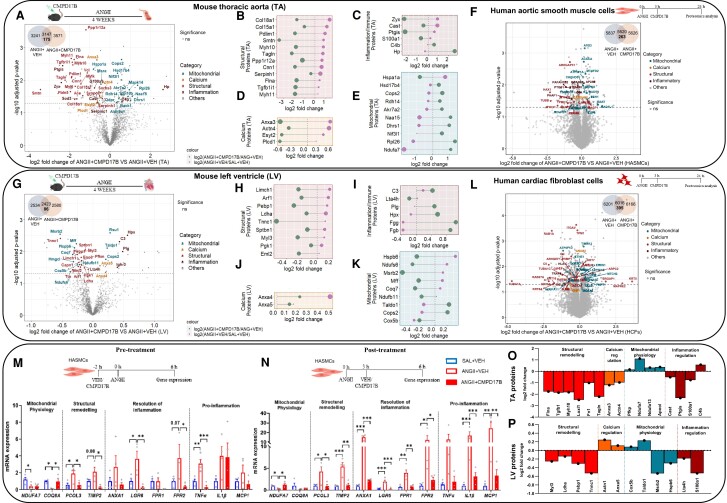
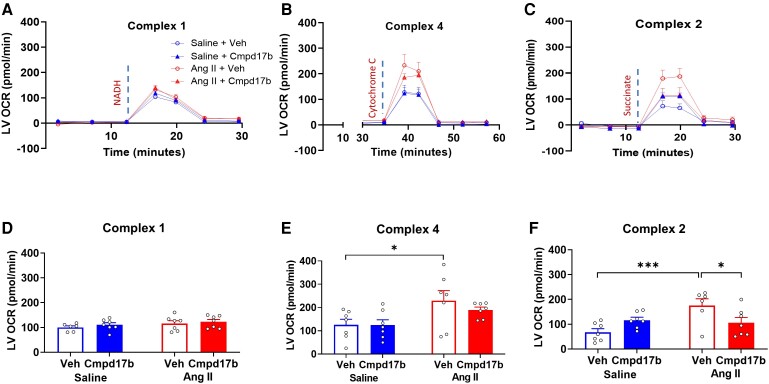
Methods and results: The hypertensive response to angiotensin II (Ang II, 0.7 mg/kg/day, s.c.) was attenuated by Cmpd17b (50 mg/kg/day, i.p.). Impairments in cardiac and vascular function assessed via echocardiography were improved by Cmpd17b in hypertensive mice. This functional improvement was accompanied by reduced cardiac and aortic fibrosis and vascular calcification. Cmpd17b also attenuated Ang II-induced increased cardiac mitochondrial complex 2 respiration. Proteomic profiling of cardiac and aortic tissues and cells, using label-free nano-liquid chromatography with high-sensitivity mass spectrometry, detected and quantified ∼6000 proteins. We report hypertension-impacted protein clusters associated with dysregulation of inflammatory, mitochondrial, and calcium responses, as well as modified networks associated with cardiovascular remodelling, contractility, and structural/cytoskeletal organization. Cmpd17b attenuated hypertension-induced dysregulation of multiple proteins in mice, and of these, ∼110 proteins were identified as similarly dysregulated in humans suffering from adverse aortic remodelling and cardiac hypertrophy.

Conclusion: We have demonstrated, for the first time, that the FPR agonist Cmpd17b powerfully limits hypertension-induced end-organ damage, consistent with proteome networks, supporting development of pro-resolution FPR-based therapeutics for treatment of systemic hypertension complications.

Keywords: Angiotensin II; Compound17b; End-organ damage; Formylpeptide receptors; Hypertension; Proteomics.


Conflict of interest statement

Conflict of interest: none declared.

Figures

Graphical Abstract
Graphical Abstract
Figure 1
Figure 1
Sustained Ang II up-regulated cardiac and vascular structural, inflammatory, and calcium regulatory proteins and down-regulated mitochondrial proteins. Proteomic workflow (A) in both mouse tissues and human cell line, with corresponding results illustrated in (BI). Volcano plots (with corresponding Venn diagram in the inset) displaying proteins identified in our study in mice (B and G) and human cell lines (D and I) with structural (red), calcium regulatory (orange), inflammatory (brown), and mitochondrial (blue) proteins. Up-regulated (yellow) and down-regulated (purple) biological processes (top lollipop panel) and cellular components (bottom lollipop panel) in TA (C) and LV (H). Venn diagrams display commonly identified up- and down-regulated proteins from our study and published human proteomic data set (E–K). Venn diagram comparing the TA mouse proteome from this study with the TA proteome of human aortic remodelling data set from Herrington et al. (E). Venn diagram compared the HASMC proteome from this study with the human aortic remodelling TA proteome (F). Venn diagram compared the LV mouse proteome from this study with the LV proteome of human hypertensive data set from Coats et al. (J). Venn diagram compared the HCF proteome from this study with the human hypertensive LV proteome (K). GO, gene annotation; BP, biological process; CC, cellular component; HTN, hypertensive; NT, normotensive; Veh, vehicle; Ang II, angiotensin II; Ctrl, control; Sal + Veh, vehicle-treated normotensive mice; AngII + Veh, vehicle-treated hypertensive mice; HCFs, human cardiac fibroblasts; HASMCs, human aortic smooth muscle cells.
Figure 2
Figure 2
Cmpd17b treatment lowered blood pressure and overactive sympathetic activity in Ang II-induced hypertensive mice. The mean change in MAP (ΔMAP) was recorded by telemetry over 28 days in conscious normotensive mice and hypertensive mice treated with saline vehicle or Cmpd17b (A). The average change in MAP (average ΔMAP) over the full 28 days, in normotensive (n = 6–8) and hypertensive (n = 6) mice treated with vehicle or Cmpd17b (B). Spectral analysis was performed to determine mid-frequency MAP power in normotensive (blue, n = 6–7) and hypertensive (red, n = 6–9) mice treated with vehicle (open bars) or Cmpd17b (filled bars) at baseline, Week 1, and Week 4 (C). MAP was recorded before and after (40–60 min) injection of vehicle (n = 4, blue unfilled circles) or Cmpd17b (n = 6, blue filled triangles) in normotensive mice on Day 2 and Day 28 (D and E). MAP was recorded before and after (40–60 min) vehicle (n = 4, red unfilled circles) and Cmpd17b (n = 7, red filled triangles) injection in hypertensive mice on Day 2 and Day 28 (G and H). The bar graph represents the change in MAP, 30 min (indicated with a square pattern in the line graph) after injection of vehicle or Cmpd17b in normotensive and hypertensive mice at Day 2 vs. Day 28 (F and I). Dotted vertical lines signify injection of either vehicle or Cmpd17b. Data are presented as mean ± SEM. *P < 0.05, **P < 0.01, and ***P < 0.001 for between-group comparison. Statistical analysis was conducted with a mixed model split-plot ANOVA corrected with Bonferroni and Greenhouse–Geisser adjustments. Ang II, angiotensin II; Veh, vehicle; WK, week; MAP, mean arterial pressure; Cmpd17b, compound 17b; min, minutes; i.p., intraperitoneal; D2, Day 2; D28, Day 28; saline, normotensive mice; Ang II, hypertensive mice.
Figure 3
Figure 3
Effect of Cmpd17b or vehicle on MAP in day and night in Ang II-induced hypertensive and normotensive mice. Line graphs show the average hourly MAP over 24 h for vehicle-treated normotensive mice (top left, n = 8, blue unfilled circles), Cmpd17b-treated normotensive mice (top centre, n = 6, blue filled triangles), vehicle-treated hypertensive mice (bottom left, n = 6, red unfilled circles), and Cmpd17b-treated hypertensive mice (bottom centre, n = 6, red filled triangles) at baseline (black) and over 28 days (A). Dotted vertical lines signify lights on–off. Dashed vertical lines signify injection of either vehicle or Cmpd17b. The dark (active) period is indicated by a black bar on a time axis, and the light (inactive) period is indicated by a white bar on the time axis. Histograms indicate the average change in MAP from baseline during the dark and light period over the 28 days of chronic treatment with saline, top right, or Ang II, bottom right (B). Data presented as mean ± SEM. *P < 0.05 and ***P < 0.001 for between-group comparison. Statistical analysis was conducted with between-group split-plot ANOVA of average hourly values corrected with Bonferroni and Greenhouse–Geisser adjustments. MAP, mean arterial pressure; Ang II, angiotensin II; Cmpd17b, compound 17b; hrs, hours; saline, normotensive mice; Ang II, hypertensive mice.
Figure 4
Figure 4
Chronic Cmpd17b treatment prevented adverse cardiac dysfunction and cardiorenal remodelling in Ang II-induced hypertensive mice. Two-dimensional, long-axis echocardiography of the LV was performed to measure EF, and M-mode echocardiography was performed to measure LV FS and wall thickness. The representative echocardiography images show LV long-axis and M-mode (A–E). LV weight normalized to body weight (mg/g) was recorded (F). H&E staining was used to quantify the cardiomyocyte’s width and area. Representative images of LV showed cardiomyocytes (G–I). PSR stain quantified interstitial and perivascular fibrotic area of LV and shown as red-stained collagen in representative images (J–L). PSR staining was used to quantify interstitial and perivascular fibrotic area of the kidney and shown as red-stained collagen in representative images (M–O). Histograms (B–O) represent vehicle-treated normotensive mice (n = 9–11, blue unfilled), Cmpd17b-treated normotensive mice (n = 10–12, blue filled), vehicle-treated hypertensive mice (n = 10–12, red unfilled), and Cmpd17b-treated hypertensive mice (n = 11–12, red filled). The scale bar in black represents 1 mm. Results presented as mean ± SEM. Statistical analysis was performed using a two-way ANOVA followed by Bonferroni significant difference post hoc test. *P < 0.05, **P < 0.01, and ***P < 0.001 for differences between groups. Ang II, angiotensin II; Veh, vehicle; H&E, haematoxylin and eosin; Cmpd17b, compound 17b; LV, left ventricle; PSR, picrosirius red; saline, normotensive mice; Ang II, hypertensive mice.
Figure 5
Figure 5
Chronic Cmpd17b treatment prevents adverse vascular remodelling in Ang II-induced hypertensive mice. Ultrasound imaging of the carotid artery was performed to measure distensibility, strain, and wall thickness. The representative images showed intima medial thickness (AC and E). Quantification of the collagen (fibrotic) area of the abdominal aorta was performed by PSR stain. Red-stained collagen is shown in the representative images of the vessel (D and F). Quantification of elastin was performed by VVG stain. Representative images of vessel elastin content show black-stained elastin lining (G and H). The collagen (fibrotic) area of the mesenteric artery was quantified using a PSR stain (I). Calcification was quantified as the percentage area of calcium deposition in the abdominal aorta using the Von Kossa stain (J and K). The wall area of the abdominal aorta was quantified (L). Pentachrome staining was used to quantify mucin and fibrin area of abdominal aorta and shown as blue-stained mucin and red-stained fibrin in representative images (M–O). Histograms (B–O) represent vehicle-treated normotensive mice (n = 5–11, blue unfilled), Cmpd17b-treated normotensive mice (n = 9–12, blue filled), vehicle-treated hypertensive mice (n = 7–12, red unfilled), and Ang II-infused Cmpd17b-treated mice (n = 7–12, red filled). The scale bar in black represents 1 mm for pentachrome, PSR, and VVG stain images and 300 µm for Von Kossa stain images. Results presented as mean ± SEM. Statistical analysis was performed using a two-way ANOVA followed by Bonferroni significant difference post hoc test. *P < 0.05, **P < 0.01, and ***P < 0.001 for differences between groups. Ang II, angiotensin II; Veh, vehicle; VVG, Verhoeff-van Gieson; Cmpd17b, compound 17b; PSR, picrosirius red; saline, normotensive mice; Ang II, hypertensive mice; ECM, extracellular matrix; CA, carotid artery; AAo, abdominal aorta; MA, mesenteric artery.
Figure 6
Figure 6
Cmpd17b attenuated cardiac and vascular proteome in Ang II-induced hypertensive mice. Volcano plots (with corresponding Venn diagram in the inset) and lollipop chart comparing structural (red), inflammatory (brown), calcium regulatory (orange), and mitochondrial (blue) proteins in TA (A–E) and LV (G–K) of hypertensive mice treated with vehicle and Cmpd17b. Lollipop chart of TA proteome (B–E) and LV proteome (H–K) displayed up-regulated proteins as pink dots and down-regulated proteins as green dots. Ang II-stimulated HASMCs (F) and HCFs (L) treated with Cmpd17b or vehicle before subjected to proteomic analysis. Volcano plots (with corresponding Venn diagram in the inset) display proteins comparing structural (red), inflammatory (brown), calcium regulatory (orange), and mitochondrial (blue) proteins in human cell lines (M and N). Ang II-stimulated HASMCs treated with Cmpd17b (pre-treatment, M, and post-treatment, N) were subjected to gene expression analysis, including mitochondrial physiology, structural remodelling, resolution of inflammation, and pro-inflammation. Histograms (M and N) represent HASMCs treated with vehicle (n = 4, blue unfilled), Ang II-stimulated HASMCs treated with vehicle (n = 3–4, red unfilled), and Ang II-stimulated HASMCs treated with Cmpd17b (n = 3–4, red filled). The differential protein expression in TA (O) and LV (P) of Cmpd17b-treated hypertensive mice exhibits inverse impact on human data sets. For gene expression, statistical analysis was performed using a one-way ANOVA followed by Bonferroni significant difference post hoc test. *P < 0.05, **P < 0.01, and ***P < 0.001 for differences between groups. Veh, vehicle; Ang II, angiotensin II; AngII + Veh, vehicle-treated hypertensive mice; AngII + Cmpd17b, Cmpd17b-treated hypertensive mice; Cmpd17b, compound 17b; HCFs, human cardiac fibroblasts; HASMCs, human aortic smooth muscle cells.
Figure 7
Figure 7
Cmpd17b attenuates cardiac mitochondrial dysregulation in Ang II-induced hypertensive mice. OCR of complexes I, II, and IV was measured for 60 min in mitochondria isolated from LV of normotensive and hypertensive mice treated with vehicle and Cmpd17b (A–C). Histogram (D–F) represents OCR of complexes I, II, and IV of vehicle-treated normotensive mice (n = 6–7, blue unfilled), Cmpd17b-treated normotensive mice (n = 7, blue filled), vehicle-treated hypertensive mice (n = 6–7, red unfilled), and Cmpd17b-treated hypertensive mice (n = 7, red filled). Results presented as mean ± SEM. Statistical analysis was performed using a two-way ANOVA followed by Bonferroni significant difference post hoc test. *P < 0.05 and ***P < 0.001 for differences between groups. OCR, oxygen consumption rate; Ang II, angiotensin II; Veh, vehicle; Cmpd17b, compound 17b; LV, left ventricle.

Similar articles

Cited by

References

    1. Dai X, Hua L, Chen Y, Wang J, Li J, Wu F, Zhang Y, Su J, Wu Z, Liang C. Mechanisms in hypertension and target organ damage: is the role of the thymus key?. Int J Mol Med 2018;42:3–12. - PMC - PubMed
    1. Pimenta E, Calhoun DA. Resistant hypertension: incidence, prevalence, and prognosis. Circulation 2012;125:1594–1596. - PMC - PubMed
    1. Elijovich F, Kirabo A, Laffer CL. Hypothesis: unrecognized actions of ENaC blockade in improving refractory-resistant hypertension and residual cardiovascular risk. Int J Cardiol Hypertens 2020;7:100048. - PMC - PubMed
    1. Yaxley JP, Thambar SV. Resistant hypertension: an approach to management in primary care. J Family Med Prim Care 2015;4:193–199. - PMC - PubMed
    1. Harrison DG, Guzik TJ, Lob HE, Madhur MS, Marvar PJ, Thabet SR, Vinh A, Weyand CM. Inflammation, immunity, and hypertension. Hypertension 2011;57:132–140. - PMC - PubMed

MeSH terms