. 2024 Jul;23(7):100801.
doi: 10.1016/j.mcpro.2024.100801. Epub 2024 Jun 15.

Profiling Proteins and Phosphorylation Sites During T Cell Activation Using an Integrated Thermal Shift Assay

Affiliations

Profiling Proteins and Phosphorylation Sites During T Cell Activation Using an Integrated Thermal Shift Assay

Brandon M Gassaway et al. Mol Cell Proteomics. 2024 Jul.

Abstract

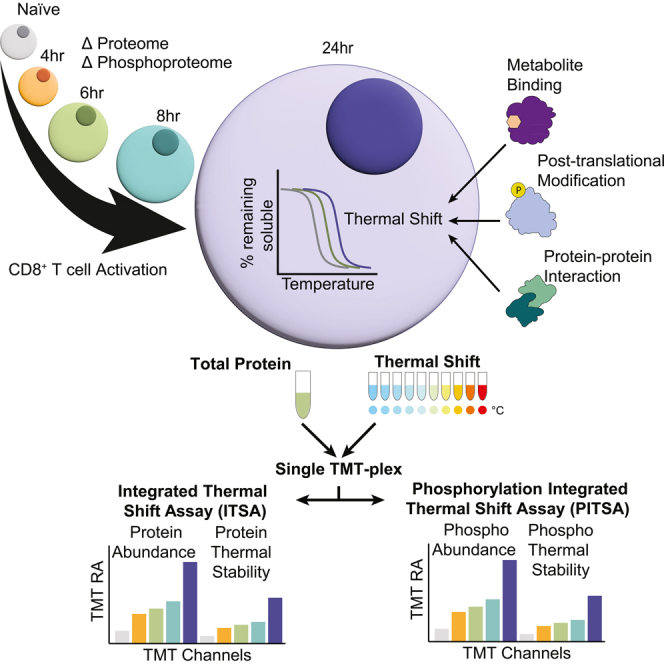
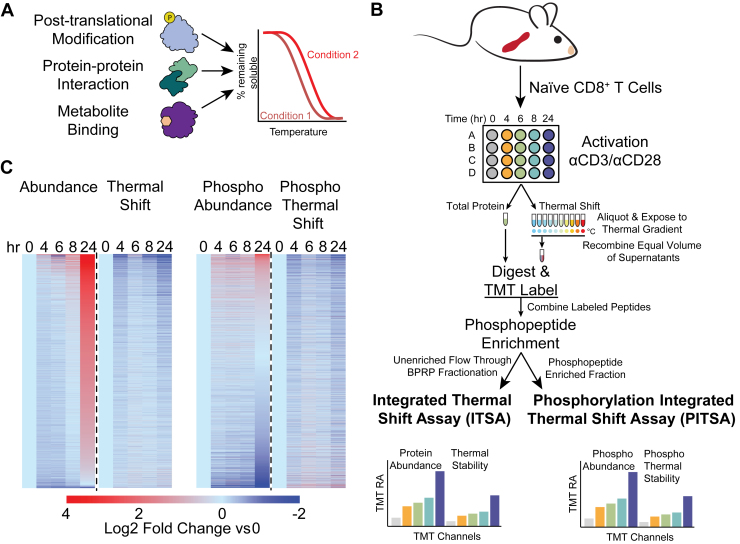
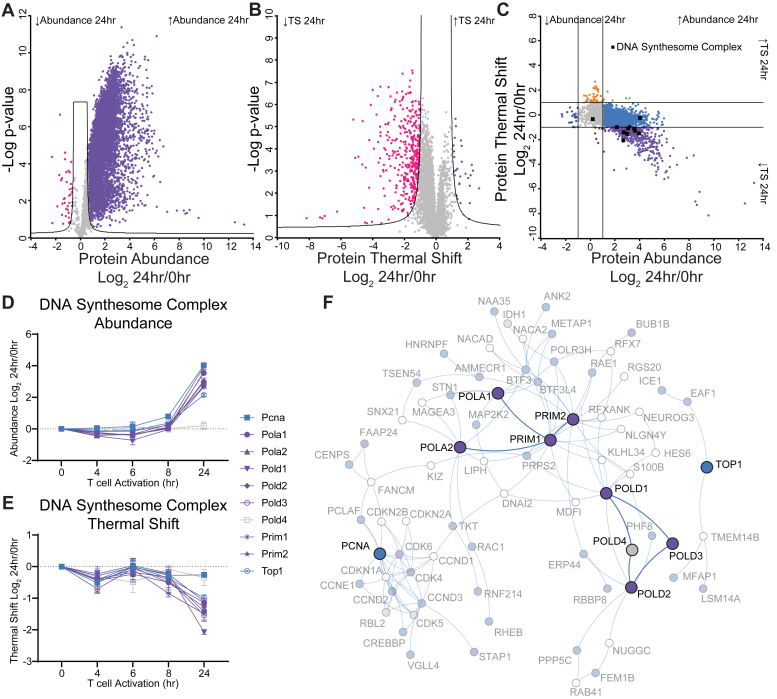
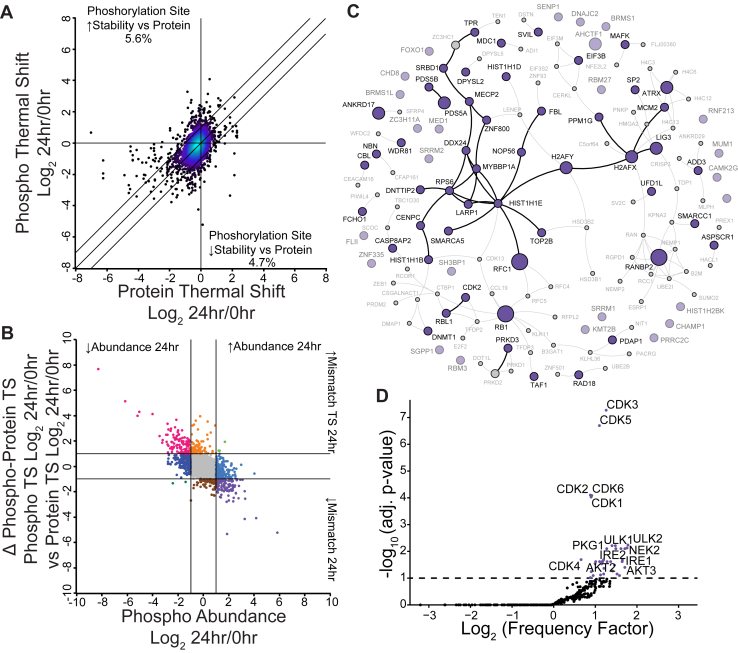
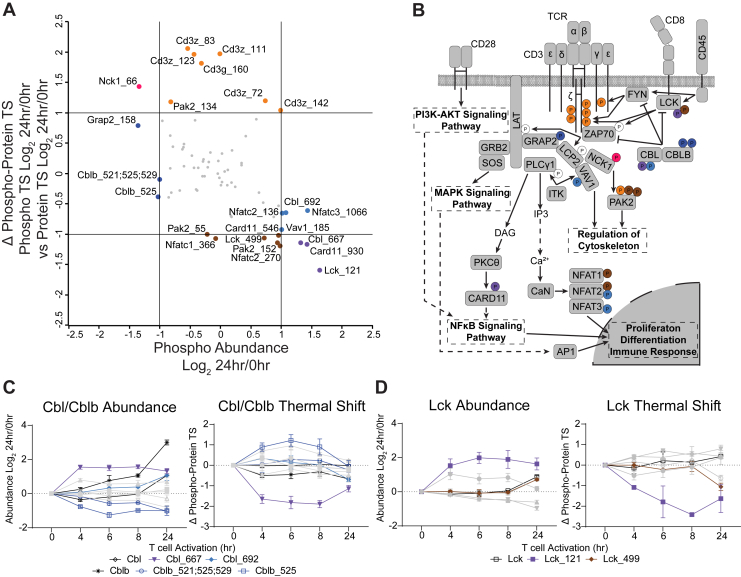
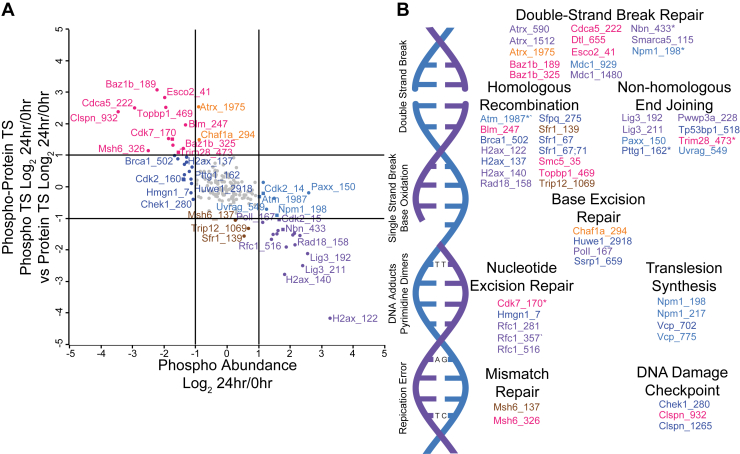
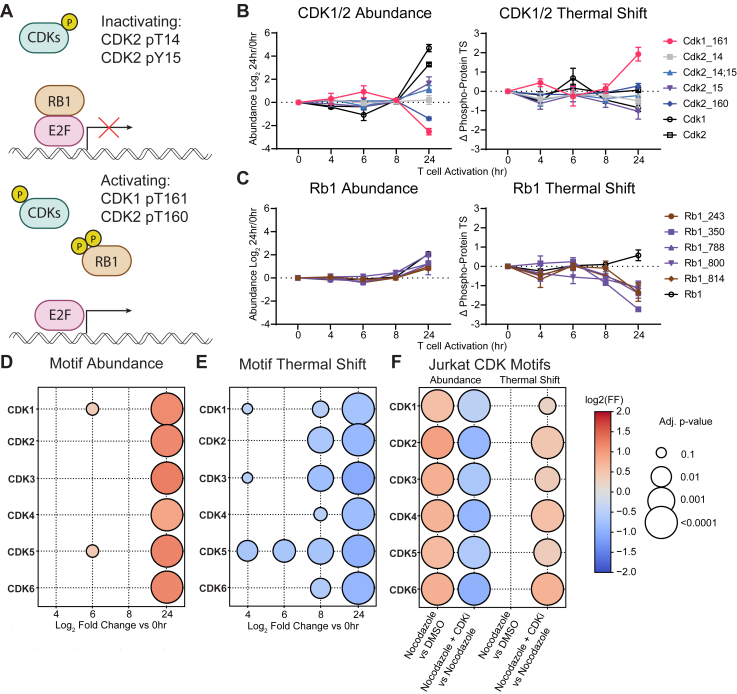
T cell activation is a complex biological process of naive cells maturing into effector cells. Proteomic and phospho-proteomic approaches have provided critical insights into this process, yet it is not always clear how changes in individual proteins or phosphorylation sites have functional significance. Here, we developed the Phosphorylation Integrated Thermal Shift Assay (PITSA) that combines the measurement of protein or phosphorylation site abundance and thermal stability into a single tandem mass tags experiment and apply this method to study T cell activation. We quantified the abundance and thermal stability of over 7500 proteins and 5000 phosphorylation sites and identified significant differences in chromatin-related, TCR signaling, DNA repair, and proliferative phosphoproteins. PITSA may be applied to a wide range of biological contexts to generate hypotheses as to which proteins or phosphorylation sites are functionally regulated in a given system as well as the mechanisms by which this regulation may occur.

Keywords: CD8((+)) T cell activation; DNA repair; cyclin-dependent kinase signaling; phosphoproteomics; proteome thermal stability; proteomics.


Conflict of interest statement

Conflict of interests The authors declare the following financial interests/personal relationships which may be considered as potential competing interests: S. P. G. is a member of the scientific advisory boards of Cell Signaling Technologies and ThermoFisher Scientific. L. C. C. is a founder and member of the board of directors of Agios Pharmaceuticals and is a founder and receives research support from Petra Pharmaceuticals; is listed as an inventor on a patent (WO2019232403A1, Weill Cornell Medicine) for combination therapy for PI3K-associated disease or disorder, and the identification of therapeutic interventions to improve response to PI3K inhibitors for cancer treatment; is a co-founder and shareholder in Faeth Therapeutics; has equity in and consults for Cell Signaling Technologies, Volastra, Larkspur and 1 Base Pharmaceuticals; and consults for Loxo-Lilly. J. L. J has received consulting fees from Scorpion Therapeutics and Volastra Therapeutics. T. M. Y.-B. is a co-founder of DeStroke.

Figures

None
Graphical abstract
Fig. 1
Fig. 1
The Phosphorylation Integrated Thermal Shift Assay.A, thermal stability as an intrinsic protein property can integrate many other inputs to protein regulation, including post-translational modification, protein-protein interactions, and protein-metabolite binding, which are measurable by a shift in the protein’s thermal melting curve. B, the PITSA workflow for investigating T cell activation. This method enables the simultaneous collection of four datasets (protein abundance, protein thermal shift, phosphorylation site abundance, and phosphorylation site thermal shift) in two sets of mass spectrometry experiments (protein abundance and thermal stability in one, phosphorylation site abundance and thermal stability in the other). C, heatmaps representing the four datasets (protein abundance, protein thermal shift, protein-normalized phosphorylation site abundance, and phosphorylation site thermal shift) collected for 5 time points across the first 24 h of T cell activation. Values are represented as the mean Log2 fold change versus 0 h (naïve) of n = 4 replicates per time point.
Fig. 2
Fig. 2
ITSA Identifies Coordination in Thermal Stability Regulation Between Proteins and Protein Complexes.A, volcano plot comparing the Log2 fold change in protein abundance between 0 h and 24 h of activation. B, Volcano plot comparing the Log2 fold change in protein thermal shift (TS) between 0 h and 24 h. C, plotting the protein thermal shift versus the protein abundance separates proteins into categories of behavior. Lines represent 2-fold change. Members of the DNA synthesome complex are indicated by black squares and black diamonds, respectively. Changes in protein abundance (D) or thermal shift (E) for members of the DNA synthesome complex. Colors are based on category in (C). F, potein-protein interaction network of the DNA synthesome proteins and nearest neighbors from Bioplex 3.0, coloring as in (C). Values are the mean Log2 fold change of the indicated timepoint versus 0 h of n=2 to 4 replicates. Error bars (D and E) represent SEM.
Fig. 3
Fig. 3
PITSA Identifies Phosphorylation Sites that Alter Protein Thermal Stability.A, a comparison of the phosphorylation site thermal shift at 24 h versus the bulk protein thermal shift at 24 h. Lines indicate a 2-fold difference between protein and phosphorylation site thermal stability. Darker colors indicate reduced point density. Values are the mean Log2 fold change of 24 h versus 0 h of n = 4 replicates per time point. B, a comparison of the difference between phosphorylation site and protein thermal shift (Δ Phospho-Protein TS) versus phosphorylation site abundance separates phosphorylation sites into behavioral categories. Lines represent 2-fold change. C, the Bioplex network of co-regulated phosphorylation sites with increased abundance and decreased thermal stability. The size of the circle represents the number of phosphorylation sites from that protein observed in the category. D, a kinase motif analysis of phosphorylation sites changing in both abundance and thermal stability at some point in the time course.
Fig. 4
Fig. 4
PITSA Reveals Thermal Stability Regulation of the TCR Signaling Pathway.A, a comparison of the difference between the phosphorylation site and protein thermal shift (Δ Phospho-Protein TS) versus phosphorylation site abundance for the TCR signaling pathway (derived from Fig. 3B). Lines represent 2-fold change. B, a schematic of the TCR signaling pathway, with regulated phosphorylation sites from (A) indicated; colors coordinate with categories from (A). Phosphorylation site abundance and thermal shift for CBL and CBLB (C) as well as LCK (D). Values are the mean Log2 fold change of the indicated timepoint versus 0 h of n = 2 to 4 replicates. Error bars (C and D) represent SEM.
Fig. 5
Fig. 5
PITSA Identifies Regulatory Phosphorylation Sites in DNA Damage Repair Pathways During T Cell Activation.A, a comparison of the difference between the phosphorylation site and protein thermal shift (Δ Phospho-Protein TS) versus phosphorylation site abundance for DNA Damage Repair pathways (derived from Fig. 3B). Lines represent 2-fold change, square points indicate sites with annotated functions in PhosphoSitePlus. B, phosphorylation sites regulating proteins in various DNA Damage Repair pathways. Colors coordinate with (A), asterisks indicate phosphorylation sites with annotated function in PhosphoSitePlus.
Fig. 6
Fig. 6
Functional Consequences of CDK Kinase Activity Identified by PITSA.A, schematic of RB1 regulation by CDKs. Phosphorylation site abundance and thermal stability for CDK1 and 2 (B) as well as RB1 (C). Values are the mean Log2 fold change of the indicated timepoint versus 0 h of n = 2 to 4 replicates. Error bars (C and D) represent SEM. Motif analysis showing the abundance (D) and thermal shift (E) of predicted CDK1-6 substrates. Color indicates Log2 fold change versus 0 h, size indicates adjusted p-value. F, motif analysis showing the abundance and thermal shift of predicted CDK1-6 substrates in Jurkat cells treated with DMSO, Nocodazole, or Nocodazole + CDK inhibitors. The color indicates a Log2 fold change of the indicated comparison (Nocodazole versus DMSO or Nocodazole + CDKi vs Nocodazole), and size indicates an adjusted p-value.

Similar articles

References

    1. Alsaab H.O., Sau S., Alzhrani R., Tatiparti K., Bhise K., Kashaw S.K., et al. PD-1 and PD-L1 checkpoint signaling inhibition for cancer immunotherapy: mechanism, combinations, and clinical outcome. Front. Pharmacol. 2017;8 - PMC - PubMed
    1. Sterner R.C., Sterner R.M. CAR-T cell therapy: current limitations and potential strategies. Blood Cancer J. 2021;11:69. - PMC - PubMed
    1. Raskov H., Orhan A., Christensen J.P., Gögenur I. Cytotoxic CD8+ T cells in cancer and cancer immunotherapy. Br. J. Cancer. 2020;124:359–367. - PMC - PubMed
    1. Ron-Harel N., Sharpe A.H., Haigis M.C. Mitochondrial metabolism in T cell activation and senescence: a mini-review. Gerontology. 2015;61:131–138. - PubMed
    1. Ron-Harel N., Santos D., Ghergurovich J.M., Sage P.T., Reddy A., Lovitch S.B., et al. Mitochondrial biogenesis and proteome remodeling promote one-carbon metabolism for T cell activation. Cell Metab. 2016;24:104–117. - PMC - PubMed

Substances

LinkOut - more resources