

Leveraging the adolescent brain cognitive development study to improve behavioral prediction from neuroimaging in smaller replication samples
- PMID: 38880786
- PMCID: PMC11180541
- DOI: 10.1093/cercor/bhae223
Leveraging the adolescent brain cognitive development study to improve behavioral prediction from neuroimaging in smaller replication samples
Abstract
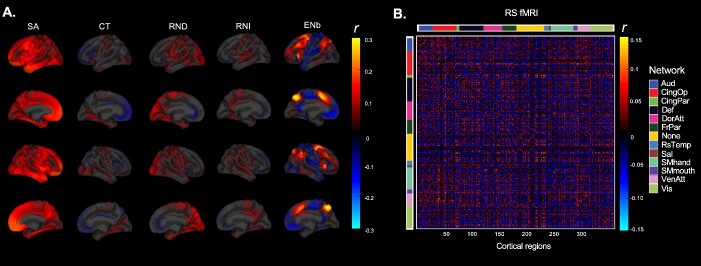
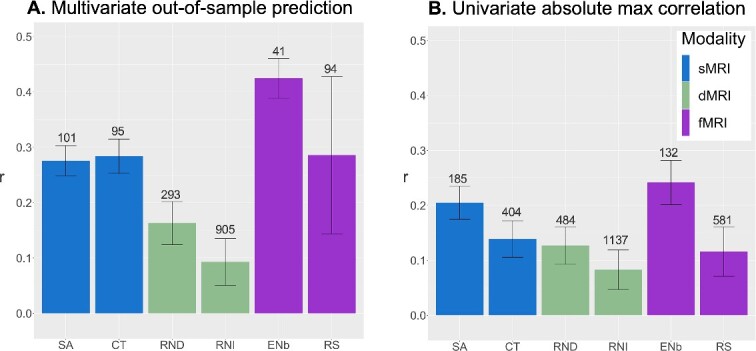
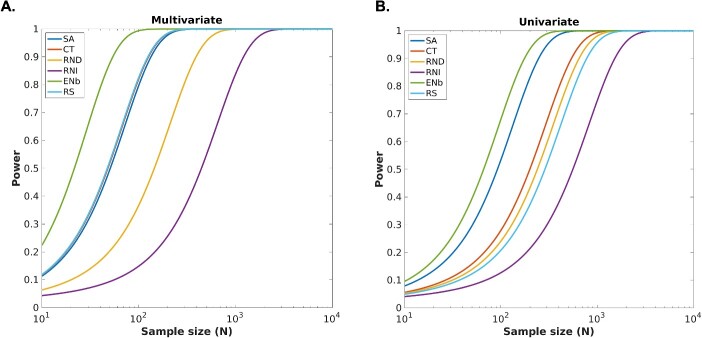
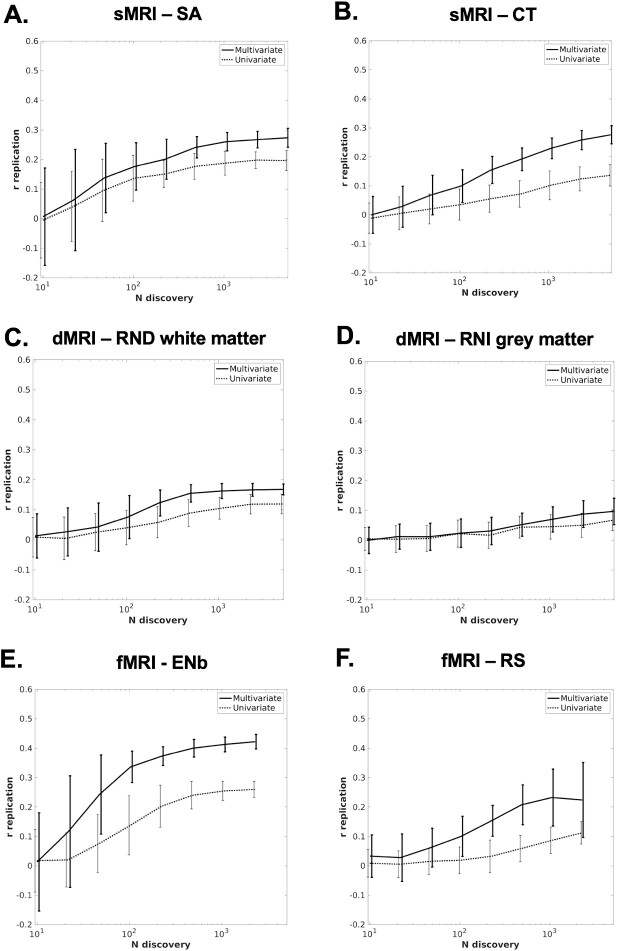
Neuroimaging is a popular method to map brain structural and functional patterns to complex human traits. Recently published observations cast doubt upon these prospects, particularly for prediction of cognitive traits from structural and resting state functional magnetic resonance imaging (MRI). We leverage baseline data from thousands of children in the Adolescent Brain Cognitive DevelopmentSM Study to inform the replication sample size required with univariate and multivariate methods across different imaging modalities to detect reproducible brain-behavior associations. We demonstrate that by applying multivariate methods to high-dimensional brain imaging data, we can capture lower dimensional patterns of structural and functional brain architecture that correlate robustly with cognitive phenotypes and are reproducible with only 41 individuals in the replication sample for working memory-related functional MRI, and ~ 100 subjects for structural and resting state MRI. Even with 100 random re-samplings of 100 subjects in discovery, prediction can be adequately powered with 66 subjects in replication for multivariate prediction of cognition with working memory task functional MRI. These results point to an important role for neuroimaging in translational neurodevelopmental research and showcase how findings in large samples can inform reproducible brain-behavior associations in small sample sizes that are at the heart of many research programs and grants.
Keywords: brain-behavior associations; multivariate modeling; neurocognition; structural MRI; task functional MRI.
© The Author(s) 2024. Published by Oxford University Press. All rights reserved. For permissions, please e-mail: journals.permissions@oup.com.
Figures
Update of
-
Leveraging the Adolescent Brain Cognitive Development Study to improve behavioral prediction from neuroimaging in smaller replication samples.bioRxiv [Preprint]. 2023 Oct 1:2023.06.16.545340. doi: 10.1101/2023.06.16.545340. bioRxiv. 2023. Update in: Cereb Cortex. 2024 Jun 4;34(6):bhae223. doi: 10.1093/cercor/bhae223. PMID: 37398195 Free PMC article. Updated. Preprint.
Similar articles
-
Leveraging the Adolescent Brain Cognitive Development Study to improve behavioral prediction from neuroimaging in smaller replication samples.bioRxiv [Preprint]. 2023 Oct 1:2023.06.16.545340. doi: 10.1101/2023.06.16.545340. bioRxiv. 2023. Update in: Cereb Cortex. 2024 Jun 4;34(6):bhae223. doi: 10.1093/cercor/bhae223. PMID: 37398195 Free PMC article. Updated. Preprint.
-
Associations between neuropsychological profile and regional brain FDG uptake in progressive supranuclear palsy.J Parkinsons Dis. 2025 Jun;15(4):904-912. doi: 10.1177/1877718X251343080. Epub 2025 May 25. J Parkinsons Dis. 2025. PMID: 40415458
-
Assessing the comparative effects of interventions in COPD: a tutorial on network meta-analysis for clinicians.Respir Res. 2024 Dec 21;25(1):438. doi: 10.1186/s12931-024-03056-x. Respir Res. 2024. PMID: 39709425 Free PMC article. Review.
-
Surveillance for Violent Deaths - National Violent Death Reporting System, 50 States, the District of Columbia, and Puerto Rico, 2022.MMWR Surveill Summ. 2025 Jun 12;74(5):1-42. doi: 10.15585/mmwr.ss7405a1. MMWR Surveill Summ. 2025. PMID: 40493548 Free PMC article.
-
Defining disease severity in atopic dermatitis and psoriasis for the application to biomarker research: an interdisciplinary perspective.Br J Dermatol. 2024 Jun 20;191(1):14-23. doi: 10.1093/bjd/ljae080. Br J Dermatol. 2024. PMID: 38419411 Free PMC article. Review.
Cited by
-
Improving Predictability, Reliability and Generalisability of Brain-Wide Associations for Cognitive Abilities via Multimodal Stacking.bioRxiv [Preprint]. 2025 Mar 5:2024.05.03.589404. doi: 10.1101/2024.05.03.589404. bioRxiv. 2025. Update in: PNAS Nexus. 2025 Jun 24;4(6):pgaf175. doi: 10.1093/pnasnexus/pgaf175. PMID: 38746222 Free PMC article. Updated. Preprint.
-
Quality over quantity: powering neuroimaging samples in psychiatry.Neuropsychopharmacology. 2024 Nov;50(1):58-66. doi: 10.1038/s41386-024-01893-4. Epub 2024 Jun 20. Neuropsychopharmacology. 2024. PMID: 38902353 Review.
-
Brain imaging studies of emotional well-being: a scoping review.Front Psychol. 2024 Jan 5;14:1328523. doi: 10.3389/fpsyg.2023.1328523. eCollection 2023. Front Psychol. 2024. PMID: 38250108 Free PMC article.
-
Multivariate analysis of multimodal brain structure predicts individual differences in risk and intertemporal preference.bioRxiv [Preprint]. 2024 Jul 8:2024.07.04.602046. doi: 10.1101/2024.07.04.602046. bioRxiv. 2024. PMID: 39026787 Free PMC article. Preprint.
-
Improving predictability, reliability, and generalizability of brain-wide associations for cognitive abilities via multimodal stacking.PNAS Nexus. 2025 Jun 24;4(6):pgaf175. doi: 10.1093/pnasnexus/pgaf175. eCollection 2025 Jun. PNAS Nexus. 2025. PMID: 40575708 Free PMC article.
References
-
- Bondy WH, Zlot W. The standard error of the mean and the difference between means for finite populations. Am Stat. 1976:30(2):96–97. 10.1080/00031305.1976.10479149. - DOI
MeSH terms
Grants and funding
- U24 DA041147/DA/NIDA NIH HHS/United States
- U01 DA051039/DA/NIDA NIH HHS/United States
- U01 DA041120/DA/NIDA NIH HHS/United States
- U01 DA041093/DA/NIDA NIH HHS/United States
- U24 DA041123/DA/NIDA NIH HHS/United States
- U01 DA051038/DA/NIDA NIH HHS/United States
- U01 DA051037/DA/NIDA NIH HHS/United States
- U01 DA051016/DA/NIDA NIH HHS/United States
- U01 DA041106/DA/NIDA NIH HHS/United States
- U01 DA041117/DA/NIDA NIH HHS/United States
- U01 DA041148/DA/NIDA NIH HHS/United States
- Adolescent Brain Cognitive DevelopmentSM
- U01 DA041174/DA/NIDA NIH HHS/United States
- U01 DA051018/DA/NIDA NIH HHS/United States
- NIMH Data Archive
- U01 DA041134/DA/NIDA NIH HHS/United States
- U01 DA041022/DA/NIDA NIH HHS/United States
- U01 DA041156/DA/NIDA NIH HHS/United States
- U01 DA050987/DA/NIDA NIH HHS/United States
- U01 DA041025/DA/NIDA NIH HHS/United States
- U01 DA050989/DA/NIDA NIH HHS/United States
- U01 DA041089/DA/NIDA NIH HHS/United States
- U01 DA050988/DA/NIDA NIH HHS/United States
- U01DA041048/NH/NIH HHS/United States
- U01 DA041028/DA/NIDA NIH HHS/United States
- U01 DA041048/DA/NIDA NIH HHS/United States
LinkOut - more resources
Full Text Sources
Medical
Miscellaneous
