. 2024 Jun 17;81(1):265.
doi: 10.1007/s00018-024-05302-3.

Disturbed glycolipid metabolism activates CXCL13-CXCR5 axis in senescent TSCs to promote heterotopic ossification

Affiliations

Disturbed glycolipid metabolism activates CXCL13-CXCR5 axis in senescent TSCs to promote heterotopic ossification

Yuyu Chen et al. Cell Mol Life Sci. .

Abstract

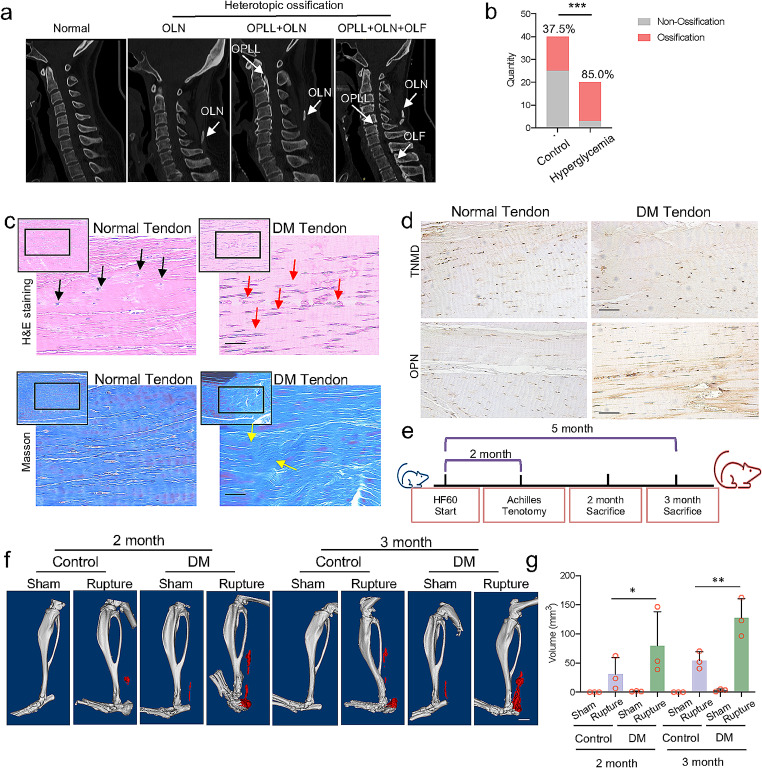
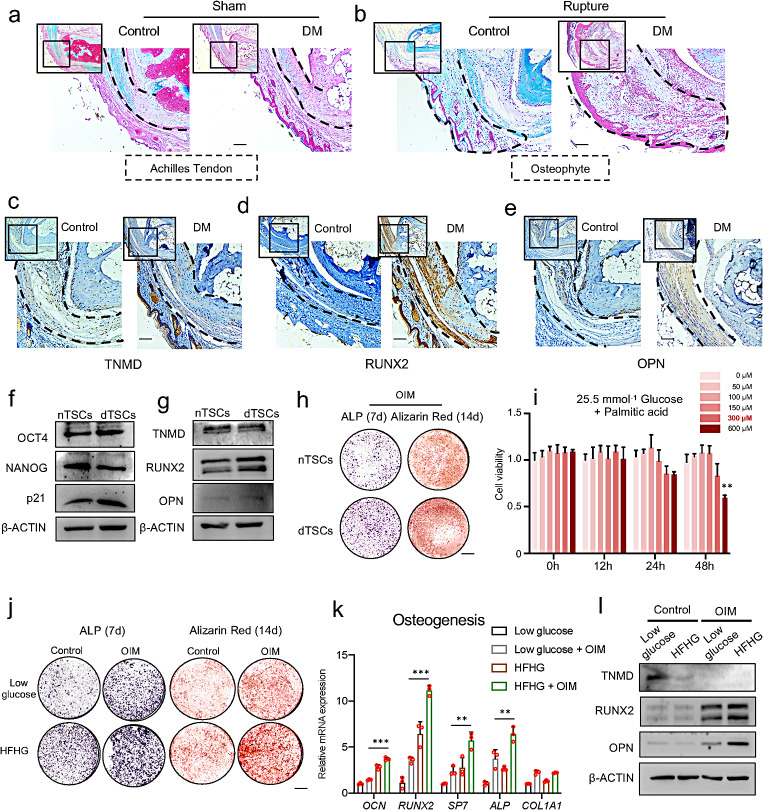
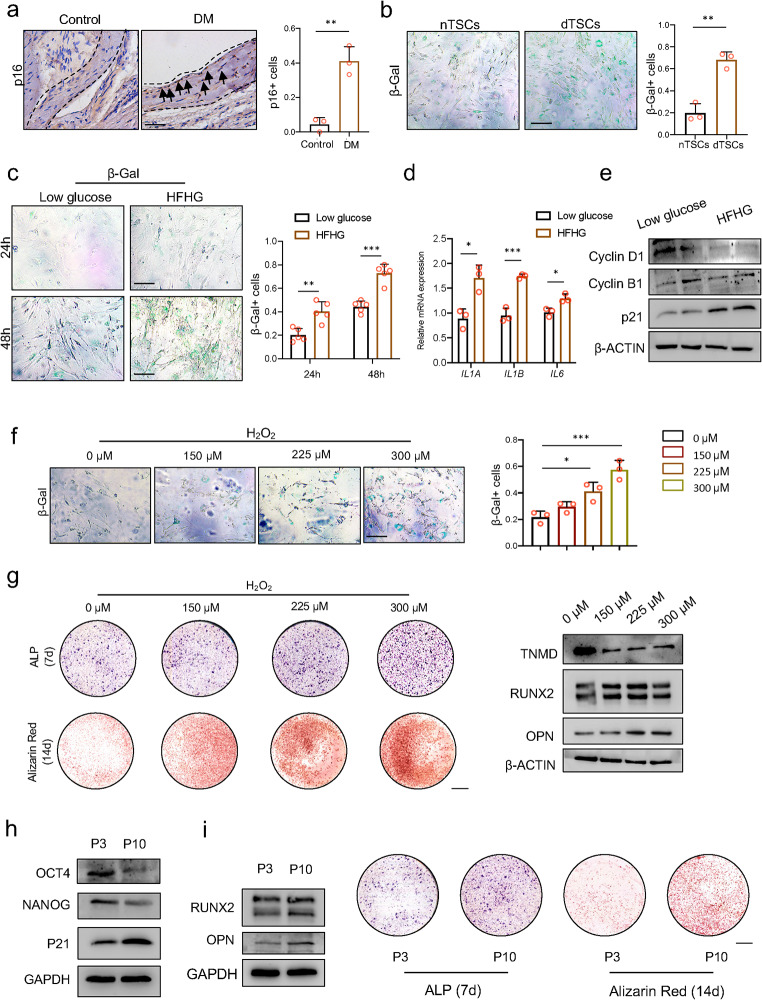
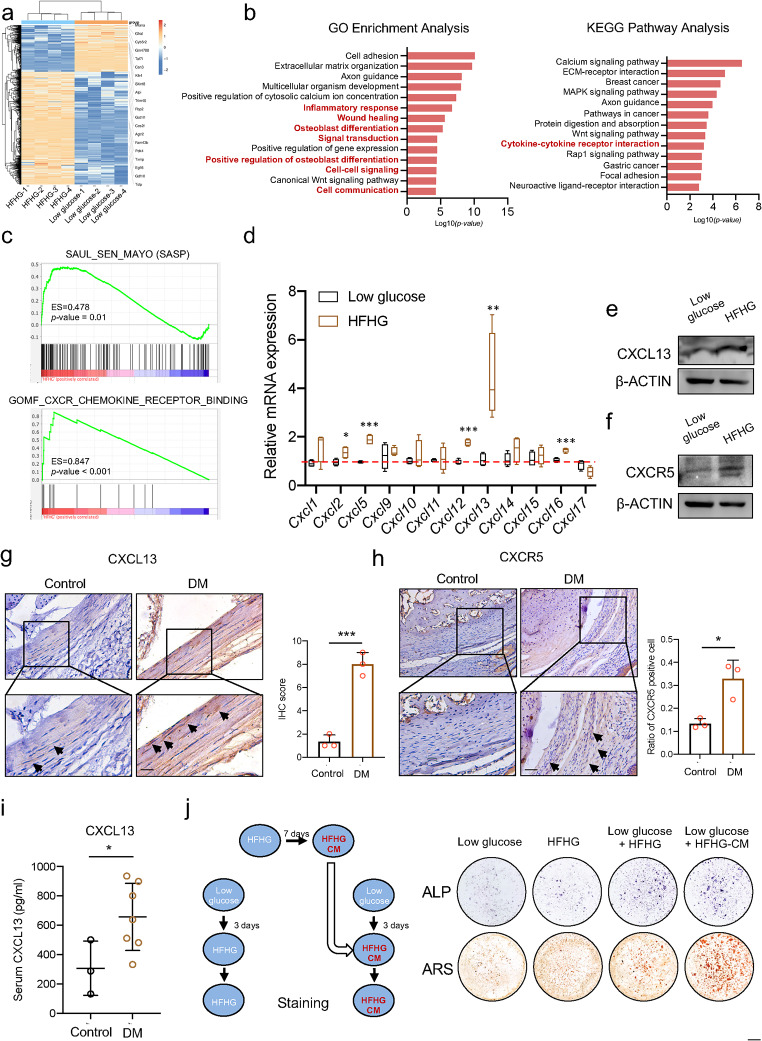
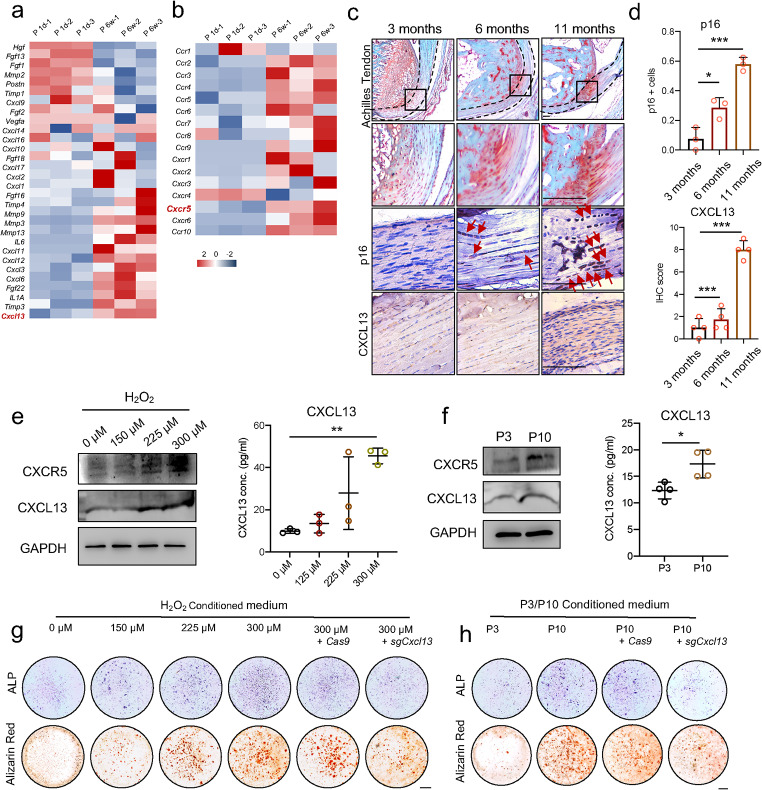
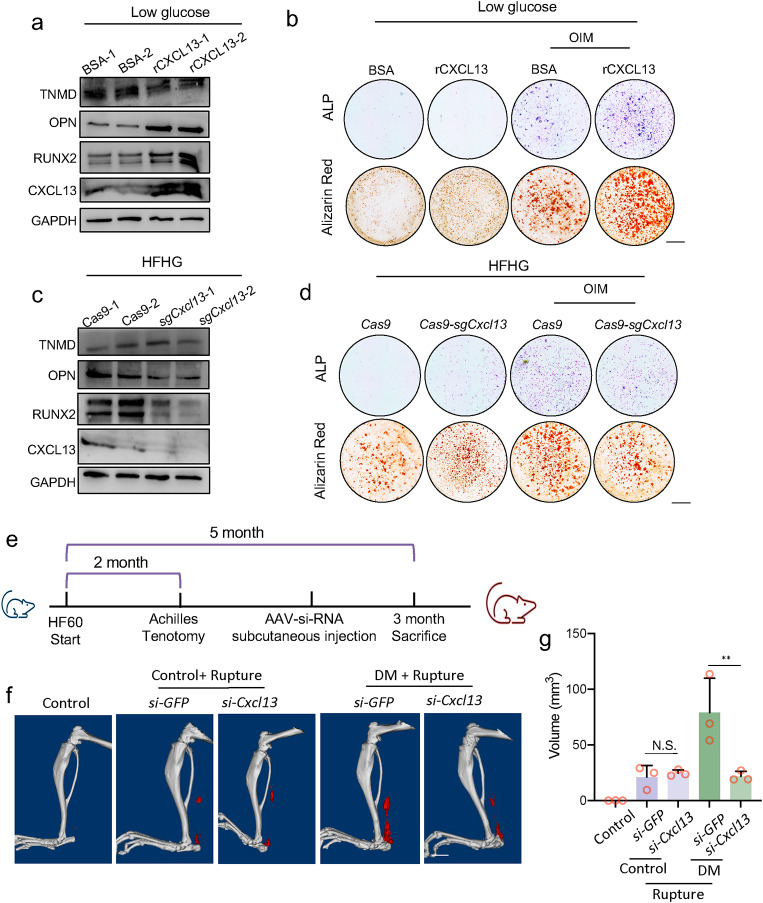
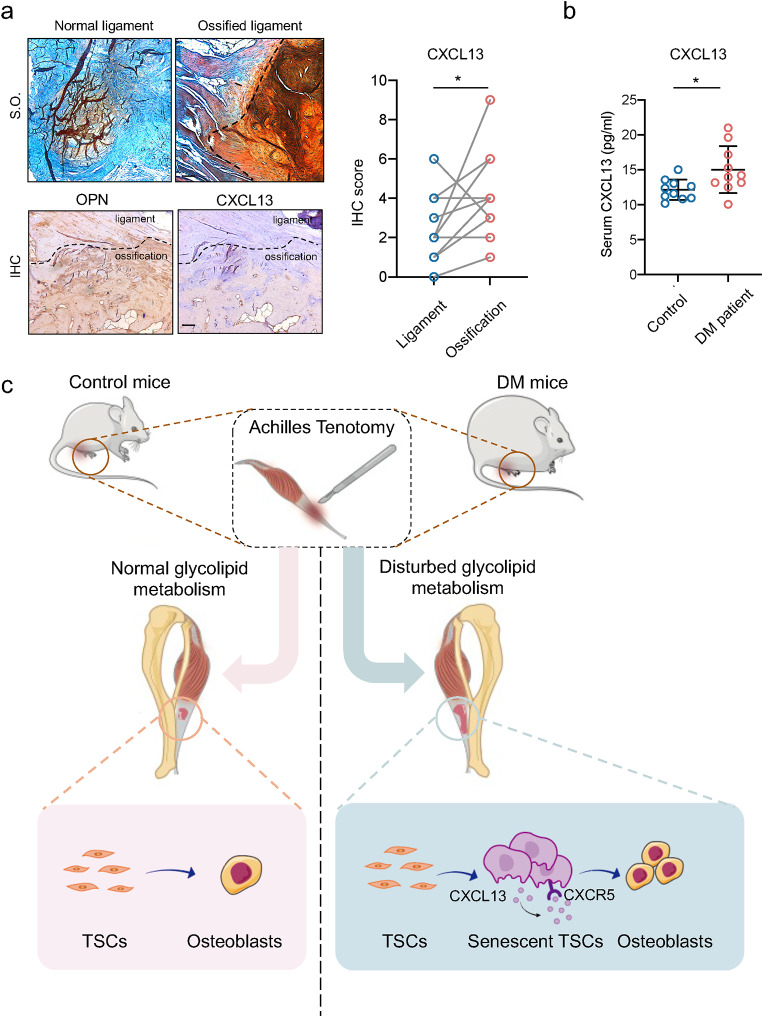
Heterotopic ossification (HO) occurs as a common complication after injury, while its risk factor and mechanism remain unclear, which restricts the development of pharmacological treatment. Clinical research suggests that diabetes mellitus (DM) patients are prone to developing HO in the tendon, but solid evidence and mechanical research are still needed. Here, we combined the clinical samples and the DM mice model to identify that disordered glycolipid metabolism aggravates the senescence of tendon-derived stem cells (TSCs) and promotes osteogenic differentiation. Then, combining the RNA-seq results of the aging tendon, we detected the abnormally activated autocrine CXCL13-CXCR5 axis in TSCs cultured in a high fat, high glucose (HFHG) environment and also in the aged tendon. Genetic inhibition of CXCL13 successfully alleviated HO formation in DM mice, providing a potential therapeutic target for suppressing HO formation in DM patients after trauma or surgery.

Keywords: CXCL13; Cellular senescence; Glycolipid metabolism; Heterotopic ossification.


Conflict of interest statement

The authors declare no conflicts of interest.

Figures

Fig. 1
Fig. 1
DM patients and DM mice were more susceptible to developing tendon and ligament HO. a. Sagittal view of CT scanning of patients suffering from HO in different ligaments; OLN: Ossification of ligamentum nuchae; OPLL: Ossification of posterior longitudinal ligament; OLF: Ossification of ligamentum flavum. b. Occurrence rate of heterotopic ossification in control patients and hyperglycemia patients. c. H&E staining (upper lane) and Masson trichrome staining (bottom lane) of the normal tendon and DM tendon. Black arrows indicate normal tendon cells. Red arrows indicate apoptotic tendon cells. Yellow arrows indicate the anomaly-aligned fibers in the DM tendon. Scale bar = 100 μm. d. TNMD staining (upper lane) and OPN staining (bottom lane) of normal tendons and DM tendons. Scale bar = 1 mm. e. Diagram of the construction of DM mice and tenotomy. f. CT scanning of control mice and DM mice receiving sham or tenotomy for 2 or 3 months. The red part indicates ectopic bone. Scale bar = 2 mm. g. The volume of ectopic bone detected in control mice and DM mice which received sham or tenotomy for two or three months. The p-value was calculated by chi-square test (b) or one-way ANOVA, followed by Tukey’s multiple comparisons tests (g). Data are shown as mean ± SD. *p < 0.05; **p < 0.01; ***p < 0.001
Fig. 2
Fig. 2
Tendons in DM mice exhibited a stronger osteochondrogenic change. ab. Safranine O staining of the tendons of Control mice and DM mice receiving sham (a) or tenotomy (b). Dashed boxes indicate the Achilles tendon (a) or osteophyte (b). Scale bar = 100 μm. ce. TNMD (c), RUNX2 (d), and OPN (e) staining of the tendons of the Control mice and DM mice. Scale bar = 100 μm. f. Protein levels of OCT4, NANOG, and p21 in normal TSCs (nTSCs) and diabetic TSCs (dTSCs). g. Protein levels of TNMD, RUNX2, and OPN in nTSCs and dTSCs. h. ALP staining and alizarin red staining of nTSCs and dTSCs cultured in OIM. Scale bar = 1 mm. i. Relative cell counting of TSCs cultured in a 25.5 mmol− 1 glucose medium, adding different concentrations of palmitic acid. j. ALP staining and alizarin red staining of TSCs cultured in low glucose medium and HFHG medium under control or OIM conditions. Scale bar = 1 mm. k. The expression of mRNA relevant to osteogenesis of TSCs cultured in low glucose medium and HFHG medium under control or OIM conditions. The expression of Actb was used as the internal control. l. Protein levels of TNMD, RUNX2, and OPN of TSCs cultured in low glucose medium and HFHG medium under control or OIM conditions. The p-value was calculated by one-way ANOVA, followed by Tukey’s multiple comparisons tests (i, k). Data are shown as mean ± SD. **p < 0.01; ***p < 0.001
Fig. 3
Fig. 3
Disturbed glycolipid metabolism promoted TSC senescence and enhanced osteogenesis. a. The p16 staining of the Achilles tendons of Control mice and DM mice and their quantification. Scale bar = 100 μm. b. The β-Gal staining of nTSCs and dTSCs and their quantification. Scale bar = 50 μm. c. The β-Gal staining of TSCs cultured in low glucose medium and HFHG medium and their quantification. Scale bar = 50 μm. d. The expression of mRNA relevant to SASP of TSCs cultured in low glucose medium and HFHG medium. e. Protein levels of cyclin D1, cyclin B1, and p21 of TSCs cultured in low glucose medium and HFHG medium. f. The β-Gal staining of TSCs cultured in 0, 150, 225, or 300 µM H2O2 and their quantification. Scale bar = 50 μm. g. ALP staining and alizarin red staining (left) and the protein levels of TNMD, RUNX2, and OPN (right) of TSCs cultured in 0, 150, 225, or 300 µM H2O2. Scale bar = 1 mm. h. Protein levels of OCT4, NANOG, and p21 of TSCs after 3 times passage (P3) and 10 times passage (P10). i. Protein levels of RUNX2 and OPN (left) and ALP staining and alizarin red staining (right) of P3 TSCs and P10 TSCs. Scale bar = 1 mm. The p-value was calculated by a two-tailed, unpaired Student’s t-test (a–d) or one-way ANOVA followed by Tukey’s multiple comparisons tests (f). Data are shown as mean ± SD. *p < 0.05; **p < 0.01; ***p < 0.001
Fig. 4
Fig. 4
Increased levels of CXCL13 in DM mice promote the osteogenesis of TSCs. a. mRNA fold changes of differentially expressed genes of RNA extracted from TSCs cultured in HFHG and low glucose. Four biological replicates in each group. b. GO enrichment analysis (left) and KEGG pathway enrichment analysis (right) of upregulated genes (log2FC > 1, p-value < 0.05) according to RNA-seq results. c. GSEA analysis using SASP and CXCR genesets. d. The expression of mRNA of each C-X-C ligand of TSCs cultured in low glucose medium and HFHG medium. The red dotted line indicates the 1-fold. ef. Protein levels of CXCL13 (e) and CXCR5 (f) of TSCs cultured in low glucose medium and HFHG medium. gh. CXCL13 (g) and CXCR5 (h) staining of the Achilles tendons of Control mice and DM mice and their quantification. Scale bar = 100 μm. i. The level of CXCL13 in the serum of the Control and DM mice. j. Diagram of production of HFHG-CM and the ALP staining and alizarin red staining of different treatments, as indicated. Scale bar = 1 mm. The p-value was calculated by a two-tailed unpaired Student’s t-test. *p < 0.05; **p < 0.01; ***p < 0.001
Fig. 5
Fig. 5
The secretion of CXCL13 was promoted by senescent TSCs. ab. mRNA fold changes of multiple secretory factors (a) and C-X-C receptors (b) of 1-day-old and 6-week-old rat tendon tissue, according to the RNA-seq results (GSE158342). cd. Safranine O staining, p16 staining, and CXCL13 staining in 3-month-old, 6-month-old, and 11-month-old mice Achilles tendon (c) and their quantification (d). Dashed lines indicate the Achilles tendon. Red arrows indicate the p16-positive cells. Scale bar = 100 μm. e. Protein levels of CXCR5 and CXCL13 and CXCL13 concentrations of TSCs cultured in 0, 150, 225, or 300 µM H2O2. f. Protein levels of CXCR5 and CXCL13 and CXCL13 concentrations of P3 TSCs and P10 TSCs. g. ALP staining and alizarin red staining of TSCs cultured in 0, 150, 225, or 300 µM H2O2 and knocked down by Cxcl13 using CRISPR/Cas9. Scale bar = 1 mm. h. ALP staining and alizarin red staining of P3 TSCs and P10 TSCs and being knocked down by Cxcl13 using CRISPR/Cas9. Scale bar = 1 mm. The p-value was calculated by one-way ANOVA followed by Tukey’s multiple comparisons tests (d-e) or a two-tailed unpaired Student’s t-test (f). Data are shown as mean ± SD. *p < 0.05; **p < 0.01; ***p < 0.001
Fig. 6
Fig. 6
Suppressing CXCL13 alleviated TSC osteogenesis and HO formation, both in vitro and in vivo. a. Protein levels of TNMD, OPN, RUNX2, and CXCL13 of TSCs cultured in low glucose medium treated with BSA or recombinant CXCL13 (rCXCL13). b. ALP staining and alizarin red staining of TSCs cultured in low glucose medium and treated with BSA or rCXCL13 under control or OIM conditions. Scale bar = 1 mm. c. Protein levels of TNMD, OPN, RUNX2, and CXCL13 of TSCs cultured in HFHG medium infected with Cas9 or sgCxcl13 lentivirus. d. ALP staining and alizarin red staining of TSCs cultured in HFHG medium and infected with Cas9 or sgCxcl13 lentivirus under control or OIM conditions. Scale bar = 1 mm. e. Diagram of the construction of DM mice and treatment with tenotomy and AAV injections. f-g. CT scanning of control or DM mice injected with AAV-si-GFP or AAV-si-Cxcl13 (f) and the quantification of the volume of ectopic bone (g). The p-value was calculated by one-way ANOVA, followed by Tukey’s multiple comparisons tests. Data are shown as mean ± SD. **p < 0.01. N.S., not significant
Fig. 7
Fig. 7
Increased CXCL13 expression in human ossified ligament and DM patient blood serum. a. Safranine O staining, OPN, and CXCL13 staining in normal human ligaments and ossified human ligaments and their quantification. Scale bar = 100 μm. b. Level of CXCL13 in the serum of DM patients. c. Disordered glycolipid metabolism results in the cellular senescence of TSCs. The senescent TSCs activated the CXCL13-CXCR5 axis in an autocrine pattern and enhanced the osteogenesis of the TSCs. The p-value was calculated by paired Student’s t-test (a) or two-tailed unpaired Student’s t-test (b). Data are shown as mean ± SD. *p < 0.05

Similar articles

Cited by

References

    1. Xu R, Hu J, Zhou X, Yang Y. Heterotopic ossification: mechanistic insights and clinical challenges. Bone. 2018;109:134–142. doi: 10.1016/j.bone.2017.08.025. - DOI - PubMed
    1. Mejias Rivera L, Shore EM, Mourkioti F (2024) Cellular and Molecular mechanisms of Heterotopic Ossification in Fibrodysplasia ossificans Progressiva, vol 12. Biomedicines. 10.3390/biomedicines12040779 - PMC - PubMed
    1. de Ruiter RD, Smilde BJ, Pals G, Bravenboer N, Knaus P, Schoenmaker T, et al. Fibrodysplasia ossificans Progressiva: what have we achieved and where are we now? Follow-up to the 2015 Lorentz Workshop. Front Endocrinol (Lausanne) 2021;12:732728. doi: 10.3389/fendo.2021.732728. - DOI - PMC - PubMed
    1. Kaplan FS, Hahn GV, Zasloff MA. Heterotopic ossification: two rare forms and what they can teach us. J Am Acad Orthop Surg. 1994;2:288–296. doi: 10.5435/00124635-199409000-00007. - DOI - PubMed
    1. Maduro AI, Pinto Saraiva A, Pimenta Rodrigues O, Marques M, Malcata SBS, et al. Albright’s hereditary osteodystrophy: an entity to recognize. Rheumatology (Oxford) 2022;61:e356–e357. doi: 10.1093/rheumatology/keac277. - DOI - PubMed

MeSH terms