

Screening of malaria infections in human blood samples with varying parasite densities and anaemic conditions using AI-Powered mid-infrared spectroscopy
- PMID: 38880870
- PMCID: PMC11181574
- DOI: 10.1186/s12936-024-05011-z
Screening of malaria infections in human blood samples with varying parasite densities and anaemic conditions using AI-Powered mid-infrared spectroscopy
Abstract
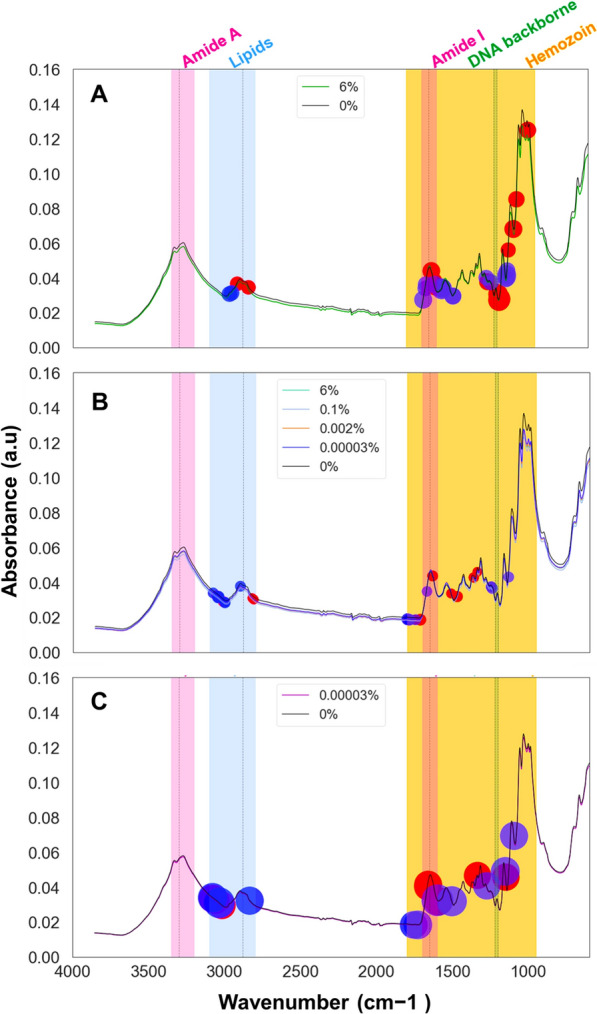
Background: Effective testing for malaria, including the detection of infections at very low densities, is vital for the successful elimination of the disease. Unfortunately, existing methods are either inexpensive but poorly sensitive or sensitive but costly. Recent studies have shown that mid-infrared spectroscopy coupled with machine learning (MIRs-ML) has potential for rapidly detecting malaria infections but requires further evaluation on diverse samples representative of natural infections in endemic areas. The aim of this study was, therefore, to demonstrate a simple AI-powered, reagent-free, and user-friendly approach that uses mid-infrared spectra from dried blood spots to accurately detect malaria infections across varying parasite densities and anaemic conditions.
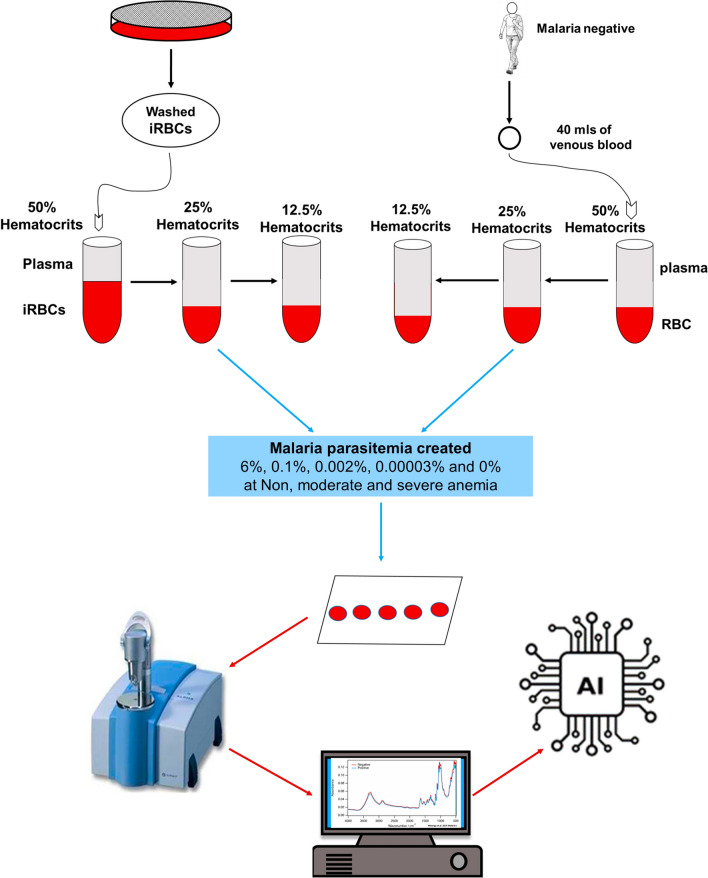
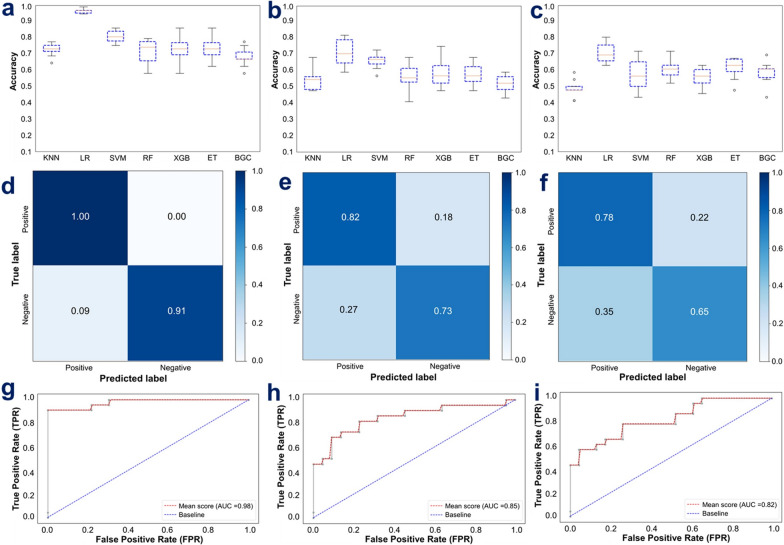
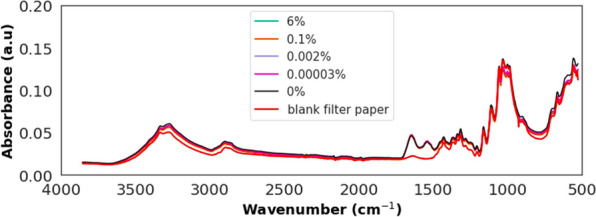
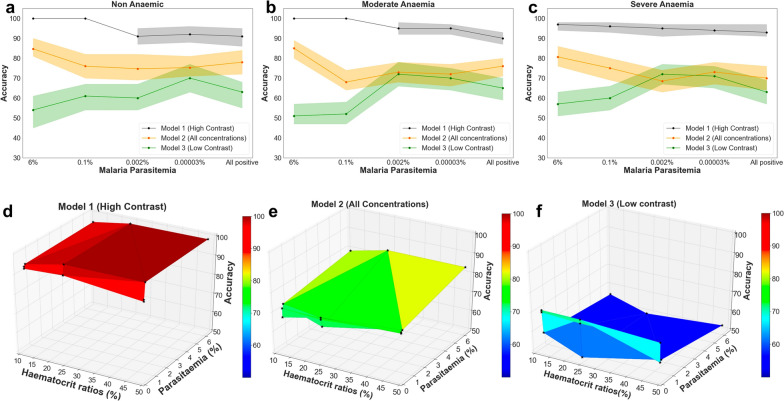
Methods: Plasmodium falciparum strains NF54 and FCR3 were cultured and mixed with blood from 70 malaria-free individuals to create various malaria parasitaemia and anaemic conditions. Blood dilutions produced three haematocrit ratios (50%, 25%, 12.5%) and five parasitaemia levels (6%, 0.1%, 0.002%, 0.00003%, 0%). Dried blood spots were prepared on Whatman™ filter papers and scanned using attenuated total reflection-Fourier Transform Infrared (ATR-FTIR) for machine-learning analysis. Three classifiers were trained on an 80%/20% split of 4655 spectra: (I) high contrast (6% parasitaemia vs. negative), (II) low contrast (0.00003% vs. negative) and (III) all concentrations (all positive levels vs. negative). The classifiers were validated with unseen datasets to detect malaria at various parasitaemia levels and anaemic conditions. Additionally, these classifiers were tested on samples from a population survey in malaria-endemic villages of southeastern Tanzania.
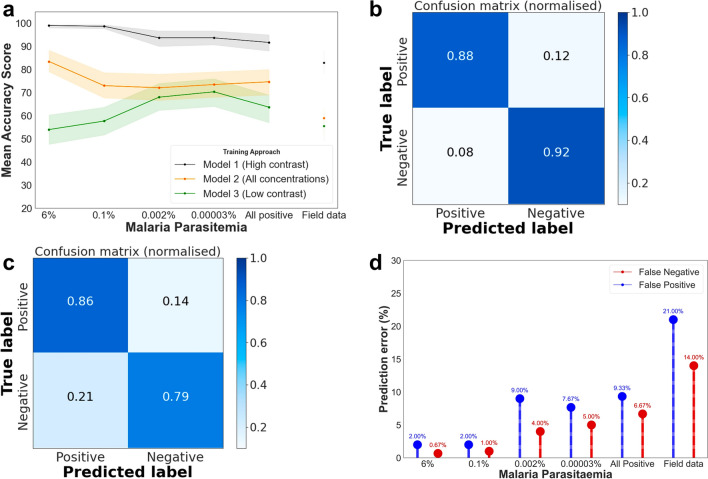
Results: The AI classifiers attained over 90% accuracy in detecting malaria infections as low as one parasite per microlitre of blood, a sensitivity unattainable by conventional RDTs and microscopy. These laboratory-developed classifiers seamlessly transitioned to field applicability, achieving over 80% accuracy in predicting natural P. falciparum infections in blood samples collected during the field survey. Crucially, the performance remained unaffected by various levels of anaemia, a common complication in malaria patients.
Conclusion: These findings suggest that the AI-driven mid-infrared spectroscopy approach holds promise as a simplified, sensitive and cost-effective method for malaria screening, consistently performing well despite variations in parasite densities and anaemic conditions. The technique simply involves scanning dried blood spots with a desktop mid-infrared scanner and analysing the spectra using pre-trained AI classifiers, making it readily adaptable to field conditions in low-resource settings. In this study, the approach was successfully adapted to field use, effectively predicting natural malaria infections in blood samples from a population-level survey in Tanzania. With additional field trials and validation, this technique could significantly enhance malaria surveillance and contribute to accelerating malaria elimination efforts.
© 2024. The Author(s).
Conflict of interest statement
The authors declare no competing interests.
Figures
Similar articles
-
Detection of malaria parasites in dried human blood spots using mid-infrared spectroscopy and logistic regression analysis.Malar J. 2019 Oct 7;18(1):341. doi: 10.1186/s12936-019-2982-9. Malar J. 2019. PMID: 31590669 Free PMC article.
-
Reagent-free detection of Plasmodium falciparum malaria infections in field-collected mosquitoes using mid-infrared spectroscopy and machine learning.Sci Rep. 2024 May 27;14(1):12100. doi: 10.1038/s41598-024-63082-z. Sci Rep. 2024. PMID: 38802488 Free PMC article.
-
A large proportion of asymptomatic Plasmodium infections with low and sub-microscopic parasite densities in the low transmission setting of Temotu Province, Solomon Islands: challenges for malaria diagnostics in an elimination setting.Malar J. 2010 Sep 7;9:254. doi: 10.1186/1475-2875-9-254. Malar J. 2010. PMID: 20822506 Free PMC article.
-
Key considerations, target product profiles, and research gaps in the application of infrared spectroscopy and artificial intelligence for malaria surveillance and diagnosis.Malar J. 2023 Nov 10;22(1):346. doi: 10.1186/s12936-023-04780-3. Malar J. 2023. PMID: 37950315 Free PMC article. Review.
-
Infrared Spectroscopy in Gynecological Oncology: A Comprehensive Review of Diagnostic Potentials and Challenges.Int J Mol Sci. 2024 May 30;25(11):5996. doi: 10.3390/ijms25115996. Int J Mol Sci. 2024. PMID: 38892184 Free PMC article. Review.
Cited by
-
Artificial Intelligence (AI) Applications in Drug Discovery and Drug Delivery: Revolutionizing Personalized Medicine.Pharmaceutics. 2024 Oct 14;16(10):1328. doi: 10.3390/pharmaceutics16101328. Pharmaceutics. 2024. PMID: 39458657 Free PMC article. Review.
-
Comparison of fine-scale malaria strata derived from population survey data collected using RDTs, microscopy and qPCR in South-Eastern Tanzania.Malar J. 2024 Dec 18;23(1):376. doi: 10.1186/s12936-024-05191-8. Malar J. 2024. PMID: 39696325 Free PMC article.
References
-
- WHO . World malaria report. Geneva: World Health Organization; 2023.
-
- WHO . Global technical strategy for malaria 2016–2030. Geneva: World Health Organization; 2015.
-
- Ge Y, Liang D, Cao J, Gosling R, Mushi V, Huang J. How socioeconomic status affected the access to health facilities and malaria diagnosis in children under five years: findings from 19 sub-Saharan African countries. Infect Dis Poverty. 2023;12:29. doi: 10.1186/s40249-023-01075-2. - DOI - PMC - PubMed
MeSH terms
Grants and funding
LinkOut - more resources
Full Text Sources
Miscellaneous
