

Identification of brain-enriched proteins in CSF as biomarkers of relapsing remitting multiple sclerosis
- PMID: 38880880
- PMCID: PMC11181608
- DOI: 10.1186/s12014-024-09494-5
Identification of brain-enriched proteins in CSF as biomarkers of relapsing remitting multiple sclerosis
Abstract
Background: Multiple sclerosis (MS) is a clinically and biologically heterogenous disease with currently unpredictable progression and relapse. After the development and success of neurofilament as a cerebrospinal fluid (CSF) biomarker, there is reinvigorated interest in identifying other markers of or contributors to disease. The objective of this study is to probe the predictive potential of a panel of brain-enriched proteins on MS disease progression and subtype.
Methods: This study includes 40 individuals with MS and 14 headache controls. The MS cohort consists of 20 relapsing remitting (RR) and 20 primary progressive (PP) patients. The CSF of all individuals was analyzed for 63 brain enriched proteins using a method of liquid-chromatography tandem mass spectrometry. Wilcoxon rank sum test, Kruskal-Wallis one-way ANOVA, logistic regression, and Pearson correlation were used to refine the list of candidates by comparing relative protein concentrations as well as relation to known imaging and molecular biomarkers.
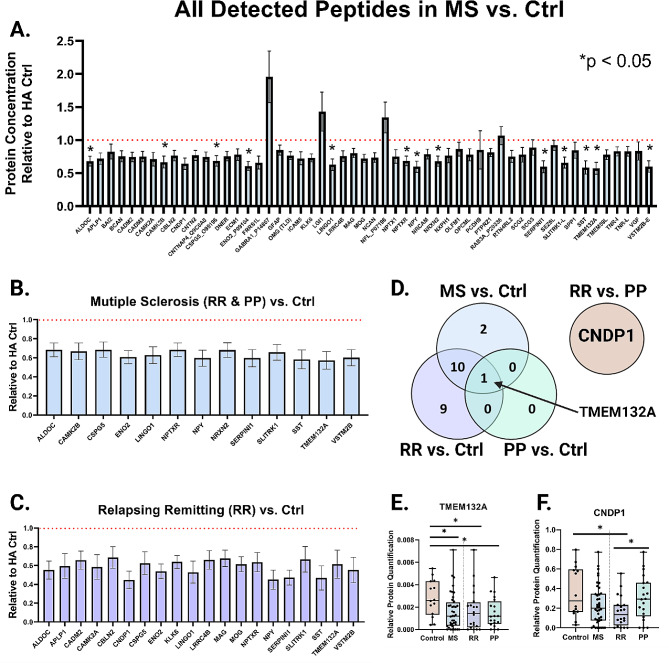
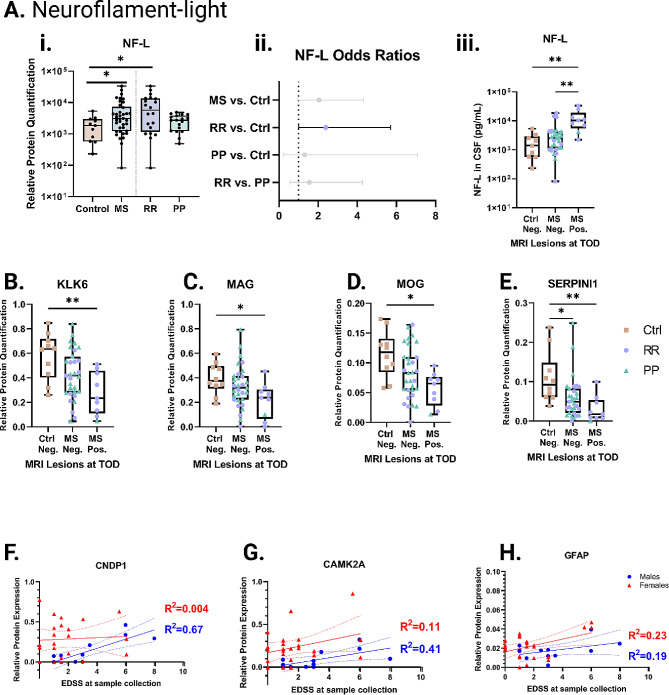
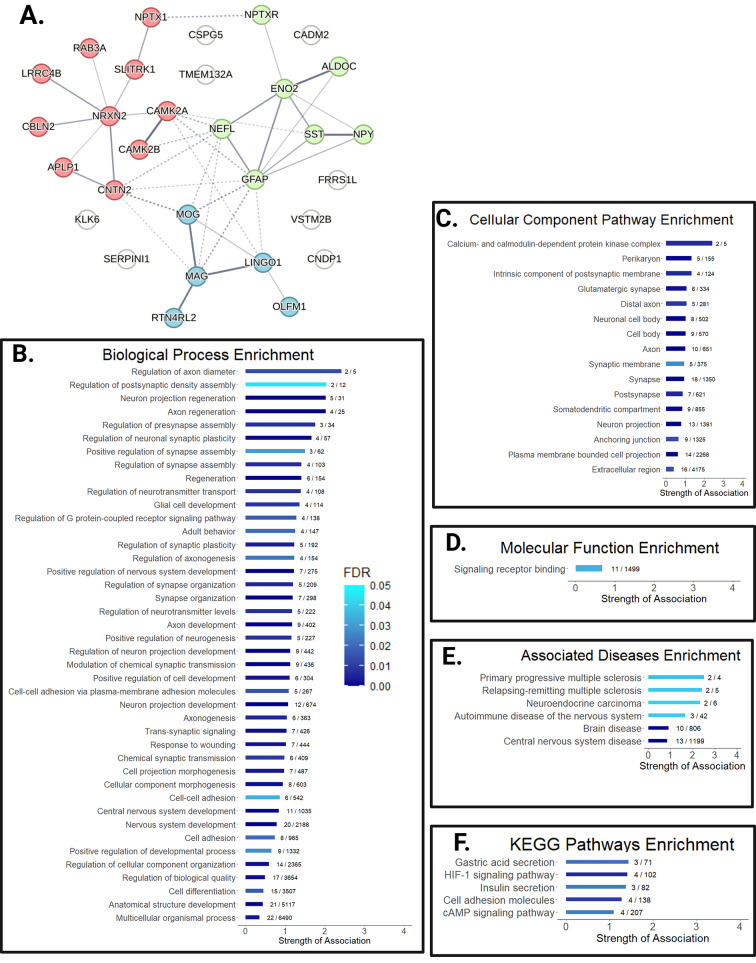
Results: We report 30 proteins with some relevance to disease, clinical subtype, or severity. Strikingly, we observed widespread protein depletion in the disease CSF as compared to control. We identified numerous markers of relapsing disease, including KLK6 (kallikrein 6, OR = 0.367, p < 0.05), which may be driven by active disease as defined by MRI enhancing lesions. Other oligodendrocyte-enriched proteins also appeared at reduced levels in relapsing disease, namely CNDP1 (carnosine dipeptidase 1), LINGO1 (leucine rich repeat and Immunoglobin-like domain-containing protein 1), MAG (myelin associated glycoprotein), and MOG (myelin oligodendrocyte glycoprotein). Finally, we identified three proteins-CNDP1, APLP1 (amyloid beta precursor like protein 1), and OLFM1 (olfactomedin 1)-that were statistically different in relapsing vs. progressive disease raising the potential for use as an early biomarker to discriminate clinical subtype.
Conclusions: We illustrate the utility of targeted mass spectrometry in generating potential targets for future biomarker studies and highlight reductions in brain-enriched proteins as markers of the relapsing remitting disease stage.
Keywords: Biomarkers; CSF; Multiple sclerosis; Proteomics.
© 2024. The Author(s).
Conflict of interest statement
The authors declare no competing interests.
Figures


Similar articles
-
Glial and neuroaxonal biomarkers in a multiple sclerosis (MS) cohort.Hell J Nucl Med. 2019 Sep-Dec;22 Suppl 2:113-121. Hell J Nucl Med. 2019. PMID: 31802051
-
Protein biomarkers for multiple sclerosis: semi-quantitative analysis of cerebrospinal fluid candidate protein biomarkers in different forms of multiple sclerosis.Mult Scler. 2012 Aug;18(8):1081-91. doi: 10.1177/1352458511433303. Epub 2012 Jan 17. Mult Scler. 2012. PMID: 22252467
-
Cerebrospinal fluid sulfatide isoforms lack diagnostic utility in separating progressive from relapsing-remitting multiple sclerosis.Mult Scler Relat Disord. 2023 Jun;74:104705. doi: 10.1016/j.msard.2023.104705. Epub 2023 Apr 5. Mult Scler Relat Disord. 2023. PMID: 37060853
-
Mitoxantrone: a review of its use in multiple sclerosis.CNS Drugs. 2004;18(6):379-96. doi: 10.2165/00023210-200418060-00010. CNS Drugs. 2004. PMID: 15089110 Review.
-
[Current questions of multiple sclerosis: the secunder progressive form of the disease].Ideggyogy Sz. 2020 Jan 30;73(1-2):7-14. doi: 10.18071/isz.73.0007. Ideggyogy Sz. 2020. PMID: 32057199 Review. Hungarian.
Cited by
-
Comprehensive Meta-Analysis of Differentially Expressed Proteins in Cerebrospinal Fluid Associated with Multiple Sclerosis.Int J Mol Sci. 2025 Jun 26;26(13):6171. doi: 10.3390/ijms26136171. Int J Mol Sci. 2025. PMID: 40649948 Free PMC article. Review.
References
Grants and funding
LinkOut - more resources
Full Text Sources
Research Materials
Miscellaneous