Tumor promoting effect of PDLIM2 downregulation involves mitochondrial ROS, oncometabolite accumulations and HIF-1α activation
- PMID: 38880883
- PMCID: PMC11181580
- DOI: 10.1186/s13046-024-03094-9
Tumor promoting effect of PDLIM2 downregulation involves mitochondrial ROS, oncometabolite accumulations and HIF-1α activation
Abstract
Background: Cancer is characterized by dysregulated cellular metabolism. Thus, understanding the mechanisms underlying these metabolic alterations is important for developing targeted therapies. In this study, we investigated the pro-tumoral effect of PDZ and LIM domain 2 (PDLIM2) downregulation in lung cancer growth and its association with the accumulation of mitochondrial ROS, oncometabolites and the activation of hypoxia-inducible factor-1 (HIF-1) α in the process.
Methods: Databases and human cancer tissue samples were analyzed to investigate the roles of PDLIM2 and HIF-1α in cancer growth. DNA microarray and gene ontology enrichment analyses were performed to determine the cellular functions of PDLIM2. Seahorse assay, flow cytometric analysis, and confocal microscopic analysis were employed to study mitochondrial functions. Oncometabolites were analyzed using liquid chromatography-mass spectrometry (LC-MS). A Lewis lung carcinoma (LLC) mouse model was established to assess the in vivo function of PDLIM2 and HIF-1α.
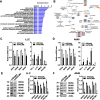
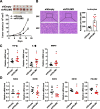
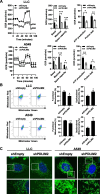
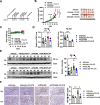
Results: The expression of PDLIM2 was downregulated in lung cancer, and this downregulation correlated with poor prognosis in patients. PDLIM2 highly regulated genes associated with mitochondrial functions. Mechanistically, PDLIM2 downregulation resulted in NF-κB activation, impaired expression of tricarboxylic acid (TCA) cycle genes particularly the succinate dehydrogenase (SDH) genes, and mitochondrial dysfunction. This disturbance contributed to the accumulation of succinate and other oncometabolites, as well as the buildup of mitochondrial reactive oxygen species (mtROS), leading to the activation of hypoxia-inducible factor 1α (HIF-1α). Furthermore, the expression of HIF-1α was increased in all stages of lung cancer. The expression of PDLIM2 and HIF-1α was reversely correlated in lung cancer patients. In the animal study, the orally administered HIF-1α inhibitor, PX-478, significantly reduces PDLIM2 knockdown-promoted tumor growth.
Conclusion: These findings shed light on the complex action of PDLIM2 on mitochondria and HIF-1α activities in lung cancer, emphasizing the role of HIF-1α in the tumor-promoting effect of PDLIM2 downregulation. Additionally, they provide new insights into a strategy for precise targeted treatment by suggesting that HIF-1α inhibitors may serve as therapy for lung cancer patients with PDLIM2 downregulation.
Keywords: HIF-1α; HIF-1α inhibitor; Mitochondria; PDLIM2; Succinate; Succinate dehydrogenase.
© 2024. The Author(s).
Conflict of interest statement
The authors declare no competing interests.
Figures


Similar articles
-
PDLIM2 acts as a cancer suppressor gene in non-small cell lung cancer via the down regulation of NF-κB signaling.Mol Cell Probes. 2020 Oct;53:101628. doi: 10.1016/j.mcp.2020.101628. Epub 2020 Jul 1. Mol Cell Probes. 2020. PMID: 32621848
-
HIF-1α is necessary for activation and tumour-promotion effect of cancer-associated fibroblasts in lung cancer.J Cell Mol Med. 2021 Jun;25(12):5457-5469. doi: 10.1111/jcmm.16556. Epub 2021 May 4. J Cell Mol Med. 2021. PMID: 33943003 Free PMC article.
-
Reactive oxygen species-generating mitochondrial DNA mutation up-regulates hypoxia-inducible factor-1alpha gene transcription via phosphatidylinositol 3-kinase-Akt/protein kinase C/histone deacetylase pathway.J Biol Chem. 2009 Nov 27;284(48):33185-94. doi: 10.1074/jbc.M109.054221. Epub 2009 Oct 1. J Biol Chem. 2009. PMID: 19801684 Free PMC article.
-
Mitochondrial metabolism, redox signaling, and fusion: a mitochondria-ROS-HIF-1alpha-Kv1.5 O2-sensing pathway at the intersection of pulmonary hypertension and cancer.Am J Physiol Heart Circ Physiol. 2008 Feb;294(2):H570-8. doi: 10.1152/ajpheart.01324.2007. Epub 2007 Dec 14. Am J Physiol Heart Circ Physiol. 2008. PMID: 18083891 Review.
-
TSGA10 as a Model of a Thermal Metabolic Regulator: Implications for Cancer Biology.Cancers (Basel). 2025 May 23;17(11):1756. doi: 10.3390/cancers17111756. Cancers (Basel). 2025. PMID: 40507237 Free PMC article. Review.
Cited by
-
Role of mitochondria in physiological activities, diseases, and therapy.Mol Biomed. 2025 Jun 19;6(1):42. doi: 10.1186/s43556-025-00284-5. Mol Biomed. 2025. PMID: 40536597 Free PMC article. Review.
-
Beyond structural domains: the emerging roles of PDLIM2 in cellular signaling and cancer progression.Front Physiol. 2025 May 22;16:1569285. doi: 10.3389/fphys.2025.1569285. eCollection 2025. Front Physiol. 2025. PMID: 40476213 Free PMC article. Review.
-
GuBenPeiYuan Formula Inhibits Lung Cancer Metastasis by Suppressing Myeloid-Derived Suppressor Cells and Related Immune Cells.Integr Cancer Ther. 2025 Jan-Dec;24:15347354251324650. doi: 10.1177/15347354251324650. Epub 2025 Apr 16. Integr Cancer Ther. 2025. PMID: 40237740 Free PMC article.
-
Construction and validation of a prognostic model based on oxidative stress-related genes in non-small cell lung cancer (NSCLC): predicting patient outcomes and therapy responses.Transl Lung Cancer Res. 2024 Nov 30;13(11):3152-3174. doi: 10.21037/tlcr-24-888. Epub 2024 Nov 28. Transl Lung Cancer Res. 2024. PMID: 39669999 Free PMC article.
-
Mitochondrial Reactive Oxygen Species (mROS) Generation and Cancer: Emerging Nanoparticle Therapeutic Approaches.Int J Nanomedicine. 2025 May 13;20:6085-6119. doi: 10.2147/IJN.S510972. eCollection 2025. Int J Nanomedicine. 2025. PMID: 40385494 Free PMC article. Review.
References
-
- Gregorio Di J, Petricca S, Iorio R, Toniato E, Flati V. Mitochondrial and metabolic alterations in cancer cells. Eur J Cell Biol. 2022;101(3):151225. - PubMed
MeSH terms
Substances
LinkOut - more resources
Full Text Sources
Molecular Biology Databases

