. 2024 Jun 17;10(1):15.
doi: 10.1186/s42234-024-00147-4.

Using neural biomarkers to personalize dosing of vagus nerve stimulation

Affiliations

Using neural biomarkers to personalize dosing of vagus nerve stimulation

Antonin Berthon et al. Bioelectron Med. .

Abstract

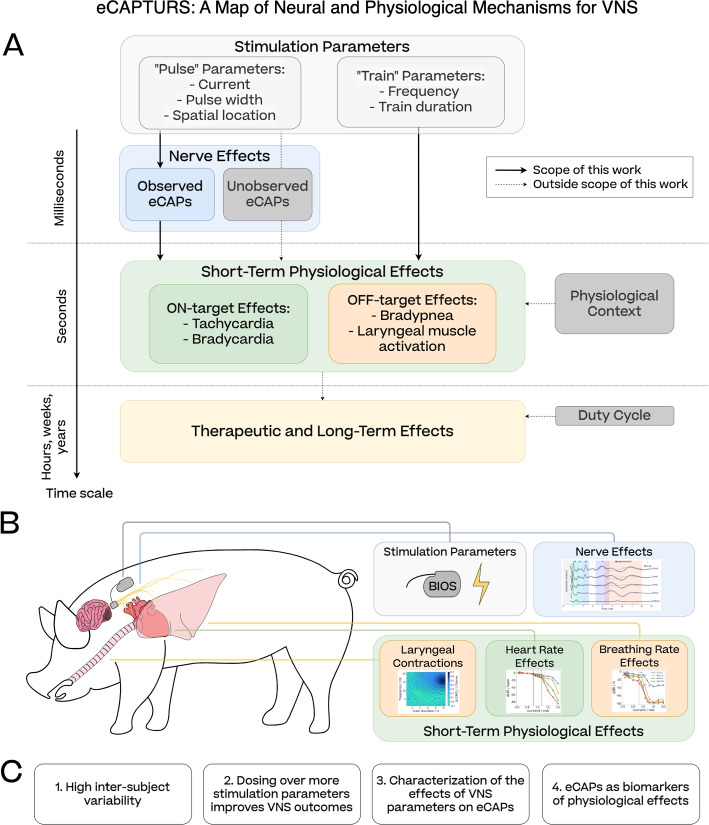
Background: Vagus nerve stimulation (VNS) is an established therapy for treating a variety of chronic diseases, such as epilepsy, depression, obesity, and for stroke rehabilitation. However, lack of precision and side-effects have hindered its efficacy and extension to new conditions. Achieving a better understanding of the relationship between VNS parameters and neural and physiological responses is therefore necessary to enable the design of personalized dosing procedures and improve precision and efficacy of VNS therapies.

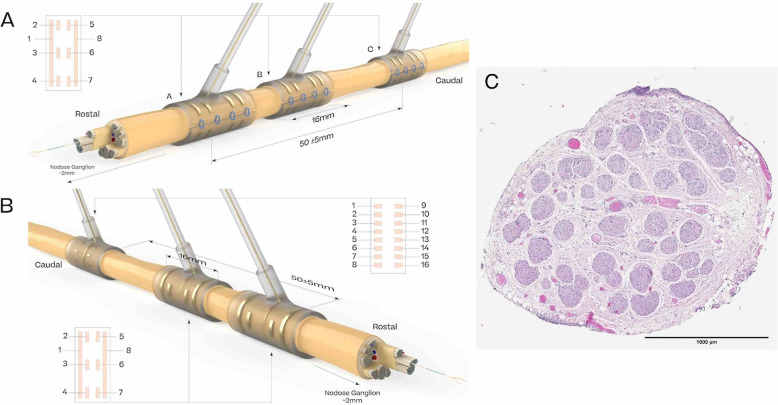
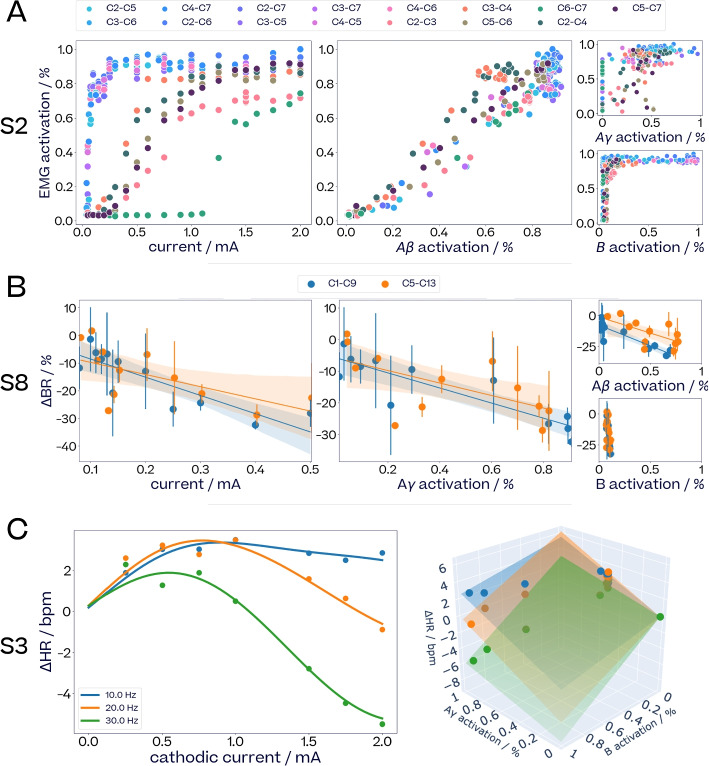
Methods: We used biomarkers from recorded evoked fiber activity and short-term physiological responses (throat muscle, cardiac and respiratory activity) to understand the response to a wide range of VNS parameters in anaesthetised pigs. Using signal processing, Gaussian processes (GP) and parametric regression models we analyse the relationship between VNS parameters and neural and physiological responses.

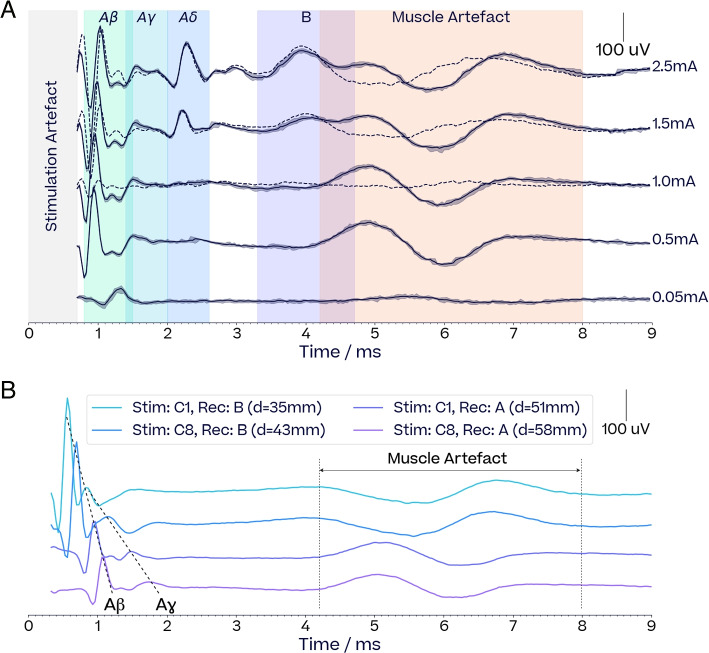
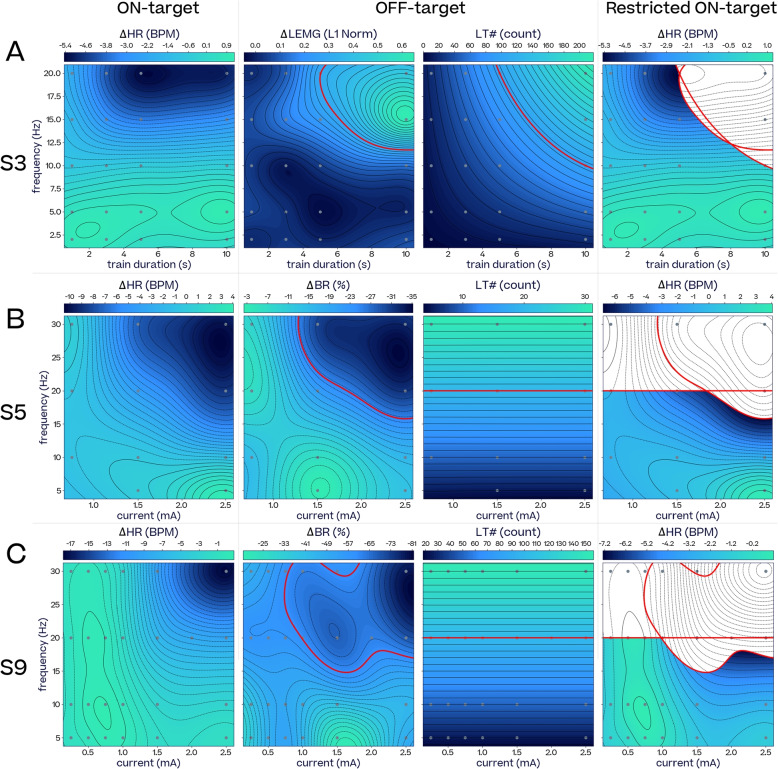
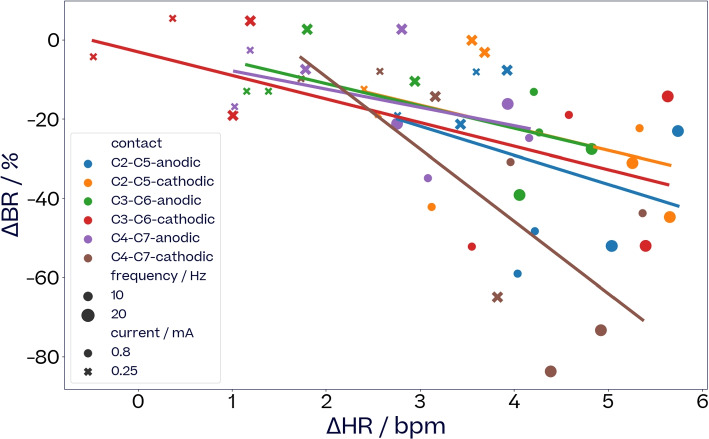
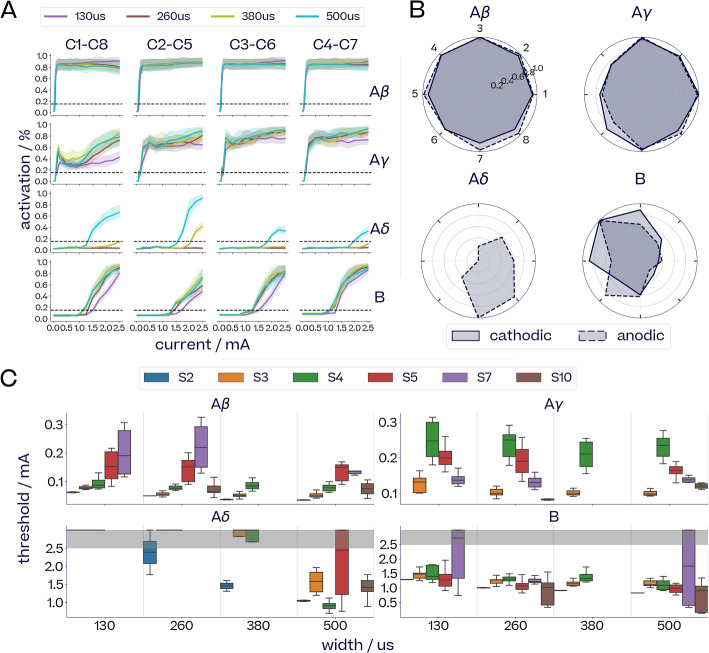
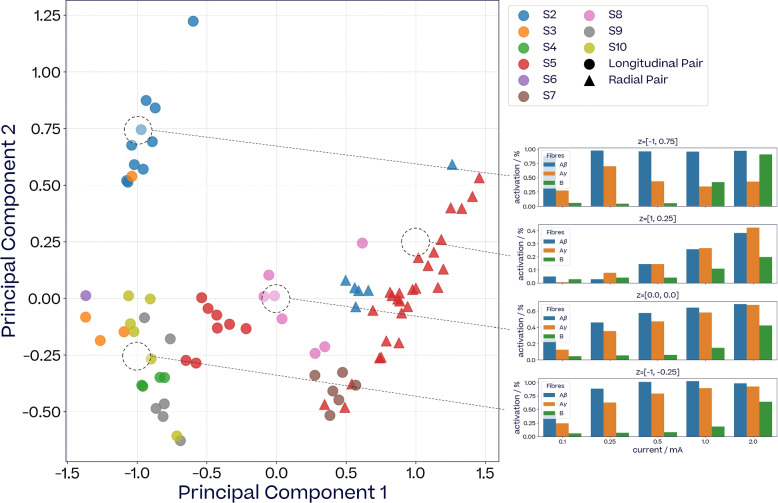
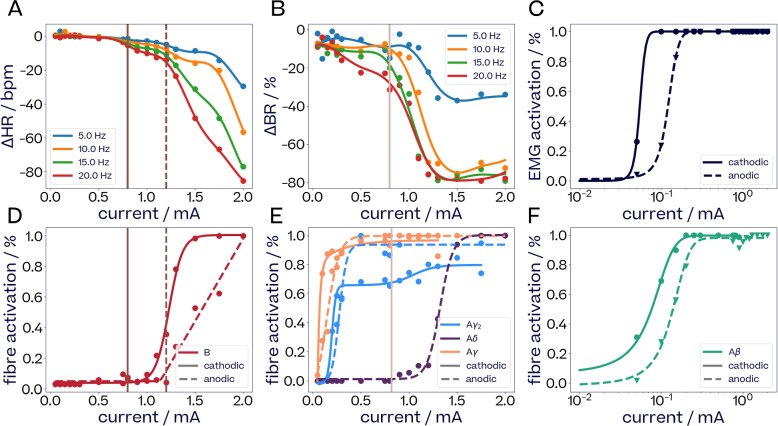
Results: Firstly, we illustrate how considering multiple stimulation parameters in VNS dosing can improve the efficacy and precision of VNS therapies. Secondly, we describe the relationship between different VNS parameters and the evoked fiber activity and show how spatially selective electrodes can be used to improve fiber recruitment. Thirdly, we provide a detailed exploration of the relationship between the activations of neural fiber types and different physiological effects. Finally, based on these results, we discuss how recordings of evoked fiber activity can help design VNS dosing procedures that optimize short-term physiological effects safely and efficiently.

Conclusion: Understanding of evoked fiber activity during VNS provide powerful biomarkers that could improve the precision, safety and efficacy of VNS therapies.

Keywords: Biomarker; Heart failure; Neuromodulation; Vagus nerve stimulation.


Conflict of interest statement

All authors, except AT, are (or were at the time of their contribution) employees of BIOS Health Ltd., and declare that BIOS Health has filed US and international patent applications relating to a system, apparatus and method for utilising neural biomarker response in clinical decision-making. The concepts of this work is contained in the UK Patent GB 2214547.8. AT declares a consulting role with BIOS Health at the time the research was conducted. GL holds a position at the Université de Montréal and Mila-Quebec AI Institute and declares receiving funding from BIOS Health Ltd topics related to the present publication, but that was not in place at the time of the development of this manuscript.

Figures

Fig. 1
Fig. 1
A Overview of the eCAPTURS framework (eCAPs To Unravel Responses to Stimulation), showing the relationship between stimulation parameters and responses on the nerve and the physiological level investigated in this study. The three solid arrows represent the main focus of this study. Light grey boxes indicate VNS parameters, as defined in North et al. (2022). The physiological state captures any bodily variables that might affect the short-term responses to stimulations, such as baseline heart rate or breathing rate, timing of the stimulation with respect to the cardiac (Ojeda et al. 2016) or breathing cycle (Sclocco et al. 2019) or anaesthesia (see Translation from anaesthetised to awake subjects section). B High-level representation of our VNS setting on porcine subjects: our custom neural interface delivers stimulations to the cervical vagus nerve while evoked fiber activity and short-term physiological effects (laryngeal contractions, heart rate and breathing rate changes) are recorded. C Key results reported in this study
Fig. 2
Fig. 2
Representation of the cuff layout for Group 1 (A), Group 2 (B) subjects, and illustration of the histology of the vagus nerve (C)
Fig. 3
Fig. 3
Recordings of evoked compound action potentials (eCAPs) A Neurograms at increasing currents (pulse width 500μs, frequency 10 Hz, duration 1 s). Solid lines and confidence intervals respectively show the average and 5th/95th percentiles of the detrended response across the 10 pulses forming each stimulation train. For currents >=1.0 mA, dotted lines show the average response after substracting the average 0.5 mA response to isolate the B-fiber eCAP from the muscle artefact. The stimulation artefacts are not shown as these are detrended responses. Raw recordings with the stimulation artefact are shown in the Supplementary Materials. B Propagation of the neural signal between different stimulation sites and recording locations for Aβ and Aγ eCAPs (current 0.25 mA, pulse width 130μs, frequency 10 Hz, train 1 s). Cuffs A, B and C correspond to Group 1 cuff layout, as illustrated Fig. 2. Distances between the stimulation and recording site are shown in the legend. The propagation of the Aβ and Aγ eCAPs are consistent with known conduction velocities. The location of the muscle artefact between 4-8 ms is independent of the distance of each recording cuff to the stimulation cuff. The polarity changes since the bipolar electrode arrangement is reversed between the two cuffs
Fig. 4
Fig. 4
On-target ΔHR restricted by off-targets, ΔBR, ΔlEMG and laryngeal twitch count (LT). A From left to right: Subject S3 ΔHR, ΔlEMG, LT and the frequency-train duration space available (non-blank) for ΔHR adjustment when ΔlEMG>0.3 of maximum activation and LT>100 should be avoided (current 1.5 mA, pulse width 250μs) B From left to right: Subject S5 ΔHR, ΔBR, LT, and the frequency-current space available (non-blank) for ΔHR adjustment when ΔBR<-25% and LT>20 should be avoided (train duration 1 s, pulse width 500μs). C From left to right: Subject S9 ΔHR, ΔBR, LT and the frequency-current space available (non-blank) for ΔHR adjustment when ΔBR<-60% and LT>100 should be avoided (train duration 5 s, pulse width 250μs)
Fig. 5
Fig. 5
Relationship of ΔHR to ΔBR dependent on electrode location. Effect on HR and BR for six different stimulation locations (three electrode pairs, two polarities for each) pulse width was 500μs with train durations of 3 s and 5 s, current is in mA and frequency in Hz. The train duration had no statistical effect on the relationship and is therefore not specifically labelled in the graphs. The overall location effect is significant (ANOVA, F(5,39)=3.6, p<9.2e-3). There is a significant difference in the slopes of C4-C7-cathodic compared to other contacts (ANOVA, F(1,43)=12.8, p<8.9e-4)
Fig. 6
Fig. 6
Effect of pulse parameters on fiber recruitment. A Dose response curves, normalised by the maximum found per fiber for subject S3. B Maximal fiber activation reached from each location in S5, normalised by the highest activation reached across locations for each polarity. C Distribution of neural thresholds across different subjects and pulse widths. The maximum amplitude was 2.5 mA, and points at 3.0 mA signal that the threshold was not reached by 2.5 mA. Pulse width was found statistically significant across all fiber types (ANOVA F-test: p<5.7e-17, F=76.6) and for each fiber type (Aβ: p<8.5e-3, F=7.2; Aγ: p<7.5e-4, F=12.1; Aδ: p<6.8e-15, F=94.5; B: p<1.4e-3, F=10.8)
Fig. 7
Fig. 7
2D PCA projection of evoked fiber responses across subjects and stimulation locations. Each marker represents the 2D PCA projection of a 15-dimensions evoked fiber activations vector ((Aβ, Aγ, B) × (0.1, 0.25, 0.5, 1.0, 2.0)mA, pulse width 260μs) from a given stimulation location. Markers are color-coded by subject. Radial stimulation pairs are indicated with triangles. Bar plots on the right-hand side show the reverse projections of different points sampled from the two-dimensional space (labelled as z)
Fig. 8
Fig. 8
Comparison of dose-response curves of HR and BR change, EMG activations and neural fiber activations for subject S6. Left column (panels A and D): change in heart rate and the recruitment of B-fibers. Vertical lines (brown) for ΔHR indicate the onset of mild bradycardia at 0.8 mA (solid) and of a stronger one at 1.2 mA (dashed). The same lines in the B-fiber activation plot correspond to onset of recruitment of cathodic B-fibers (solid) and anodic B-fibers (dashed). Middle column (panels B and E): change in breathing rate and the recruitment of A-fibers. A vertical line (beige) for ΔBR indicates the onset of strong bradypnea at 0.8 mA. The same line in the A-fiber activation plot corresponds to onset of recruitment of anodic Aδ-fibers. Right column (panels C and F): EMG activation and the recruitment of Aβ-fibers. EMG activation happens at the same currents as Aβ-fiber recruitment for both cathodic and anodic pulses. General notes: frequency is not shown since it had no effect on eCAPs. Data points that fell below 0.9 of the maximum after a sequence reached its maximum have been removed as outliers. Trend lines for physiological and fibre activation observations are computed in order to make the general trends easier to discern. Methods used include sigmoid curves, sum of two sigmoids, two-exponentials, softplus as well as GP regression
Fig. 9
Fig. 9
Physiological effects, stimulation parameters and fiber activation. A Left: Amplitude of VNS-induced laryngeal twitches in S2, plotted against current amplitude; Middle and right: activation of Aβ-fibers, and activation of Aγ- and B-fibers across different radial and longitudinal stimulation locations. B Changes in breathing rate in subject S8 (pulse width 130μs, frequency 5 Hz, train duration 1 s) in response to current (Left) Aγ-fiber activation (Middle) and Aβ- and B-fibers activations (Right). Confidence intervals show one standard deviation for stimulations that were done more than once. Linear models are fitted for each of the two stimulation locations. The difference in slopes between the two contacts was significant for Aβ-activation (ANOVA, F=7.68, p<0.01), and not for current (F=0.72, p=0.40), Aγ-fiber activation (F=0.53, p=0.47) or B-fiber activation (F=0.29, p=0.60). C Left: change in heart rate in response to current and frequency changes of stimuli in S3 (pulse width 500μs, train duration 5 s). Right: the same change in heart rate, plotted in three dimensions against the activation of Aγ- and B-fibers. 2D linear models are fitted for each frequency. (0, 0, 0) points are added to anchor the surfaces to the origin. All fiber activations are normalised based on the maximum fiber activations recorded across each subject

Similar articles

Cited by

References

    1. Ahmed U, Chang YC, Lopez MF, Wong J, Datta-Chaudhuri T, Rieth L, et al. Implant- and anesthesia-related factors affecting cardiopulmonary threshold intensities for vagus nerve stimulation. J Neural Eng. 2021;18(4):046075. doi: 10.1088/1741-2552/ac048a. - DOI - PubMed
    1. Ardell JL, Nier H, Hammer M, Southerland EM, Ardell CL, Beaumont E, et al. Defining the neural fulcrum for chronic vagus nerve stimulation: implications for integrated cardiac control. J Physiol. 2017;595(22):6887–6903. doi: 10.1113/JP274678. - DOI - PMC - PubMed
    1. Ardesch JJ, Sikken JR, Veltink PH, van der Aa HE, Hageman G, Buschman HPJ. Vagus nerve stimulation for epilepsy activates the vocal folds maximally at therapeutic levels. Epilepsy Res. 2010;89(2–3):227–231. doi: 10.1016/j.eplepsyres.2010.01.005. - DOI - PubMed
    1. Aristovich K, Donega M, Fjordbakk C, Tarotin I, Chapman C, Viscasillas J, et al. Model-based geometrical optimisation and in vivo validation of a spatially selective multielectrode cuff array for vagus nerve neuromodulation. arXiv:1903.12459 [physics]. 2020. ArXiv: 1903.12459. - PubMed
    1. Austelle CW, O’Leary GH, Thompson S, Gruber E, Kahn A, Manett AJ, et al. A Comprehensive Review of Vagus Nerve Stimulation for Depression. Neuromodulation J Int Neuromodulation Soc. 2022;25(3):309–315. doi: 10.1111/ner.13528. - DOI - PMC - PubMed

LinkOut - more resources