. 2024 Mar 15;4(5):100516.
doi: 10.1016/j.xops.2024.100516. eCollection 2024 Sep-Oct.

Dose-Dependent Progression of Chorioretinal Atrophy at the Injection Site After Subretinal Injection of rAAV2/8 in Nonhuman Primates

Affiliations

Dose-Dependent Progression of Chorioretinal Atrophy at the Injection Site After Subretinal Injection of rAAV2/8 in Nonhuman Primates

Immanuel P Seitz et al. Ophthalmol Sci. .

Abstract

Objective: Progressive retinal atrophy has been described after subretinal gene therapy utilizing the adeno-associated virus (AAV) vector platform. To elucidate whether this atrophy is a consequence of inherent properties of AAV, or if it is related to the surgical trauma of subretinal delivery, we analyzed data from an Investigational New Drug-enabling study for PDE6A gene therapy in nonhuman primates.

Design: Animal study (nonhuman primates), retrospective data analysis.

Subjects: Forty eyes of 30 healthy nonhuman primates (macaca fascicularis) were included in the analysis. Two AAV dose levels (low: 1x10E11, high: 1x10E12) were compared with sham injection (balanced saline solution; BSS). Twenty untreated eyes were not analyzed.

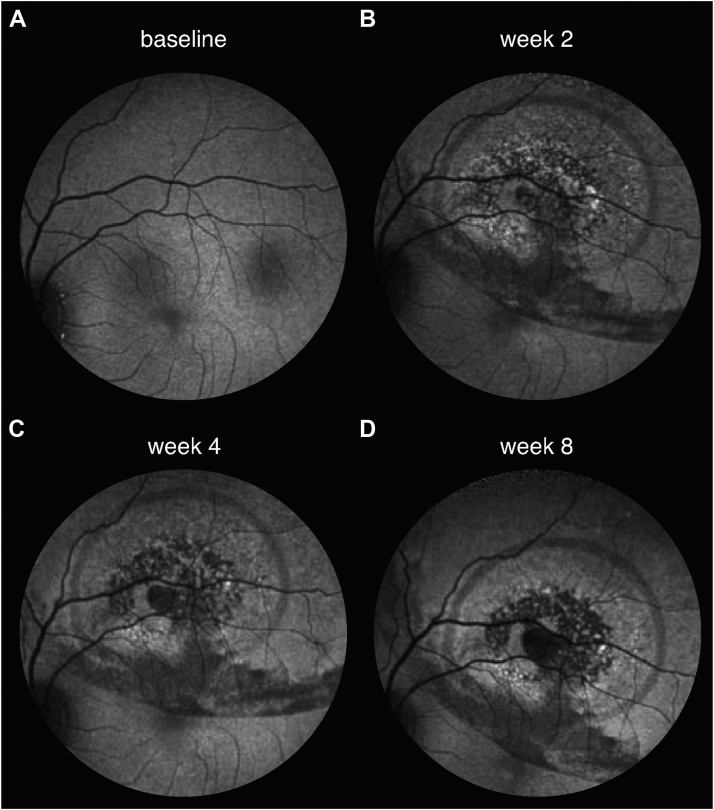
Methods: Animals were treated with a sutureless 23G vitrectomy and single subretinal injections of AAV.PDE6A and/or BSS. The follow-up period was 12 weeks. Atrophy development was followed using fundus autofluorescence (AF), OCT, fluorescence angiography, and indocyanine green angiography.

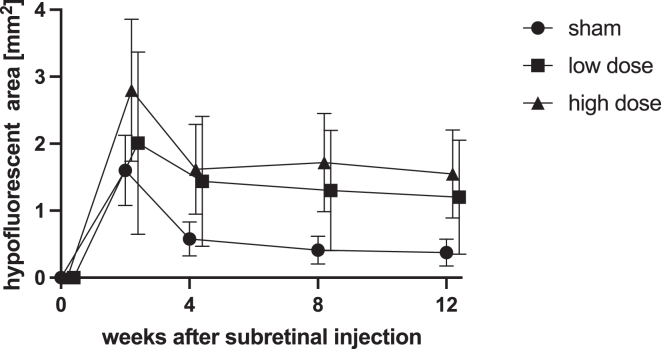
Main outcome measures: Area [mm2] of retinal pigment epithelium atrophy on AF. Presence of outer retinal atrophy on optical coherence tomography. Area [mm2] of hyperfluorescence in fluorescence angiography and hypofluorescence in indocyanine green angiography.

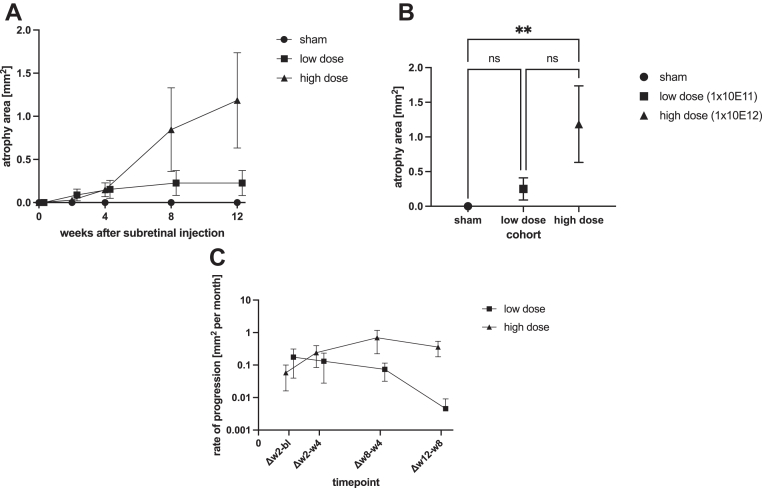
Results: Progressive atrophy at the injection site developed in 54% of high-dose-treated, 27% of low-dose-treated, and 0% of sham-treated eyes. At the end of observation, the mean ± SD area of atrophy in AF was 1.19 ± 1.75 mm2, 0.25 ± 0.50 mm2, and 0.0 ± 0.0 mm2, respectively (sham × high dose: P = 0.01). Atrophic lesions in AF (P = 0.01) and fluorescence angiography (P = 0.02) were significantly larger in high-dose-treated eyes, compared with sham-treated eyes. Rate of progression in high-dose-treated eyes was 4.1× higher compared with low-dose-treated eyes.

Conclusion: Subretinal injection of AAV.PDE6A induced dose-dependent, progressive retinal atrophy at the site of injection. Findings from multimodal imaging were in line with focal, transient inflammation within the retina and choroid and secondary atrophy. Atrophic changes after gene therapy with AAV-based vector systems are not primarily due to surgical trauma and increase with the dose given.

Financial disclosures: Proprietary or commercial disclosure may be found in the Footnotes and Disclosures at the end of this article.

Keywords: AAV; atrophy; gene therapy; inflammation; nonhuman primates.


Figures

Figure 1
Figure 1
Atrophy at the injection site was quantified using fundus autofluorescence imaging (AF, top) and verified using OCT (bottom). Measurements were taken with the proprietary Heidelberg Engineering Eye Explorer (HEYEX 2). Sample measurement: 1.22 mm2. Areas of atrophy were verified using OCT (white arrows) to exclude false positive calls of atrophy in areas with confounding effects interfering with AF signal (e.g., pigment displacement – AF image: faint hypofluorescent arch along inferior bleb margin).
Figure 2
Figure 2
A, Injection site atrophy area as quantified by autofluorescence (AF) over time by group. Mean ± standard error of the mean (SEM). There was a dose-dependent development of atrophy at the injection site. Starting by week 8, high-dose-treated animals developed relevant atrophic lesions around the injection site. Low-dose-treated animals displayed small lesions sizes, with no significant progression. No atrophy developed at the injection site in sham-injected animals. B, One-way ANOVA with multiple comparisons of atrophic lesion size at the end of observation (week 12) by group. Mean ± SEM. At the end of observation there was statistically significant (P = 0.01) development of atrophy at the injection site in high-dose-treated animals, compared to sham-injected animals. This was not observed in low-dose-treated animals (P = 0.78). C, Rate of progression, log scale. Progression rate seemed to follow a linear function despite its quadratic nature (area). This indicates a slowdown of the progression rate in both treatment groups between weeks 8 and 12. ANOVA = analysis of variance.
Figure 3
Figure 3
Sample difference in findings between sham- and high-dose-injected eyes of the same animal. A, Sham-treated eye: Surgery-related changes on fundus autofluorescence (AF) included mechanical displacement of pigment and were observed in all eyes, including sham. The displaced pigment settled mostly along the prebleb and bleb margins (2 hypofluorescent rings). B, High-dose-treated eye: In addition to pigment displacement, there is a clearly delineated lack of fluorescence indicating atrophy of the retinal pigment epithelium (RPE). Dotted line: location of OCT scan displayed in (C). C, Corresponding OCT image demonstrates that the area of RPE atrophy indicated by lack of AF signal also shows atrophy of the outer retina (ellipsoid zone, external limiting membrane, outer nuclear layer, and outer plexiform layer). Together this demonstrates retinal atrophy at the injection site (black area in the bleb center).
Figure 4
Figure 4
Mottled phenotype leading into atrophy. In one eye, enlargement of the atrophic area was preceded by pronounced “salt-and-pepper”-like mottling. The area of this lesion was captured on fundus-autofluorescence at baseline (A), week 2 (B), week 4 (C) and week 8 (D). Both the central defect and the mottled changes surrounding it did slowly enlarge over the course of observation. Of note, this eye was the only one to exhibit this peculiar phenotype. In other eyes, the atrophy margins were unremarkable prior to degeneration.
Figure 5
Figure 5
Area of hyperfluorescence during fluorescein angiography (FA) quantified over time by group. Mean ± standard error of the mean. Sham-treated animals displayed only minimal changes in FA. For adeno-associated virus–treated eyes, hyperfluorescence peaked at week 2. In low-dose-treated animals, hyperfluorescence had largely resolved spontaneously by week 4. In high-dose-treated animals, hyperfluorescent lesions persisted until week 12 (the end of observation).
Figure 6
Figure 6
Choroidal hypofluorescence area as quantified by indocyanine green angiography (ICGA) over time by group. Mean ± standard error of the mean. Hypofluorescence in ICGA preceded detection of atrophy by fundus autofluorescence (AF). In contrast to AF and fluorescein angiography, ICGA hypofluorescence was also evident in sham animals. However, hypofluorescent appeared somewhat transient as lesion size peaked at week 2 followed by partial recovery. This time-dependency was statistically significant (2-way ANOVA: P = 0.00). Although differences between groups were not significant, there was a trend toward dose-dependent lesion size and persistence in hypofluorescence in adeno-associated virus–treated eyes. ANOVA = analysis of variance

References

    1. Reichel F.F., Seitz I., Wozar F., et al. Development of retinal atrophy after subretinal gene therapy with voretigene neparvovec. Br J Ophthalmol. 2023;107:1331–1335. - PubMed
    1. Giansanti F., Mucciolo D.P., Sodi A., et al. Retinal pigment epithelium atrophy after subretinal voretigene neparvovec-rzyl for RPE65-related disease: a 6-month follow-up. Retina. 2022;42:e55–e56. - PMC - PubMed
    1. Gange W.S., Sisk R.A., Besirli C.G., et al. Perifoveal chorioretinal atrophy after subretinal voretigene neparvovec-rzyl for RPE65-mediated leber congenital amaurosis. Ophthalmol Retina. 2022;6:58–64. - PMC - PubMed
    1. Bucher K., Rodríguez-Bocanegra E., Dauletbekov D., Fischer M.D. Immune responses to retinal gene therapy using adeno-associated viral vectors - implications for treatment success and safety. Prog Retin Eye Res. 2021;83 - PubMed
    1. Kessel L., Christensen U.C., Klemp K. Inflammation after voretigene neparvovec administration in patients with RPE65-related retinal dystrophy. Ophthalmology. 2022;129:1287–1293. - PubMed

LinkOut - more resources