. 2024 May 31:12:1385712.
doi: 10.3389/fcell.2024.1385712. eCollection 2024.

Proteomic analysis and functional validation reveal distinct therapeutic capabilities related to priming of mesenchymal stromal/stem cells with IFN-γ and hypoxia: potential implications for their clinical use

Affiliations

Proteomic analysis and functional validation reveal distinct therapeutic capabilities related to priming of mesenchymal stromal/stem cells with IFN-γ and hypoxia: potential implications for their clinical use

Matteo Calligaris et al. Front Cell Dev Biol. .

Abstract

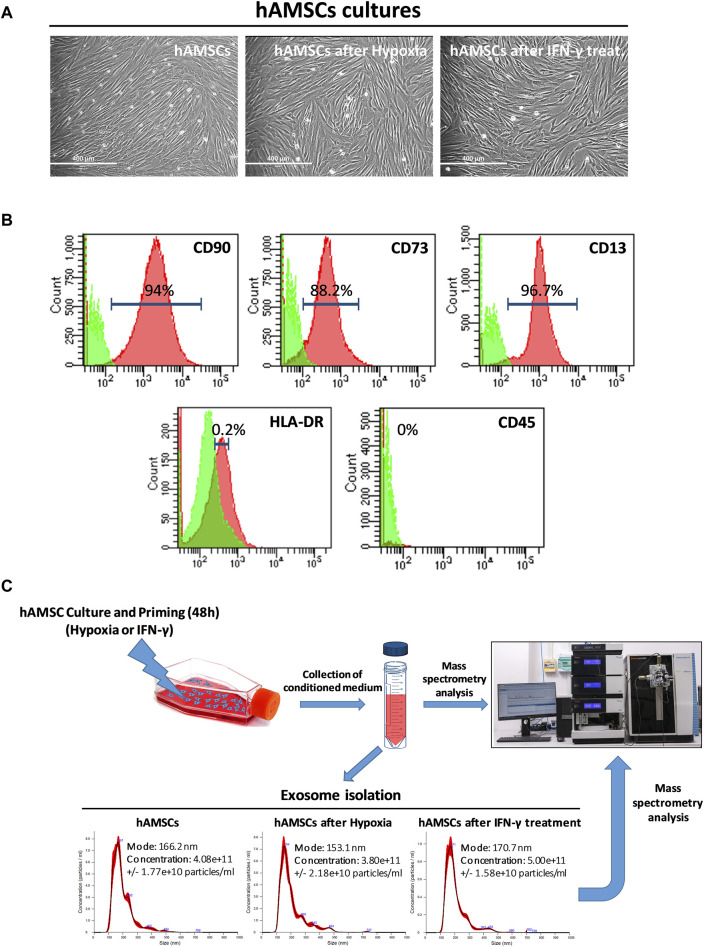
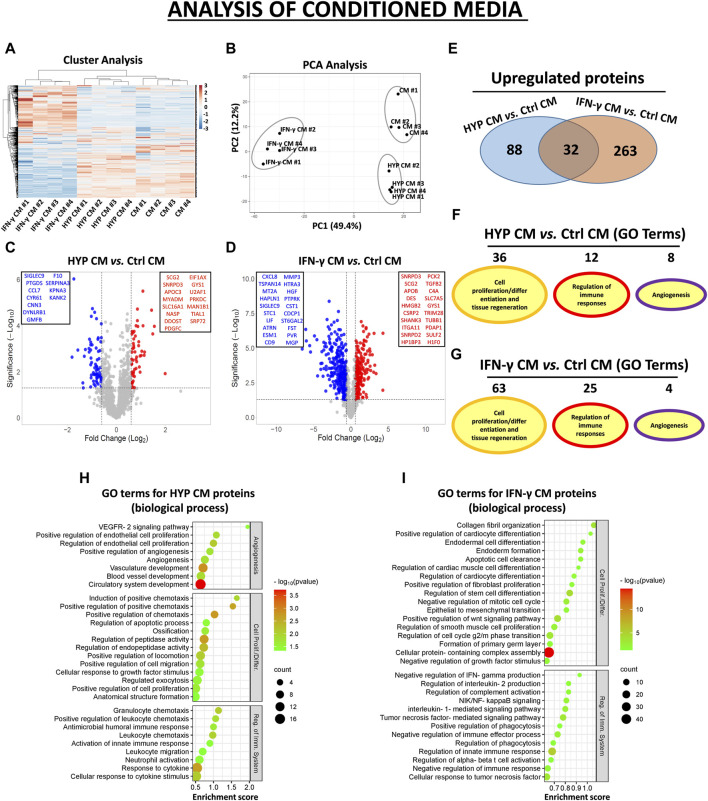
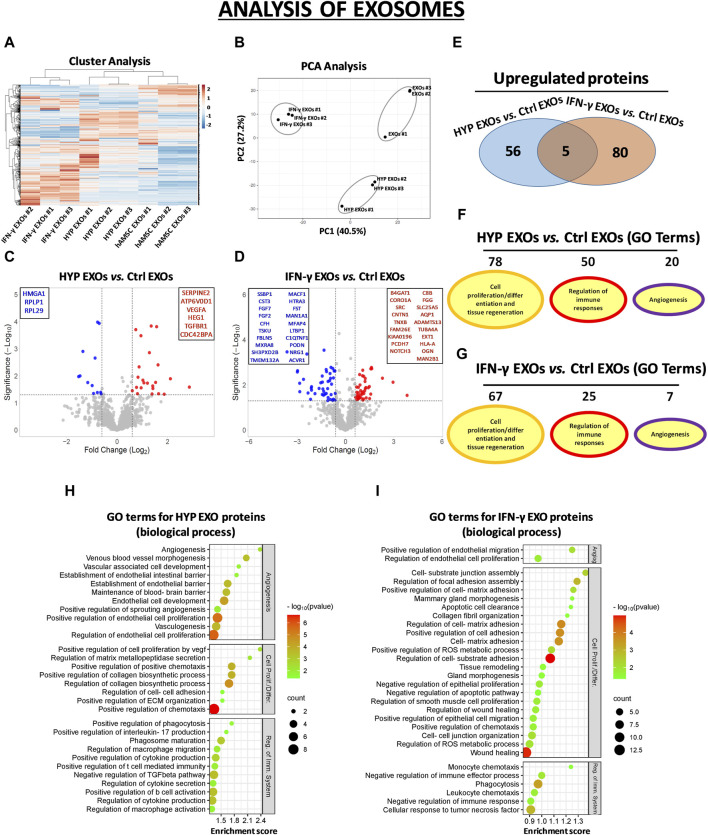
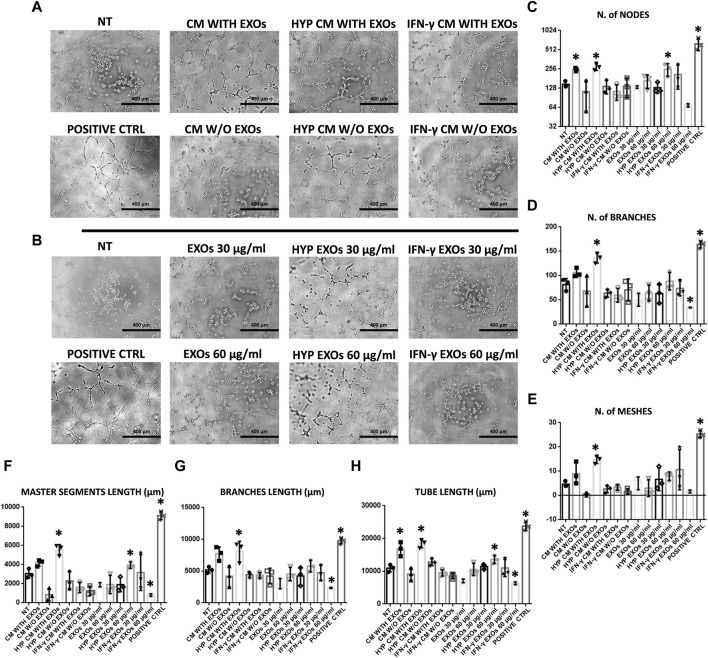
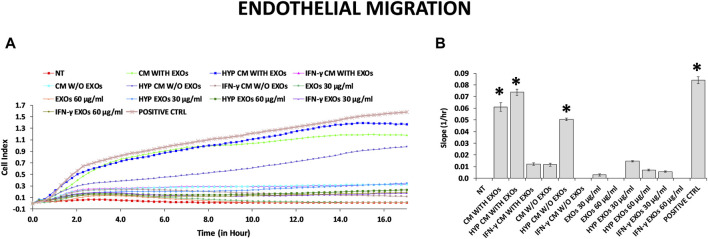
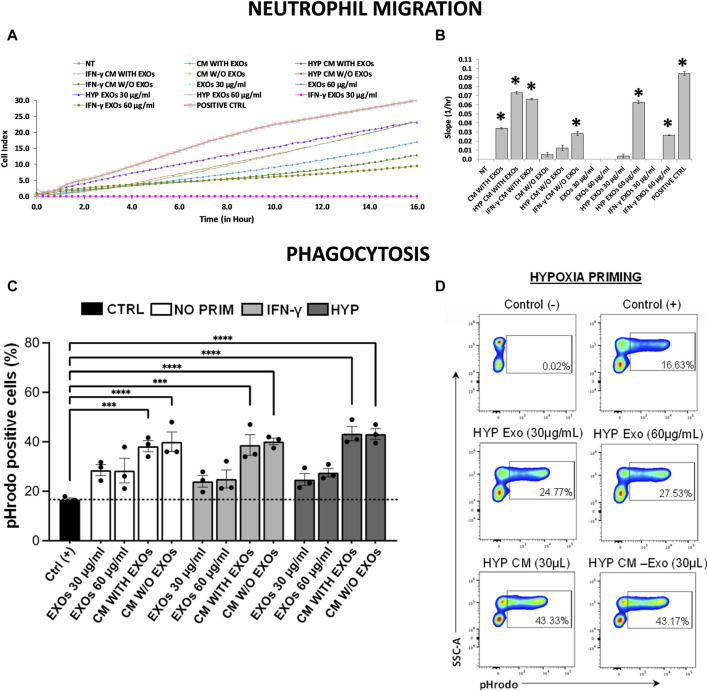
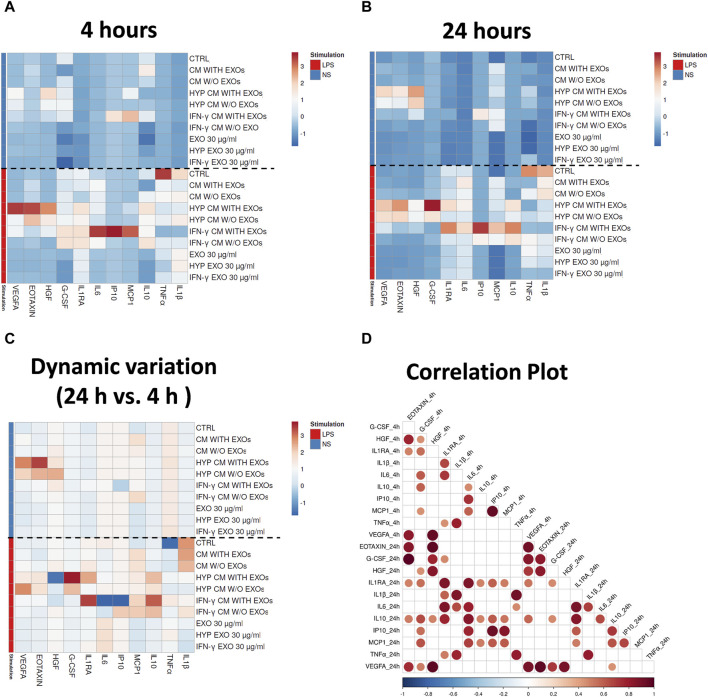
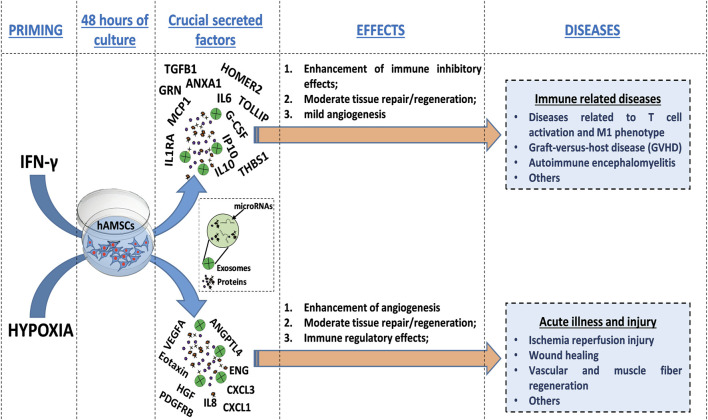
Mesenchymal stromal/stem cells (MSCs) are a heterogeneous population of multipotent cells that can be obtained from various tissues, such as dental pulp, adipose tissue, bone marrow and placenta. MSCs have gained importance in the field of regenerative medicine because of their promising role in cell therapy and their regulatory abilities in tissue repair and regeneration. However, a better characterization of these cells and their products is necessary to further potentiate their clinical application. In this study, we used unbiased high-resolution mass spectrometry-based proteomic analysis to investigate the impact of distinct priming strategies, such as hypoxia and IFN-γ treatment, on the composition and therapeutic functionality of the secretome produced by MSCs derived from the amniotic membrane of the human placenta (hAMSCs). Our investigation revealed that both types of priming improved the therapeutic efficacy of hAMSCs, and these improvements were related to the secretion of functional factors present in the conditioned medium (CM) and exosomes (EXOs), which play crucial roles in mediating the paracrine effects of MSCs. In particular, hypoxia was able to induce a pro-angiogenic, innate immune response-activating, and tissue-regenerative hAMSC phenotype, as highlighted by the elevated production of regulatory factors such as VEGFA, PDGFRB, ANGPTL4, ENG, GRO-γ, IL8, and GRO-α. IFN-γ priming, instead, led to an immunosuppressive profile in hAMSCs, as indicated by increased levels of TGFB1, ANXA1, THBS1, HOMER2, GRN, TOLLIP and MCP-1. Functional assays validated the increased angiogenic properties of hypoxic hAMSCs and the enhanced immunosuppressive activity of IFN-γ-treated hAMSCs. This study extends beyond the direct priming effects on hAMSCs, demonstrating that hypoxia and IFN-γ can influence the functional characteristics of hAMSC-derived secretomes, which, in turn, orchestrate the production of functional factors by peripheral blood cells. This research provides valuable insights into the optimization of MSC-based therapies by systematically assessing and comparing the priming type-specific functional features of hAMSCs. These findings highlight new strategies for enhancing the therapeutic efficacy of MSCs, particularly in the context of multifactorial diseases, paving the way for the use of hAMSC-derived products in clinical practice.

Keywords: IFN-γ priming; MSC paracrine effects; MSC priming; MSC therapeutic properties; hypoxia priming; placenta-derived mesenchymal stromal/stem cells; proteomic analysis.


Conflict of interest statement

The authors declare that the research was conducted in the absence of any commercial or financial relationships that could be construed as a potential conflict of interest.

Figures

FIGURE 1
FIGURE 1
Human amnion-derived mesenchymal stromal/stem cells (hAMSCs) were grown as monolayers with or without priming. (A) Representative DIC images of hAMSCs grown as monolayers without priming (hAMSCs), cultured under hypoxic conditions (hAMSCs after hypoxia), or treated with IFN-γ (hAMSCs after IFN-γ treatment). (B) Representative images of flow cytometry analysis for quantification of hAMSCs at step 2 for both positive (CD90, CD73 and CD13) and negative surface markers (HLA-DR and CD45). Green represents the isotype control, and red represents stained cells. (C) Experimental plan and exosome characterization (size and concentration). DIC, differential interference contrast.
FIGURE 2
FIGURE 2
Protein secretion profiles in conditioned medium (CM) derived from unprimed hAMSCs (ctrl) and primed hAMSCs under hypoxia (HYP) or IFN-γ. (A) Secretion clusters (z-scores) of both up- and downregulated proteins in CM derived from hAMSCs (CM), hypoxic hAMSCs (HYP CM) and IFN-γ-treated hAMSCs (IFN-γ CM). (B) Principal component analysis (PCA). (C) Volcano plot analysis (fold change >1.5 and p < 0.05) of secreted proteins in HYP CM vs. ctrl CM and (D) IFN-γ CM vs. ctrl CM. (E) Venn diagram showing the number of upregulated proteins in HYP CM and IFN-γ CM. (F) Number of GO-enriched terms associated with upregulated HYP CM and (G) IFN-γ CM proteins grouped by category. (H) GO enrichment terms of HYP CM- and (I) IFN-γ CM-upregulated proteins; partial list of the 30 most significantly enriched terms.
FIGURE 3
FIGURE 3
Protein secretion profiles of exosomes (EXOs) derived from unprimed hAMSC ctrl and primed hAMSCs under hypoxia (HYP) or IFN-γ. (A) Secretion clusters (z-scores) of both up- and downregulated proteins in EXOs derived from hAMSCs (hAMSC EXOs), hypoxic hAMSCs (HYP EXOs) and IFN-γ-treated hAMSCs (IFN-γ EXOs). (B) Principal component analysis (PCA). (C) Volcano plot analysis (fold change >1.5 and p < 0.05) of secreted protein in HYP EXOs vs. ctrl EXOs and (D) IFN-γ EXOs vs. ctrl EXOs. (E) Venn diagram showing the number of upregulated proteins in HYP EXOs and IFN-γ EXOs. (F) Number of GO-enriched terms associated with upregulated HYP EXO and (G) IFN-γ EXO proteins grouped by category. (H) GO enrichment terms of HYP EXO- and (I) IFN-γ EXO-upregulated proteins; partial list of the 30 most significantly enriched terms.
FIGURE 4
FIGURE 4
HUVEC capillary-like formation assay. (A) Representative images of HUVECs on BME treated with conditioned medium (CM) or (B) exosomes (EXOs). (C–H)- Graphs represent a quantitative analysis of the (C) number of nodes, (D) number of branches, (E) number of meshes, (F) master segment length, (G) branch length, and (H) tube length. Untreated serum-free DMEM (NT); Untreated DMEM with serum (positive ctrl); Serum-free DMEM conditioned by hAMSCs (CM with EXOs); Serum-free DMEM conditioned by hAMSCs depleted of EXOs (CM w/o EXOs); Serum-free DMEM conditioned by hypoxic hAMSCs (HYP CM with EXOs); Serum-free DMEM conditioned by hypoxic hAMSCs depleted of EXOs (HYP CM w/o EXOs); Serum-free DMEM conditioned by IFN-γ-treated hAMSCs (IFN-γ CM with EXOs); Serum-free DMEM conditioned by IFN-γ-treated hAMSCs depleted of EXOs (IFN-γ CM w/o EXOs); 30 μg/mL EXOs secreted by hAMSCs (EXOs 30 μg/mL); 60 μg/mL EXOs secreted by hAMSCs (EXOs 60 μg/mL); 30 μg/mL EXOs secreted by hypoxic hAMSCs (HYP EXOs 30 μg/mL); 60 μg/mL EXOs secreted by hypoxic hAMSCs (HYP EXOs 60 μg/mL); 30 μg/mL EXOs secreted by IFN-γ-treated hAMSCs (IFN-γ EXOs 30 μg/mL); 60 μg/mL EXOs secreted by IFN-γ-treated hAMSCs (IFN-γ EXOs 60 μg/mL). Data are presented as the means ± SD of triplicate in two independent experiments. ∗p < 0.05 vs. NT.
FIGURE 5
FIGURE 5
HUVEC migration assay. (A) Real-time migration monitoring of HUVECs with the xCELLigence system. (B) Slopes of migration curves. Untreated serum-free DMEM (NT); Untreated DMEM with serum (positive ctrl); Serum-free DMEM conditioned by hAMSCs (CM with EXOs); Serum-free DMEM conditioned by hAMSCs depleted of EXOs (CM w/o EXOs); Serum-free DMEM conditioned by hypoxic hAMSCs (HYP CM with EXOs); Serum-free DMEM conditioned by hypoxic hAMSCs depleted of EXOs (HYP CM w/o EXOs); Serum-free DMEM conditioned by IFN-γ-treated hAMSCs (IFN-γ CM with EXOs); Serum-free DMEM conditioned by IFN-γ-treated hAMSCs depleted of EXOs (IFN-γ CM w/o EXOs); 30 μg/mL EXOs secreted by hAMSCs (EXOs 30 μg/mL); 60 μg/mL EXOs secreted by hAMSCs (EXOs 60 μg/mL); 30 μg/mL EXOs secreted by hypoxic hAMSCs (HYP EXOs 30 μg/mL); 60 μg/mL EXOs secreted by hypoxic hAMSCs (HYP EXOs 60 μg/mL); 30 μg/mL EXOs secreted by IFN-γ-treated hAMSCs (IFN-γ EXOs 30 μg/mL); 60 μg/mL EXOs secreted by IFN-γ-treated hAMSCs (IFN-γ EXOs 60 μg/mL). Data are presented as the means ± SD of quadruplicate in two independent experiments. ∗p < 0.05 vs. NT.
FIGURE 6
FIGURE 6
Neutrophil migration and phagocytosis assays. (A) Real-time migration monitoring of neutrophils with the xCELLigence system. (B) Slopes of migration curves. (C, D) Analysis of phagocytosis in blood samples using pHrodo-labeled particles. (C) The histogram shows the percentages of pHrodo + cells analyzed by flow cytometry after each treatment. (D) Representative plots showing the percentages of pHrodo-labeled cells after treatment of blood samples with both CM and EXOs derived from hypoxic hAMSCs. Untreated serum-free DMEM (NT); Untreated DMEM with serum (positive ctrl); Serum-free DMEM conditioned by hAMSCs (CM with EXOs); Serum-free DMEM conditioned by hAMSCs depleted of EXOs (CM w/o EXOs); Serum-free DMEM conditioned by hypoxic hAMSCs (HYP CM with EXOs); Serum-free DMEM conditioned by hypoxic hAMSCs depleted of EXOs (HYP CM w/o EXOs); Serum-free DMEM conditioned by IFN-γ-treated hAMSCs (IFN-γ CM with EXOs); Serum-free DMEM conditioned by IFN-γ-treated hAMSCs depleted of EXOs (IFN-γ CM w/o EXOs); 30 μg/mL EXOs secreted by hAMSCs (EXOs 30 μg/mL); 60 μg/mL EXOs secreted by hAMSCs (EXOs 60 μg/mL); 30 μg/mL EXOs secreted by hypoxic hAMSCs (HYP EXOs 30 μg/mL); 60 μg/mL EXOs secreted by hypoxic hAMSCs (HYP EXOs 60 μg/mL); 30 μg/mL EXOs secreted by IFN-γ-treated hAMSCs (IFN-γ EXOs 30 μg/mL); 60 μg/mL EXOs secreted by IFN-γ-treated hAMSCs (IFN-γ EXOs 60 μg/mL). Data are presented as the means ± SD of quadruplicate in a and b and triplicate in c and (D)p < 0.05 vs. NT in (B). ∗∗∗p < 0.001 and ∗∗∗∗p < 0.0001 vs. positive control in (C).
FIGURE 7
FIGURE 7
Secretion clusters (z-scores) of both up- and downregulated proteins in peripheral blood. Quantification of soluble factors secreted by peripheral blood cells stimulated or unstimulated with LPS in the presence or absence of each treatment after (A) four and (B) 24 h of culture. (C) Dynamic variations of factors between 4 and 24 h. (D) Correlation matrix of the factors. The degree of correlation between the two factors is shown through color intensity and the diameter of the circles. Significance was analyzed using a Spearman rank test, and the level of significance was set at p < 0.05. Whole blood without treatments (ctrl); Whole blood with serum-free DMEM conditioned by hAMSCs (CM with EXOs); Whole blood with serum-free DMEM conditioned by hAMSCs depleted of EXOs (CM w/o EXOs); Whole blood with serum-free DMEM conditioned by hypoxic hAMSCs (HYP CM with EXOs); Whole blood with serum-free DMEM conditioned by hypoxic hAMSCs depleted of EXOs (HYP CM w/o EXOs); Whole blood with serum-free DMEM conditioned by IFN-γ-treated hAMSCs (IFN-γ CM with EXOs); Whole blood with serum-free DMEM conditioned by IFN-γ-treated hAMSCs depleted of EXOs (IFN-γ CM w/o EXOs); Whole blood with 30 μg/mL EXOs secreted by hAMSCs (EXOs 30 μg/mL); Whole blood with 60 μg/mL EXOs secreted by hAMSCs (EXOs 60 μg/mL); Whole blood with 30 μg/mL EXOs secreted by hypoxic hAMSCs (HYP EXOs 30 μg/mL); Whole blood with 60 μg/mL EXOs secreted by hypoxic hAMSCs (HYP EXOs 60 μg/mL); Whole blood with 30 μg/mL EXOs secreted by IFN-γ-treated hAMSCs (IFN-γ EXOs 30 μg/mL); Whole blood with 60 μg/mL EXOs secreted by IFN-γ-treated hAMSCs (IFN-γ EXOs 60 μg/mL).
FIGURE 8
FIGURE 8
Schematic representation of the molecular effects and therapeutic potential of hAMSCs after priming. HAMSCs were preconditioned through hypoxia or IFN-γ treatment and each priming strategy differentially induced the production of specific factors (soluble factors or EXO-containing factors), which affected the activation of biological processes involved in angiogenesis, tissue repair/regeneration and the modulation of inflammation. Additionally, the priming strategies mentioned above also led to the preconditioning of hAMSCs, which in turn influenced the production of functional factors by peripheral blood cells (as shown in the whole blood assay results). Different priming strategies might be used to direct the therapeutic effects of hAMSCs toward specific diseases.

References

    1. Alberti G., Russo E., Corrao S., Anzalone R., Kruzliak P., Miceli V., et al. (2022). Current perspectives on adult mesenchymal stromal cell-derived extracellular vesicles: biological features and clinical indications. Biomedicines 10 (11), 2822. 10.3390/biomedicines10112822 - DOI - PMC - PubMed
    1. Baharlooi H., Azimi M., Salehi Z., Izad M. (2020). Mesenchymal stem cell-derived exosomes: a promising therapeutic ace card to address autoimmune diseases. Int. J. Stem Cells 13 (1), 13–23. 10.15283/ijsc19108 - DOI - PMC - PubMed
    1. Bulati M., Gallo A., Zito G., Busa R., Iannolo G., Cuscino N., et al. (2023). 3D culture and interferon-gamma priming modulates characteristics of mesenchymal stromal/stem cells by modifying the expression of both intracellular and exosomal microRNAs. Biol. (Basel) 12 (8), 1063. 10.3390/biology12081063 - DOI - PMC - PubMed
    1. Bulati M., Miceli V., Gallo A., Amico G., Carcione C., Pampalone M., et al. (2020). The immunomodulatory properties of the human amnion-derived mesenchymal stromal/stem cells are induced by INF-gamma produced by activated lymphomonocytes and are mediated by cell-to-cell contact and soluble factors. Front. Immunol. 11, 54. 10.3389/fimmu.2020.00054 - DOI - PMC - PubMed
    1. Burja B., Barlic A., Erman A., Mrak-Poljsak K., Tomsic M., Sodin-Semrl S., et al. (2020). Human mesenchymal stromal cells from different tissues exhibit unique responses to different inflammatory stimuli. Curr. Res. Transl. Med. 68 (4), 217–224. 10.1016/j.retram.2020.05.006 - DOI - PubMed