Identification and Construction of a Disulfidptosis-Mediated Diagnostic Model and Associated Immune Microenvironment of Osteoarthritis from the Perspective of PPPM
- PMID: 38882183
- PMCID: PMC11179642
- DOI: 10.2147/JIR.S462179
Identification and Construction of a Disulfidptosis-Mediated Diagnostic Model and Associated Immune Microenvironment of Osteoarthritis from the Perspective of PPPM
Abstract
Background: Osteoarthritis (OA) is a major cause of human disability. Despite receiving treatment, patients with the middle and late stage of OA have poor survival outcomes. Therefore, within the framework of predictive, preventive, and personalized medicine (PPPM/3PM), early personalized diagnosis of OA is particularly prominent. PPPM aims to accurately identify disease by integrating multiple omic techniques; however, the efficiency of currently available methods and biomarkers in predicting and diagnosing OA should be improved. Disulfidptosis, a novel programmed cell death mechanism and appeared in particular metabolic status, plays a mysterious characteristic in the occurrence and development of OA, which warrants further investigation.
Methods: In this study, we integrated three public datasets from the Gene Expression Omnibus (GEO) database, including 26 OA samples and 20 normal samples. Via a series of bioinformatic analysis and machine learning, we identified the diagnostic biomarkers and several subtypes of OA. Moreover, the expression of these biomarkers were verified in our in-house cohort and the single cell dataset.
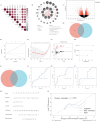
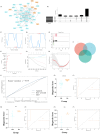
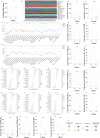
Results: Three significant regulators of disulfidptosis (NCKAP1, OXSM, and SLC3A2) were identified through differential expression analysis and machine learning. And a nomogram constructed based on these three regulators exhibited ideal efficiency in predicting early- and late-stage OA. Furthermore, based on the expression of three regulators, we identified two disulfidptosis-related subtypes of OA with different infiltration of immune cells and personalized expression level of immune checkpoints. Notably, the expression of the three regulators was demonstrated in a single-cell RNA profile and verified in the synovial tissue in our in-house cohort including 6 OA patients and 6 normal people. Finally, an efficient disulfidptosis-mediated diagnostic model was constructed for OA, with the AUC value of 97.6923% in the training set and 93.3333% and 100% in two validation sets.
Conclusion: Overall, with regard to PPPM, this study provided novel insights into the role of disulfidptosis regulators in the personalized diagnosis and treatment of OA.
Keywords: diagnostic model; disulfidptosis; immune microenvironment; osteoarthritis; perspective of predictive, preventive and personalized medicine.
© 2024 Hu et al.
Conflict of interest statement
The authors have no relevant financial or non-financial interests to disclose.
Figures


Similar articles
-
Identification of a novel disulfidptosis-related gene signature in osteoarthritis using bioinformatics analysis and experimental validation.Sci Rep. 2025 Jan 8;15(1):1339. doi: 10.1038/s41598-025-85569-z. Sci Rep. 2025. PMID: 39779817 Free PMC article.
-
Unraveling pathogenesis, biomarkers and potential therapeutic agents for endometriosis associated with disulfidptosis based on bioinformatics analysis, machine learning and experiment validation.J Biol Eng. 2024 Jul 26;18(1):42. doi: 10.1186/s13036-024-00437-0. J Biol Eng. 2024. PMID: 39061076 Free PMC article.
-
Identifying oxidative stress-related biomarkers in idiopathic pulmonary fibrosis in the context of predictive, preventive, and personalized medicine using integrative omics approaches and machine-learning strategies.EPMA J. 2023 Jul 31;14(3):417-442. doi: 10.1007/s13167-023-00334-4. eCollection 2023 Sep. EPMA J. 2023. PMID: 37605652 Free PMC article.
-
Bioinformatics Identification and Experimental Verification of Disulfidptosis-Related Genes in the Progression of Osteoarthritis.Biomedicines. 2024 Aug 13;12(8):1840. doi: 10.3390/biomedicines12081840. Biomedicines. 2024. PMID: 39200304 Free PMC article.
-
Advances in the study of disulfidptosis in digestive tract tumors.Discov Oncol. 2025 Feb 15;16(1):186. doi: 10.1007/s12672-025-01875-y. Discov Oncol. 2025. PMID: 39954025 Free PMC article. Review.
Cited by
-
Identification of Key Glycolysis-Related Genes in Osteoarthritis and Their Correlation with Immune Infiltration Using Bioinformatics Analysis and Machine Learning.Open Access Rheumatol. 2025 Aug 16;17:157-171. doi: 10.2147/OARRR.S541568. eCollection 2025. Open Access Rheumatol. 2025. PMID: 40842856 Free PMC article.
-
Identification of the putative regulatory regions and candidate genes associated with backfat thickness and intramuscular fat content traits in Xiang pigs.BMC Genomics. 2025 Aug 7;26(1):733. doi: 10.1186/s12864-025-11860-y. BMC Genomics. 2025. PMID: 40775679 Free PMC article.
-
Identification biomarkers and therapeutic targets of disulfidptosis-related in rheumatoid arthritis via bioinformatics, molecular dynamics simulation, and experimental validation.Sci Rep. 2025 Mar 13;15(1):8779. doi: 10.1038/s41598-025-93656-4. Sci Rep. 2025. PMID: 40082645 Free PMC article.
-
Identification and experimental validation of key genes in osteoarthritis based on machine learning algorithms and single-cell sequencing analysis.Heliyon. 2024 Aug 28;10(17):e37047. doi: 10.1016/j.heliyon.2024.e37047. eCollection 2024 Sep 15. Heliyon. 2024. PMID: 39286216 Free PMC article.
-
Calcium Signaling and Molecular Adhesion Processes May Hold the Key to Genetic Risk for Autism: A Molecular Pathway Analysis on Two Independent Samples.Genes (Basel). 2024 Dec 17;15(12):1609. doi: 10.3390/genes15121609. Genes (Basel). 2024. PMID: 39766876 Free PMC article.
References
-
- Bernabei I, So A, Busso N, Nasi S. Cartilage calcification in osteoarthritis: mechanisms and clinical relevance. Nat Rev Rheumatol. 2023;19:10–27. - PubMed
-
- Mahmoudian A, Lohmander LS, Mobasheri A, Englund M, Luyten FP. Early-stage symptomatic osteoarthritis of the knee - time for action. Nat Rev Rheumatol. 2021;17:621–632. - PubMed
LinkOut - more resources
Full Text Sources

