. 2019 May;43(3):263-270.
doi: 10.1177/0165025418820708. Epub 2019 Jan 23.

Continuous measurement of dynamic classroom social interactions

Affiliations

Continuous measurement of dynamic classroom social interactions

Daniel S Messinger et al. Int J Behav Dev. 2019 May.

Abstract

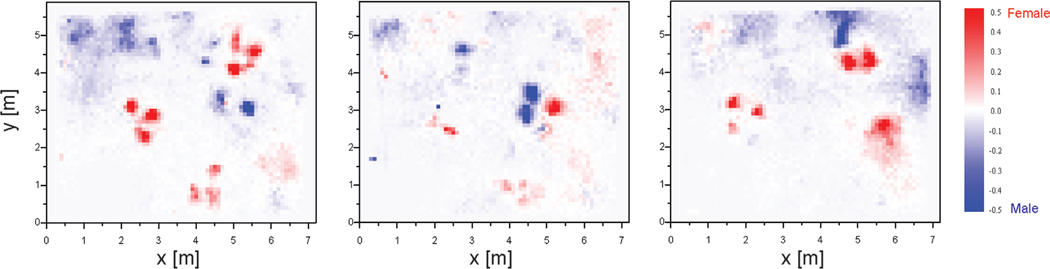
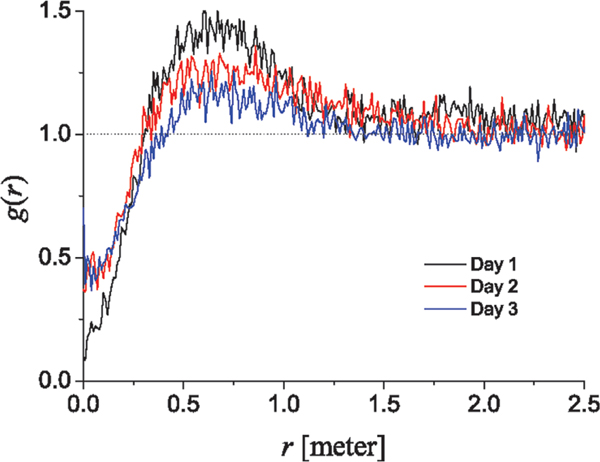
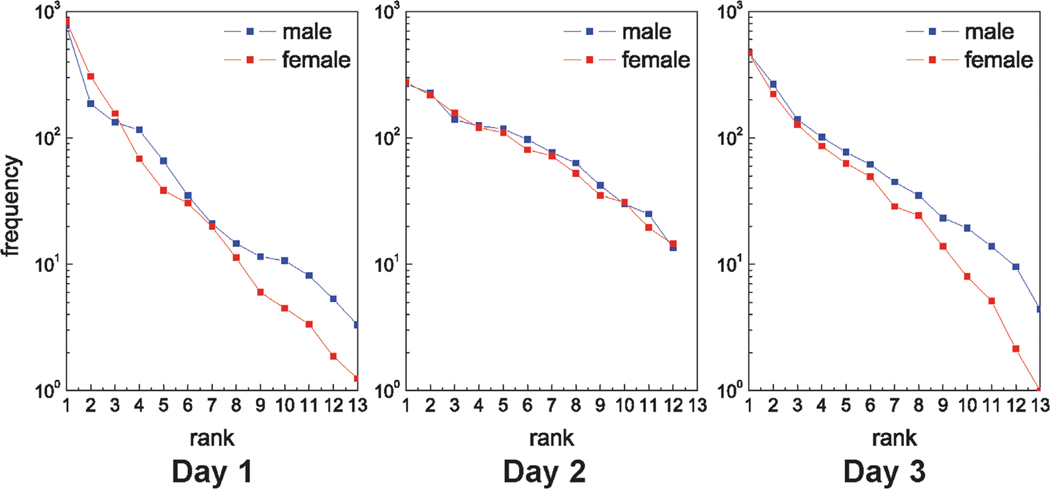
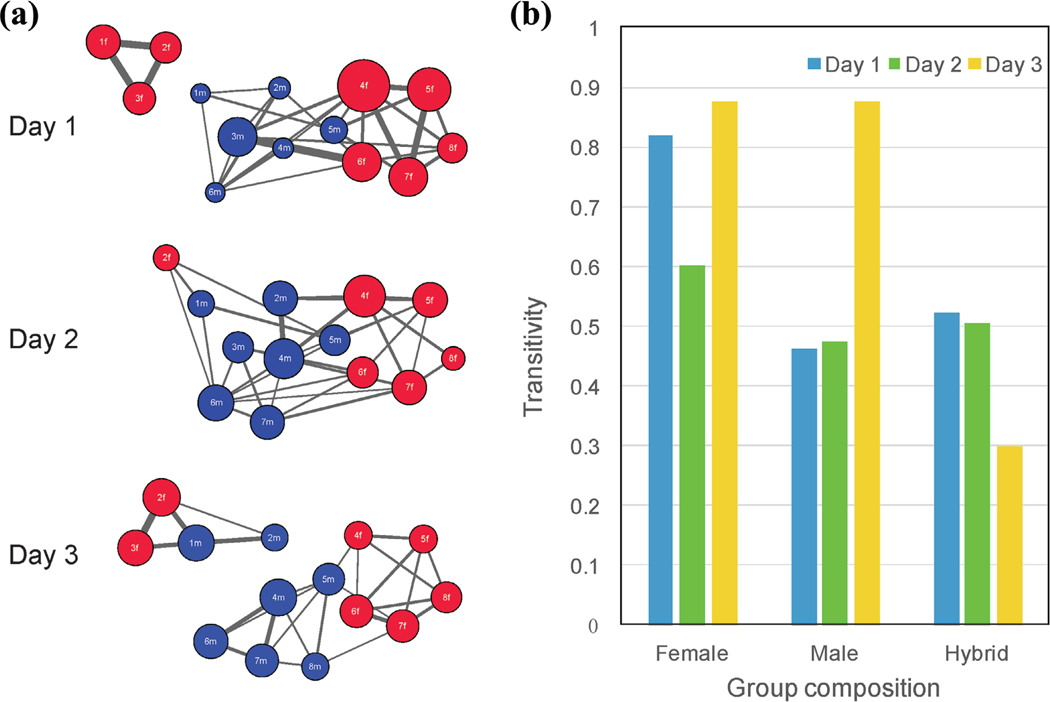
Human observations can only capture a portion of ongoing classroom social activity, and are not ideal for understanding how children's interactions are spatially structured. Here we demonstrate how social interaction can be investigated by modeling automated continuous measurements of children's location and movement using a commercial system based on radio frequency identification. Continuous location data were obtained from 16 five-year-olds observed during three 1-h classroom free play observations. Illustrative coordinate mapping indicated that boys and girls tended to cluster in different physical locations in the classroom, but there was no suggestion of gender differences in children's velocity (i.e., speed of movement). To detect social interaction, we present the radial distribution function, an index of when children were in social contact at greater than chance levels. Rank-order plots indicated that children were in social contact tens to hundreds of times more with some peers than others. We illustrate the use of social ties (higher than average levels of social contact) to visualize the classroom network. Analysis of the network suggests that transitivity is a potential lens through which to examine male, female, and mixed-sex cliques. The illustrative findings suggest the validity of the new measurement approach by re-examining well-established gender segregation findings from a new perspective.

Keywords: Interaction; automated; dynamics; objective; preschool; sex differences; social.


Figures

Figure 1.
Figure 1.. Spatial probability distributions by gender.
The difference between female and male spatial distributions throughout the classroom is displayed. Darker red indicates a high density of females to males; darker blue indicates a higher density of males to females. The spatial probability distributions of males and females are largely distinct (see also Figure S2). Axes are in meters.
Figure 2.
Figure 2.. The radial distribution function.
The radial distribution function, g(r), is the ratio of the observed distance between children divided by the distance expected by chance. Chance is based the expected distance between children based on their individual location distribution. When g(r)>1, children are clustered more closely than expected by chance. The distribution of g(r) was relatively stable over the three observations. Social contact was defined as children being within a radius, r, of 1 m, encompassing the peaks of g(r).
Figure 3.
Figure 3.. Contact frequency.
Semi-log plots of the mean frequency of children’s social contacts by ordinal rank. Rank 1 indicates the most contacted peer, Rank 2 the second-most, through the least-most contacted peer. On Day 1 and Day 3, 14 children were in attendance and each child had 13 peers. On Day 2, 13 children were in attendance and each child had 12 peers. Mean contact frequency by rank is displayed for males and females. Both males and females consistently show levels of social contact with their most contacted peers that are ten to hundreds of time higher than levels of contact with their least contacted peers.
Figure 4.
Figure 4.. Social networks and transitivity.
(a) Red nodes (circles) represent female children and blue nodes represent male children. Node diameter is proportional to the duration of contact with all other children. Edges (lines between circles) connect children when the contact frequency between those two children was greater than the mean contact frequency of all pairs of children on a given day. The width of edges connecting circles is proportional to the duration of contact between the two connected children. Males and females appear to form male-only, female-only, and mixed groups. (b) Transitivity occurs when children who share a social contact are themselves in social contact. To quantify transitivity, each day’s network is considered as a set of triplets of three children. A triplet is composed of three nodes with two or three edges connecting the nodes. The proportion of three-edged triplets indexes transitivity. Transitivity is shown for all-female, all-male, and hybrid (mixed) triplets for each day of observation.

References

    1. Chen J, Lin TJ, Justice L, & Sawyer B. (2017). The social networks of children with and without disabilities in early childhood special education classrooms. Journal of Autism and Developmental Disorders. doi:10.1007/s10803-017-3272-4 - DOI - PubMed
    1. Daniel JR, Santos AJ, Peceguina I, & Vaughn BE (2013). Exponential random graph models of preschool affiliative networks. Social Networks, 35, 25–30.
    1. Fowler JH, & Christakis NA (2010). Cooperative behavior cascades in human social networks. Proceedings of the National Academy of Sciences, 107, 5334–5338. - PMC - PubMed
    1. Hartup WW, Laursen B, Stewart MI, & Eastenson A. (1988). Conflict and the friendship relations of young children. Child Development, 59, 1590–1600. - PubMed
    1. Holland PW, & Leinhardt S. (1970). A method for detecting structure in sociometric data. American Journal of Sociology, 76, 492–513.