

Beyond network centrality: individual-level behavioral traits for predicting information superspreaders in social media
- PMID: 38883306
- PMCID: PMC11173202
- DOI: 10.1093/nsr/nwae073
Beyond network centrality: individual-level behavioral traits for predicting information superspreaders in social media
Abstract
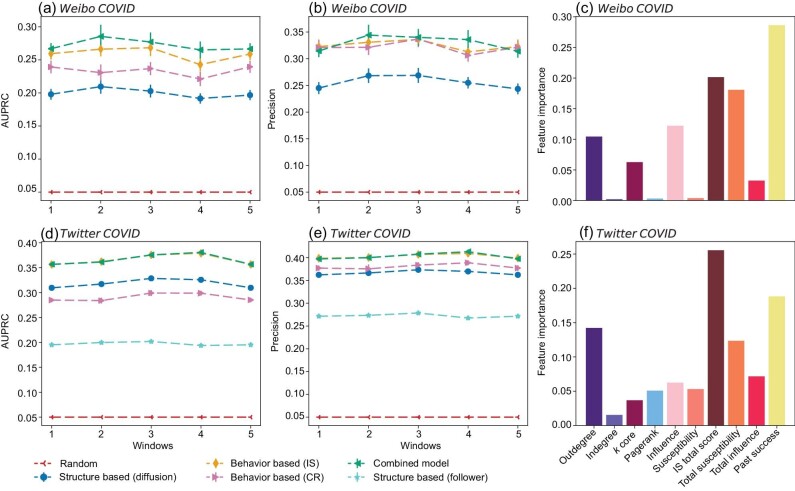
Understanding the heterogeneous role of individuals in large-scale information spreading is essential to manage online behavior as well as its potential offline consequences. To this end, most existing studies from diverse research domains focus on the disproportionate role played by highly connected 'hub' individuals. However, we demonstrate here that information superspreaders in online social media are best understood and predicted by simultaneously considering two individual-level behavioral traits: influence and susceptibility. Specifically, we derive a nonlinear network-based algorithm to quantify individuals' influence and susceptibility from multiple spreading event data. By applying the algorithm to large-scale data from Twitter and Weibo, we demonstrate that individuals' estimated influence and susceptibility scores enable predictions of future superspreaders above and beyond network centrality, and reveal new insights into the network positions of the superspreaders.
Keywords: complex networks; information spreading; social media; social networks; superspreaders.
© The Author(s) 2024. Published by Oxford University Press on behalf of China Science Publishing & Media Ltd.
Figures


Similar articles
-
Local-Forest Method for Superspreaders Identification in Online Social Networks.Entropy (Basel). 2022 Sep 11;24(9):1279. doi: 10.3390/e24091279. Entropy (Basel). 2022. PMID: 36141165 Free PMC article.
-
Identifying and characterizing superspreaders of low-credibility content on Twitter.PLoS One. 2024 May 22;19(5):e0302201. doi: 10.1371/journal.pone.0302201. eCollection 2024. PLoS One. 2024. PMID: 38776260 Free PMC article.
-
Searching for superspreaders of information in real-world social media.Sci Rep. 2014 Jul 3;4:5547. doi: 10.1038/srep05547. Sci Rep. 2014. PMID: 24989148 Free PMC article.
-
Linking Network Characteristics of Online Social Networks to Individual Health: A Systematic Review of Literature.Health Commun. 2021 Nov;36(12):1549-1559. doi: 10.1080/10410236.2020.1773703. Epub 2020 Jun 17. Health Commun. 2021. PMID: 33950763
-
Using social media to create a professional network between physician-trainees and the American Society of Nephrology.Adv Chronic Kidney Dis. 2013 Jul;20(4):357-63. doi: 10.1053/j.ackd.2013.03.005. Adv Chronic Kidney Dis. 2013. PMID: 23809288 Review.
Cited by
-
Using an epidemiological model to explore the interplay between sharing and advertising in viral videos.Sci Rep. 2024 May 18;14(1):11351. doi: 10.1038/s41598-024-61814-9. Sci Rep. 2024. PMID: 38762591 Free PMC article.
References
-
- Lacassin R, Devès M, Hicks SP et al. Rapid collaborative knowledge building via twitter after significant geohazard events. Geosci Lett 2020; 3: 129–46.10.5194/gc-3-129-2020 - DOI
-
- Chen Y, Harper FM, Konstan J et al. Social comparisons and contributions to online communities: a field experiment on movielens. Am Econ Rev 2010; 100: 1358–98.10.1257/aer.100.4.1358 - DOI
-
- Centola D. How Behavior Spreads. Princeton: Princeton University Press, 2018.
LinkOut - more resources
Full Text Sources