. 2024 Apr 16;11(6):uhae109.
doi: 10.1093/hr/uhae109. eCollection 2024 Jun.

Comparative population genomics reveals convergent and divergent selection in the apricot-peach-plum-mei complex

Affiliations

Comparative population genomics reveals convergent and divergent selection in the apricot-peach-plum-mei complex

Xuanwen Yang et al. Hortic Res. .

Abstract

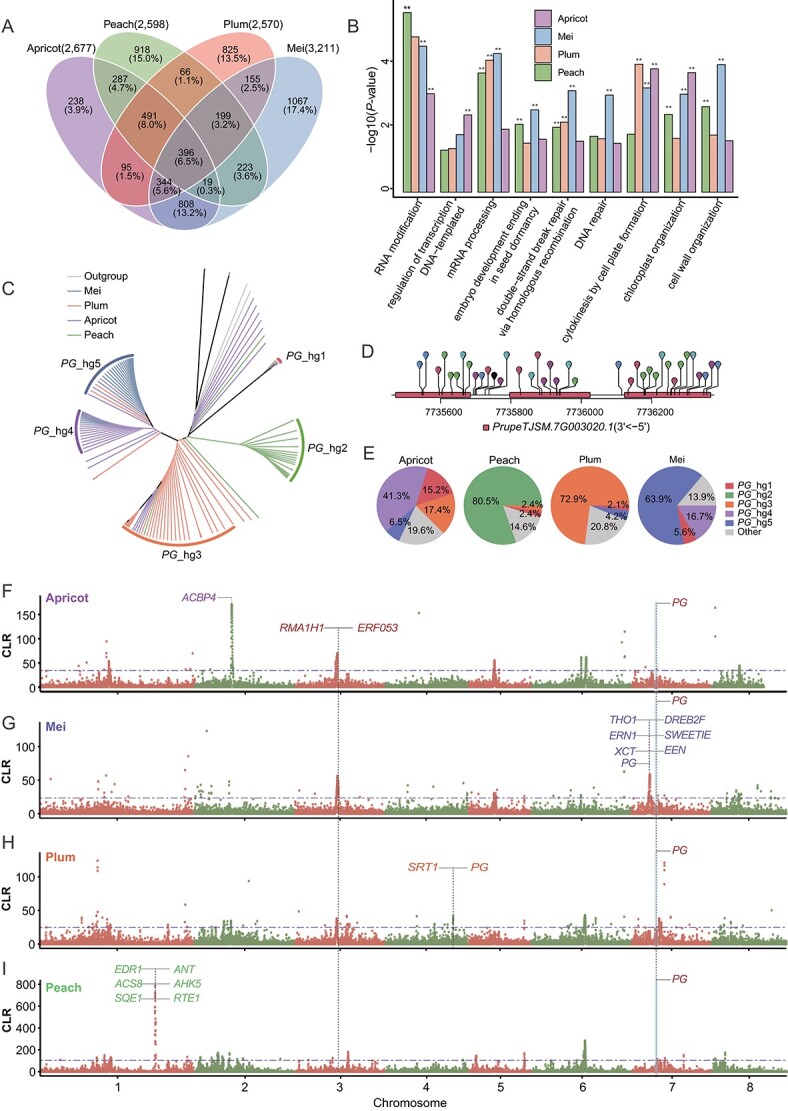
The economically significant genus Prunus includes fruit and nut crops that have been domesticated for shared and specific agronomic traits; however, the genomic signals of convergent and divergent selection have not been elucidated. In this study, we aimed to detect genomic signatures of convergent and divergent selection by conducting comparative population genomic analyses of the apricot-peach-plum-mei (APPM) complex, utilizing a haplotype-resolved telomere-to-telomere (T2T) genome assembly and population resequencing data. The haplotype-resolved T2T reference genome for the plum cultivar was assembled through HiFi and Hi-C reads, resulting in two haplotypes 251.25 and 251.29 Mb in size, respectively. Comparative genomics reveals a chromosomal translocation of ~1.17 Mb in the apricot genomes compared with peach, plum, and mei. Notably, the translocation involves the D locus, significantly impacting titratable acidity (TA), pH, and sugar content. Population genetic analysis detected substantial gene flow between plum and apricot, with introgression regions enriched in post-embryonic development and pollen germination processes. Comparative population genetic analyses revealed convergent selection for stress tolerance, flower development, and fruit ripening, along with divergent selection shaping specific crop, such as somatic embryogenesis in plum, pollen germination in mei, and hormone regulation in peach. Notably, selective sweeps on chromosome 7 coincide with a chromosomal collinearity from the comparative genomics, impacting key fruit-softening genes such as PG, regulated by ERF and RMA1H1. Overall, this study provides insights into the genetic diversity, evolutionary history, and domestication of the APPM complex, offering valuable implications for genetic studies and breeding programs of Prunus crops.


Conflict of interest statement

The authors declare that they have no competing interests.

Figures

Figure 1
Figure 1
Overview of the PS_T2T reference genome. AC The pictures used in this study show the tree, fruits, and flowers of the ‘Fengtangli’ plum. D Overview of genome assembly. Collinearity between ‘Sanyueli’ and two haplotypes of PS_T2T. Gray lines represent collinearity blocks with length 15 000 bp, while orange lines represent potential inversions. Centromeres and telomeres are indicated by black boxes and black dots, respectively. E Hi-C interaction matrix based on the PS_T2T diploid assembly.
Figure 2
Figure 2
Comparative genomic analysis of APPM genomes. A Synteny analysis at the gene level among four Prunus species. Light gray represents syntenic blocks. Dark gray and red lines denote collinearity, with red arrows indicating a translocation. B Collinearity comparison of four genomes demonstrates apricot translocation spanning 1.17 Mb (Chr7: 5.10–6.27 Mb) shared with three other species. Green syntenic blocks indicate D loci associated with agronomic traits. C Top enriched biological processes for genes in the 1.17-Mb translocation region. D Venn diagram comparing shared and private gene families of four Prunus species.
Figure 3
Figure 3
Population structure and heterozygosity of the APPM complex. A Phylogenetic tree of all accessions based on whole-genome SNPs. Different clades are represented by colored branches: 41 peach, 46 apricot, 36 mei, and 48 plum accessions. The estimated admixture proportions ranged from K = 3 to K = 5. B, C PCA of 171 samples in Prunus. D Heterozygosity in each species of the APPM complex.
Figure 4
Figure 4
Genetic differentiation and extensive introgression among the four species in the APPM complex. A The heat map indicates the pairwise differentiation (FST) statistics between the populations. Values within blue circles denote nucleotide diversity (π) for each population. B Heat map representation of fb statistics across different populations. Gray boxes correspond to pairs that could not be tested due to topological constraints occurring in the system. C Distribution of window counts based on the fdM values for a 20-kb window. Green and pink colors represent the numbers of windows >0 and <0, respectively. D Inferred graphical representation highlighting migration events, based on genome-wide allele frequencies among the four clades. The yellow arrow indicates the direction of introgression. E Example of regions that are inferred to have introgressed from the apricot into plum. FST, π, and fd values were evaluated in a 20-kb window. The prominently displayed red vertical line demarcates the region (Chr2: 16.92–16.94 Mb) believed to be under selection.
Figure 5
Figure 5
Convergent and divergent selection signals in the APPM complex. A Venn diagram of genes calculated to be in the top 1% CLR regions detected by SweeD in apricot, mei, plum, and peach. B Shared GO terms enriched in the top 1% CLR regions detected by SweeD. GO terms with a P-value <0.01 (Fisher’s exact test) are indicated with two asterisks. C Phylogenetic tree of functional haplotype sequences in highlighted genes shared across four clades: chromosome 7 (PG). D Visualization of variant positions above the PG gene model: the black line represents the genome and rectangles represent exons. E Population frequencies of PG haplotype clades in the APPM complex. FI The dashed lines mark the regions in the top 1%. The red italicized text indicates functional genes common to all four clades, while purple, blue, orange, and green represent functional genes unique to apricot, mei, plum, and peach, respectively.

References

    1. Edelman NB, Mallet J. Prevalence and adaptive impact of introgression. Annu Rev Genet. 2021;55:265–83 - PubMed
    1. Anderson E, Hubricht L. The evidence for introgressive hybridization. Am J Bot. 1938;25:396–402
    1. Suarez-Gonzalez A, Lexer C, Cronk QCB. Adaptive introgression: a plant perspective. Biol Lett. 2018;14:20170688. - PMC - PubMed
    1. Suarez-Gonzalez A, Hefer CA, Lexer C. et al. Introgression from Populus balsamifera underlies adaptively significant variation and range boundaries in P. trichocarpa. New Phytol. 2018;217:416–27 - PubMed
    1. He F, Pasam R, Shi F. et al. Exome sequencing highlights the role of wild-relative introgression in shaping the adaptive landscape of the wheat genome. Nat Genet. 2019;51:896–904 - PubMed