. 2024 May 31:15:1402880.
doi: 10.3389/fendo.2024.1402880. eCollection 2024.

Extracellular electrophysiology on clonal human β-cell spheroids

Affiliations

Extracellular electrophysiology on clonal human β-cell spheroids

Emilie Puginier et al. Front Endocrinol (Lausanne). .

Abstract

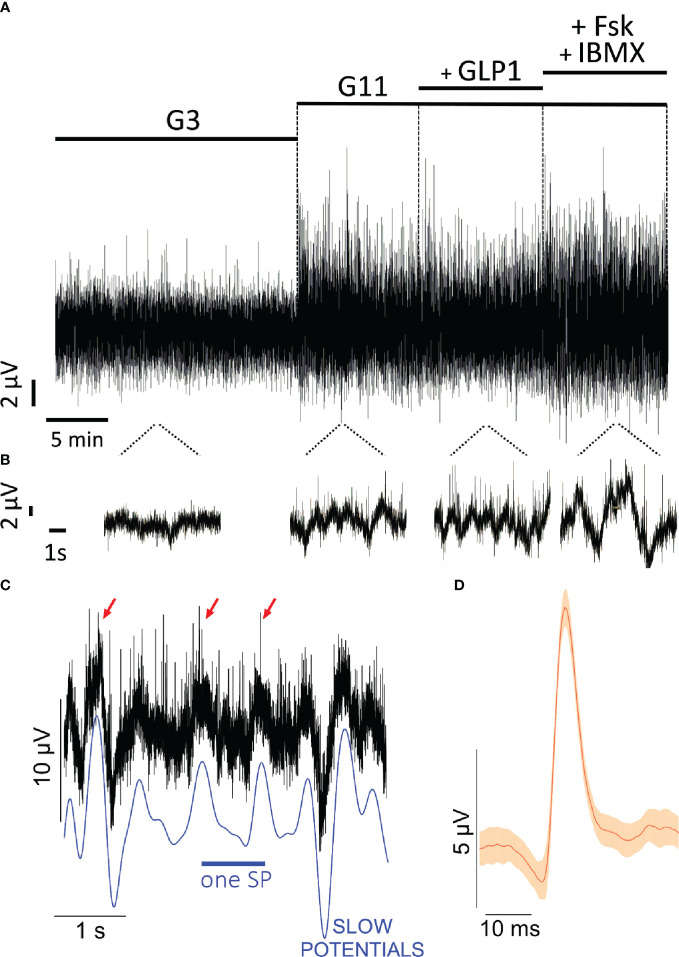
Background: Pancreatic islets are important in nutrient homeostasis and improved cellular models of clonal origin may very useful especially in view of relatively scarce primary material. Close 3D contact and coupling between β-cells are a hallmark of physiological function improving signal/noise ratios. Extracellular electrophysiology using micro-electrode arrays (MEA) is technically far more accessible than single cell patch clamp, enables dynamic monitoring of electrical activity in 3D organoids and recorded multicellular slow potentials (SP) provide unbiased insight in cell-cell coupling.

Objective: We have therefore asked whether 3D spheroids enhance clonal β-cell function such as electrical activity and hormone secretion using human EndoC-βH1, EndoC-βH5 and rodent INS-1 832/13 cells.

Methods: Spheroids were formed either by hanging drop or proprietary devices. Extracellular electrophysiology was conducted using multi-electrode arrays with appropriate signal extraction and hormone secretion measured by ELISA.

Results: EndoC-βH1 spheroids exhibited increased signals in terms of SP frequency and especially amplitude as compared to monolayers and even single cell action potentials (AP) were quantifiable. Enhanced electrical signature in spheroids was accompanied by an increase in the glucose stimulated insulin secretion index. EndoC-βH5 monolayers and spheroids gave electrophysiological profiles similar to EndoC-βH1, except for a higher electrical activity at 3 mM glucose, and exhibited moreover a biphasic profile. Again, physiological concentrations of GLP-1 increased AP frequency. Spheroids also exhibited a higher secretion index. INS-1 cells did not form stable spheroids, but overexpression of connexin 36, required for cell-cell coupling, increased glucose responsiveness, dampened basal activity and consequently augmented the stimulation index.

Conclusion: In conclusion, spheroid formation enhances physiological function of the human clonal β-cell lines and these models may provide surrogates for primary islets in extracellular electrophysiology.

Keywords: EndoC-βH1; EndoC-βH5; INS-1 cells; extracellular electrophysiology; insulin; islets; microelectrode array; spheroids.


Conflict of interest statement

The authors declare that the research was conducted in the absence of any commercial or financial relationships that could be construed as a potential conflict of interest.

Figures

Figure 1
Figure 1
Generation of Spheroids. (A) Generation of EndoC-βH1 3D spheroids. i, image of spheroid formed and staining for insulin (red) and with DAPI (blue); ii, time course of spheroid formation and size at different cell numbers; iii, EndoC-βH1 3D spheroids on a micro-electrode array. (B) formation of islet spheroids. i petri with hanging drops; ii, 3D islets formed; iii, staining for insulin, glucagon and with DAPI.
Figure 2
Figure 2
Extracellular electrophysiology of EndoC-βH cells on microelectrode arrays. (A) Original recordings at 3m M glucose (G3), 11 mM glucose (G11), 11 mM glucose with 50 pM GLP-1 (+ GLP1) or with 1 µM forskolin and 0.1 mM IBMX (+FSK + IBMX). Given is the example from one electrode. (B) snippets of recording in B on extended timescale. (C) example of slow potentials (SP) and action potentials (AP) from recordings shown in (A). The blue line given below the recordings indicates the slow potentials, some action potentials are marked by red arrows. (D) mean form of action potentials (red) and 99% confidence intervals (orange) from all action potentials in the recording shown in B (n= 44; mean amplitude 8.7 µV, mean duration 35 ms).
Figure 3
Figure 3
Functional characterization of spheroids from EndoC-βH1 cells or primary mouse islets. (A) Recording of monolayer (2D) or spheroids (3D) of EndoC-βH1 cells seeded on micro-electrode arrays and exposed to Glucose (3 mM, G3; 11 mM, G11), GLP-1 (50 pM) in the presence of 11 mM glucose (GLP1) or IBMX (100 µM) and forskolin (1 µM) in the presence of 11 mM glucose (I/F). Mean traces of slow potential (SP) frequency and amplitudes as well as action potential (AP) frequency are given; mean, black, SEM grey. Time bars equal 20 min (in all traces). (B) Statistical evaluations of the curves of A (mean values). (C) Recording of monolayer (2D) or reassembled spheroids (3D) of primary mouse seeded on micro-electrode arrays. Abbreviations for conditions and statistical tests as in (A). (D) Statistical evaluations of curves of C (mean values). (E) Insulin secretion (static incubations) of monolayer (2D) or spheroids (3D) of EndoC-βH1 cells during 1h incubation, abbreviations as in (A) ANOVA and Tukey posthoc test; *, 2p<0.05; ** 2p<0.01, *** 2p<0.001, ****2p<0.0001; 2D vs 3D, +++ 2p<0.001. n, given in corresponding panels.
Figure 4
Figure 4
Functional characterization of monolayers and spheroids from EndoC-βH5 cells. Recording of monolayer (2D) or spheroids (3D) of EndoC-βH5 cells seeded on micro-electrode arrays and exposed to Glucose (3 mM, G3; 11 mM, G11) or GLP-1 (50 pM) in the presence of 11 mM glucose (G11 GLP1). (A) Mean traces of slow potential (SP) frequency as well as action potential (AP) frequency bare given; mean, black, SEM grey. Time bars equal 10 min (in all traces). (B) Statistical evaluations of mean frequencies of data given in (A). (C) Mean traces of slow potential (SP) amplitudes; mean, black, SEM grey. (D) Statistical evaluations of data given in (C). (E) Insulin secretion (static incubations) of monolayer (2D) or spheroids (3D) of EndoC-βH5 cells during 1h incubation, abbreviations as in (A) Open and filled red circles, IBMX (0.1 mM)/forskolin (1 µM) or GLP-1 (50 pM) in the presence of indicated concentrations of glucose.; ANOVA and Tukey posthoc test; (B, D, E) *, 2p<0.05; **, 2p <0.01; ***, 2p <0.001, ****, 2p <0.0001; Comparison 2D and 3D: #, 2p<0.05, ##, 2p<0.01; insulin secretion (E), ++, 2p <0.01 as compared to the absence of GLP-1 or IBMX/forskolin; n, given in corresponding panels.
Figure 5
Figure 5
CX36 expression in transduced INS-1 cells. (A) immunoblot of non-transduced cells (CON) or cells transduced with either eGFP (GFP) or connexin-36 tagged with a myc-epitope (Cx 36). Left panel, protein transfer; right panel, corresponding blot co-incubated with anti-eGFP and anti-myc. Molecular weight markers are given in kDa, specifically labelled bands are indicated by correspondingly colored triangles. (B), Clonal INS-1 images of INS-1 β- cells were transduced with viral particles encoding either eGFP (INS GFP, i and iii) or with Cx36 (INS Cx 36, ii and iv) and stained for insulin (i, ii) or for Cx36 (iii, iv). GFP expression was detected directly. Bars, 10 µm.
Figure 6
Figure 6
Electrophysiological analysis and insulin secretion of GFP or CX36 expressing transduced INS-1 cells. (A) Scheme of static incubation of INS-1 cells with culture medium (CM), 3 or 11 mM glucose (G3, G11) or 11 mM glucose in the presence of drugs (glibenclamide 200 nM, Bay K8644 1 µM, forskolin 1 µM). (B) relative responsivity of GFP- or Cx36 (Cx36) transduced cells expressed as absence of effect, stimulation by 11 mM glucose (versus 3 mM) or only stimulated by drugs (no effect of G11 alone; increase versus G3 by glibenclamide 200 nM, Bay K8644, forskolin 1 µM). Note that glucose-sensitive cells were always also drug sensitive. For further analysis (C-F) only those electrodes covered by cells were analyzed where an increase in glucose increased electrical activity. (C) Mean SP frequencies (+SEM) in GFP- or Cx36 transduced cells. (D) statistics of (C). (E) Mean SP amplitudes (+SEM) in GFP- or Cx36 transduced cells. (F) statistics of (E). (G) Insulin content and insulin secretion from non-transduced cells (CON) or GFP- (GFP) or Cx36 (Cx36) transduced cells incubated at 3 mM glucose (G3), 15 mM glucose (G15) or 15 mM glucose and 1 µM forskolin (G15 F). Statistics: Tukey or Dunn post-hoc tests; *, 2p<0.05; **, 2p <0.01; ***, 2p <0.001; Comparison GFP overexpression vs. CX36 overexpression: #, 2p<0.05, ##, 2p<0.01; n, given in corresponding panels.

Similar articles

Cited by

References

    1. Zaharia OP, Strassburger K, Strom A, Bönhof GJ, Karusheva Y, Antoniou S, et al. . Risk of diabetes-associated diseases in subgroups of patients with recent-onset diabetes: A 5-year follow-up study. Lancet Diabetes Endocrinol. (2019) 7:684–94. doi: 10.1016/s2213-8587(19)30187-1 - DOI - PubMed
    1. Ashcroft FM, Rorsman P. Diabetes mellitus and the β cell: The last ten years. Cell. (2012) 148:1160–71. doi: 10.1016/j.cell.2012.02.010 - DOI - PMC - PubMed
    1. Rorsman P, Ashcroft FM. Pancreatic β-cell electrical activity and insulin secretion: Of mice and men. Physiol Rev. (2018) 98:117–214. doi: 10.1152/physrev.00008.2017 - DOI - PMC - PubMed
    1. Dybala MP, Hara M. Heterogeneity of the human pancreatic islet. Diabetes. (2019) 68:1230–9. doi: 10.2337/db19-0072 - DOI - PMC - PubMed
    1. Ravassard P, Hazhouz Y, Pechberty S, Bricout-Neveu E, Armanet M, Czernichow P, et al. . A genetically engineered human pancreatic β cell line exhibiting glucose-inducible insulin secretion. J Clin Invest. (2011) 121:3589–97. doi: 10.1172/JCI58447 - DOI - PMC - PubMed

LinkOut - more resources