. 2023 Dec;17(12):2200029.
doi: 10.1002/lpor.202200029. Epub 2023 Oct 30.

Roadmap on Label-Free Super-Resolution Imaging

Affiliations

Roadmap on Label-Free Super-Resolution Imaging

Vasily N Astratov et al. Laser Photon Rev. 2023 Dec.

Abstract

Label-free super-resolution (LFSR) imaging relies on light-scattering processes in nanoscale objects without a need for fluorescent (FL) staining required in super-resolved FL microscopy. The objectives of this Roadmap are to present a comprehensive vision of the developments, the state-of-the-art in this field, and to discuss the resolution boundaries and hurdles which need to be overcome to break the classical diffraction limit of the LFSR imaging. The scope of this Roadmap spans from the advanced interference detection techniques, where the diffraction-limited lateral resolution is combined with unsurpassed axial and temporal resolution, to techniques with true lateral super-resolution capability which are based on understanding resolution as an information science problem, on using novel structured illumination, near-field scanning, and nonlinear optics approaches, and on designing superlenses based on nanoplasmonics, metamaterials, transformation optics, and microsphere-assisted approaches. To this end, this Roadmap brings under the same umbrella researchers from the physics and biomedical optics communities in which such studies have often been developing separately. The ultimate intent of this paper is to create a vision for the current and future developments of LFSR imaging based on its physical mechanisms and to create a great opening for the series of articles in this field.

Keywords: Raman microscopy; absorption; artificial intelligence; biomedical imaging; confocal microscopy; deep learning; diffraction; diffraction limit; focusing; high-resolution imaging; holography; interference; label-free imaging; metamaterials; microlens design; microresonators; microspheres; nanoplasmonics; near-field imaging; optical microscopy; photonic crystals; polarization; propagation; reflectivity; scattering; solid immersion lens; spectroscopy; structured illumination; super-resolution; superlens; tomography; transformation optics.


Figures

Figure 1.
Figure 1.. Tree diagram of evolutionary development of LFSR subjects and methods.
The tree is rooted in a classical diffraction limit introduced by Abbe, Helmholtz, and Rayleigh. The stem (4) represents development of Mainstream diffraction-limited microscopy due to incorporation of interferometric and holographic approaches. The branches represent different LFSR imaging mechanisms: 1 – Near-field scanning, 2 – Information (INFO) approach, 3 – Nonlinear optics approach, 5 – Structured Illumination, 6 – advanced Superlens Designs, 7 – Microspherical superlens imaging (MSI). Super-Resolved FL Microscopy is illustrated, but it does not belong to LFSR methods. Notation: NSOM, near-field scanning optical microscopy; s-NSOM, scattering-NSOM; EM, electromagnetic; SR, super-resolution; LSPARCOM, learned sparsity based super-resolution microscopy; DL-SR, deep learning-enabled image super-resolution; DSTM, deeply subwavelength topological microscopy; SRS, stimulated Raman scattering; CARS, coherent anti-Stokes Raman scattering; SHG, second harmonic generation; 2PEF, two-photon excitation fluorescence; NPMR, nonlinear photo-modulated reflectivity; SIM, structured illumination microscopy; DHM, digital holographic microscopy; CII, computational integral imaging; QPI, quantitative phase imaging; iSCAT, interferometric detection of scattering; COBRI, coherent brightfield imaging; CIDS, circular intensity differential scattering; DHM, digital holographic microscopy; TDM, tomographic diffractive microscopy; ROCS, rotating coherent scattering; Adv. SIM, advanced SIM; PSIM, plasmonic structured illumination microscopy; LPSIM, localized PSIM; MAIN, metamaterial-assisted illumination nanoscopy; 2DPN, 2-D plasmonic nanoscope; FFSL, far-field superlens; “Hyper”, short for “hyperlens”; FFTR, far-field time reversal; HIRES, high-index resolution enhancement by scattering; MFE, Maxwell fisheye; SOL, super-oscillatory lens; nSIL, nano solid immersion lense; mSIL, metamaterial SIL; MSI, microspherical superlens imaging; iMSI, interferometric MSI.
Figure 2:
Figure 2:. Super-resolved reconstruction of a simulated tubulins dataset [161], composed of 361 high-density frames.
(a,b): SPARCOM reconstruction, executed over 100 iterations with (a) unknown PSF (assuming a dirac delta PSF) and λ=0.0105, (b) the correct PSF and λ=0.13. (c): LSPARCOM reconstruction. (d): Deep-STORM reconstruction. (e): Ground truth position. Reproduced with permission [160] Copyright 2020, Optical Society of America.
Figure 3:
Figure 3:. Super-resolved reconstruction of an experimental tubulins dataset [161], composed of 15 000 low-density frames.
The frames were summed in groups of 50, resulting in a high-density sequence of 300 frames, on which the super-resolved reconstructions were performed. (a,b): SPARCOM reconstruction, executed over 100 iterations with (a) unknown PSF (assuming a dirac delta PSF) and λ=0.0025, (b) the correct PSF and λ=0.1. (c): LSPARCOM reconstruction. (d): Deep-STORM reconstruction. (e): ThunderSTORM [162] reconstruction, using the original low-density sequence, which we refer to “ground truth” (there is no actual ground truth since this is an experimental dataset). Reproduced with permission [160] Copyright 2020, Optical Society of America.
Figure 4.
Figure 4.. DL-SR microscopy and commonly employed DNN architectures.
(a) DL-SR microscopy digitally transforms a LR image obtained by a diffraction-limited microscope to match the corresponding HR image of the same specimen that is acquired by a SR microscopy modality. (b) Common DNN architectures frequently used for DL-SR microscopy, including encoder-decoder, U-Net and DenseNet.
Figure 5.
Figure 5.. Applications of DL-SR optical microscopy.
(a) STORM, SIM, PALM, and Fourier ptychographic microscopy (FPM). (b) Single-image super-resolution in wide-field fluorescence, bright-field and digital holographic microscopy.
Figure 6.
Figure 6.. Deeply Subwavelength Topological Metrology and Microscopy
with a topologically structured (e.g. superoscillatory) light field (following [222,223]). The intensity profile of the diffraction pattern resulting from scattering of the topologically structured light field on the imaged object is mapped by the image intensity sensor. The artificial intelligence deconvolution programme, trained on a large number of scattering events with a priori known object (numbered 1,2,3,4 ) reconstructs/measures the object from the collected data with high resolution.
Figure 7.
Figure 7.. Concept of resolution enhancement with PSIM and LPSIM
(a) The dispersion relation comparison of a propagating photon in dielectric media, a SPP at dielectric/metal interfaces and the LSP field from a nanoantenna array. The wavevectors at the illumination frequency are denoted kP, kSPP and kLSP respectively. Inset: SEM images of typical PSIM and LPSIM substrates. A PSIM substrate is constructed from thin Ag film with an array of patterned slits. A LPSIM substrate consists of a hexagonal silver disc array. Reproduced with permission.[235] Copyright 2014, American Chemical Society. (b, c) Resolution improvement of PSIM and LPSIM for incoherent and coherent imaging system, respectively. The gray circle represents the passband of a conventional microscope. The green circles and yellow circles correspond to the spatial frequency shift due to SPP and LSP illuminations. The dashed circles represent the total detectable Fourier components of the objects with PSIM and LPSIM.
Figure 8.
Figure 8.. HMM for super-resolution imaging.
(a) The isofrequency surface for a Type I HMM (ε>0, ε<0 ). Type I HMMs are commonly achieved with nanorod arrays. (b) The isofrequency surface for a Type II HMM (ε<0, ε>0 ). Type II HMMs are commonly fabricated with metal-dielectric multilayers. (c) Transmission of a multilayer HMM with 12 pairs of 5 nm Ag and 5 nm SiO2. (d) Calculated exemplary speckle patterns for a diffraction limited system (left) and HMM assisted speckles (right). Scale bar, 1 μm.
Figure 9:
Figure 9:
Super-resolution object reconstruction for a binary mask (with the profile shown in the inset), with the error probability of the recovered geometry Perr shown as a function of the effective signal-to-noise ratio, SNReff. The boundary separating the gray and light-yellow background, represents the value of the signal-to-noise ratio that according to Eqn.(8) is sufficient to resolve the λ/16 spacing (see the inset). The red arrow indicates the minimum value of SNReff where the numerical reconstruction procedure implemented in [270] shows no errors.
Figure 10.
Figure 10.
QPI modes of operation. A. Phase shifting interferometry B. Off-axis interferometry. ki is the incident wavevector and kr is the reference wavevector. U1(x,y) is the complex field at the image plane.
Figure 11.
Figure 11.
Applications of QPI. A). QPI reveals intracellular cell mass transport: Quantitative phase image of a culture of glia (left image) and Dispersion curves (right image), Γ(q), in log-log scale, associated with the white box regions in left image, respectively. The green and red lines indicate directed motion and diffusion, respectively, with the results of the fit as indicated in the legend. Adapted with permission from Ref. Copyright 2011, Optics Express. B). Normal colon epithelial nuclei from an ulcerative colitis patient who did not develop colorectal cancer after seven years (low risk, top panel) and from an ulcerative colitis patient who developed colorectal cancer after seven years (high risk, bottom panel). Scale bars 20 μm. Color bars indicate optical path length in nm. Adapted with permission from Ref. Copyright 2018, Springer Nature. C). Collagen fiber orientation probability densities and bar charts counting number of isotropic and anisotropic regions for three different cores. Scale bar: 200 μm. Adapted with permission from Ref. Copyright 2017, SPIE D). 3D rendered isosurfaces of RI maps of individual healthy RBC. Adapted with permission from Ref. Copyright 2014, Scientific Reports. E). Top: a deconvolved z-slice measured using a ×63/1.4 NA oil immersion objective. Middle: a cross-section at the area indicated by the red box and the yellow box. Bottom: false-color three-dimensional rendering of the deconvolution result. Scale bars in all panels, 5 μm. Adapted with permission from Ref. Copyright 2014, Springer Nature.
Figure 12.
Figure 12.. Current trends in QPI. A.
Phase imaging with computational specificity (PICS)-To demonstrate time-lapse imaging and high-content screening capabilities, authors seeded a multiwell with three distinct concentrations of SW cells (×20/0.8). These conditions were imaged over the course of a week by acquiring mosaic tiles consisting of a 2.5 mm2 square area in each well using a ×20/0.8 objective. The machine learning classifier, trained at the final time point after paraformaldehyde fixation, is applied to the previously unseen sequence to yield a DiI and DAPI equivalent image. Interestingly, the neural network was able to correctly reproduce the DiI stain on more elongated fibroblast-like cells, even though few such cells are present when the training data was acquired (white arrows). Adapted with permission.[307] Copyright 2020, Springer Nature. B. Phase-stain for image-to-image translation-PhaseStain-based virtual staining of label-free kidney tissue (Jones’ stain) and liver tissue (Masson’s Trichrome). Adapted with permission.[306] Copyright 2019, Light: Science & Applications. C. Resolution enhancement through deep learning-Spatial frequency analysis for the diffraction-limited system. Adapted with permission.[323] Copyright 2019, Scientific Reports.
Figure 13.
Figure 13.. Importance of protein-protein interactions and their relationship to polarizability and mass.
Counter-clockwise from top left: oligomerisation, antibody-antigen interactions, protein stability, viral infection, protein synthesis, G-protein coupled receptor signalling.
Figure 14.
Figure 14.. Future challenges of light scattering-based microscopy.
A, Detector improvement for lowering shot noise B, Amplification of light scattering. C, Prolonged, repeated observation. D, Larger field of view for improved statistics. E, Improving measurement precision of individual molecules (#1, #2, #3) by higher statistics per molecule. F, Passivated/activated surfaces for selective measurements. G, Image processing for improving image quality. H, Classification algorithms or additional experimental information (fluorescence, polarisation, etc.) to differentiate otherwise indistinguishable particles.
Figure 15.
Figure 15.. Coherent brightfield (COBRI) microscopy.
(a) Schematic of the simplest configuration of COBRI microscopy with a stationary widefield illumination. (b) Schematic of COBRI microscopy with beam-scanning unit and contrast-enhancement unit. (c) COBRI images of a virus particle at different axial positions, showing z-dependent COBRI contrast. Reprint with permission from Ref. [346]. Copyright 2017, American Chemical Society. (d) Side-by-side comparison of the COBRI (left) and iSCAT (right) images of a HeLa cell cultured on coverslip. The dashed lines mark the boundaries of the nucleus and the cell body.
Figure 16.
Figure 16.. Ultrahigh-speed 3D tracking of a single vaccinia virus particle on the surface of a live cell by COBRI microscopy.
(a) COBRI image of single vaccinia virus particles. (b) Estimation and removal of cell background enables background-free imaging of the virus particle. (c) Localization precision of a single virus particle is better than 3 nm in 3D. (d) Lateral diffusion trajectory of a virus particle on the live cell plasma membrane, recorded at 100 000 fps. (e) Reconstructed 3D trajectory of the virus particle. (f) Highly transient (sub-millisecond) nano-confinements of the virus particle detected in the trajectory (highlighted in red). (g) Representative trajectory segments of transient confinements of the virus particle. Adapted with permission from Ref. [346]. Copyright 2017, American Chemical Society.
Figure 17.
Figure 17.. Experimental setups and mechanism for interferometric plasmonic microscopy (A-E) and plasmon-enhanced ptychography (F-G).
(A) Schematic showing the interferometric plasmonic microscopy (iPM) setup. (B) iPM real-space image showing a 40 nm Ag nanoparticle and (C) in reciprocal space. (E) Diagram showing incident angle (θi) and resonance angle (θSPR). Inc (incident beam); Obj (objective); BFP (back-focal-plane); LR (leakage radiation); Ref (reflective beam); TL (tube lenses). Reprinted (adapted) with permission from ref[393]. Copyright 2019 American Chemical Society. (F) Experimental set-up for PE-ptychography. (G) Schematic of the evanescent electromagnetic field generated by SPPs. EM, electromagnetic; TM, transverse magnetic; TE, transverse electric. Reprinted (adapted) with permission from ref[394]. Copyright 2021 Springer Nature.
Figure 18.
Figure 18.. Plasmon-enhanced images of ocular nerve tissue and simulated amplitude and phase contrast predicted for different thicknesses of carbon.
(A) Ptychography without plasmon enhancement and (B) PE-ptychography. The graphs represent line outs through the same 70 nm thick edge feature on the histological tissue section, with significantly enhanced contrast observed in both the amplitude and phase when using PE-ptychography. Note that the spatial resolution for both ptychography and PE-ptychography, based on lineouts of the edge of the tissue, are equal to 719 nm ± 5 nm (λ=660nm ). The two vertical lines indicate the two different wavelengths (λ ) at which ptychography data was collected during the experiment. (C) Amplitude and (D) phase variation as a function of wavelength without the plasmonic device, (E) amplitude and (F) phase variation as a function of wavelength with the plasmonic device in place for four different carbon thicknesses indicated in the top right-hand corner of (C). Reprinted (adapted) with permission from ref[394]. Copyright 2021 Springer Nature.
Figure 19.
Figure 19.. Schematic illustration of the machine learning framework.
Reprinted (adapted) with permission from ref[398]. Copyright 2017 American Chemical Society.
Figure 20.
Figure 20.
A) Block diagram of the CIDS scanning microscope. The red and green arrows correspond to the transmitted polarimetric and to the reflected fluorescence path, respectively[420]. B) An example of theoretical results about the presence of a spike-virus in a spherical droplet with size comparable to sars-cov2[425]. C) Use of the Phasor analysis to distinguish species on the basis of CIDS signature[426]; D) Normalized CIDS (blu) image of an isolated HEK nucleus after extraction compared with fluorescence intensity (green) signature based on DNA labelling[420]. Labels: Ti:Sa: Titanium-Sapphire coherent laser source tuned at 740 nm to prime both CIDS and two-photon excitation fluorescence. SU: Scanning Unit. PEM: Photoelastic Modulator at 50 kHz resonant frequency. Obj1: Microscope objective to image the sample. Obj2: Microscope objective used as a condenser to collect the transmitted light. GT: Glan-Taylor prism. APD1 and APD2: Avalanche Photodiode for + 45° and −45° polarization detection after the GT. LA: Lock-in Amplifiers. LA#1 and LA#2: input channels of the LA, locked at 50 kHz from the reference signal of the PEM. The two APDs are both connected to each channel of the LA and also directly to the control unit. The terms “I +” and “I −” are the detected intensities + 45°and −45° polarization projections after the GT, respectively. Insets modified from Ref [420,425,426].
Figure 21.
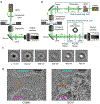
Figure 21.. Principles of label-free quantitative imaging with super-resolution by off-axis holography.
(a) Regular off-axis holography. (b) Multiplexing two wave fronts into a single hologram. (c) Multiplexing six wave fronts into a single hologram.
Figure 22:
Figure 22:
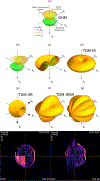
Optical Transfer Function (OTF) for various configurations in transmission TDM. (a): digital holographic microscopy: the OTF depicts a cap of sphere with large lateral, but limited longitudinal extension. (b): with inclined illumination, same positions of kdiff vectors provide new kobj vectors. (c,d): with many illuminations, a filled, extended OTF is obtained. (e): with sample-rotation, an almost completely filled sphere is obtained (but of lesser extension than in previous case). (f,g): OTFs combining illumination and sample rotation with 2, and 4 evenly-spaced specimen positions. Bottom row: Betula pendula pollen grain images in DHM and three TDM variants. Left composite image depicts x-y slice in the focal plane, showing improved resolution in TDM, but only twice that of DHM. Contrast is however better thanks to better optical sectioning. Right composite image highlights the large differences in imaging capabilities along the optical axis. Only TDM-IRSR can deliver true improved and isotropic resolution, while holography is not, strictly speaking, a true 3-D imaging method when considering transparent samples: only optical thickness can be measured.
Figure 23.
Figure 23.. Schematic illustrations of scanning near-field optical microscope (SNOM).
(a) The original proposal of aperture-type SNOM (a-SNOM) by Edward H. Synge. The nanoscale orifice can convert localized near field into propagating far-field wave. (b) The original proposal of scattering-type SNOM (s-SNOM) by Edward H. Synge. The metallic nanoparticle can scatter localized near field into propagating far-field wave. (c) Modern a-SNOM based on a scanning probe microscope with an aperture/fiber/waveguide coupled near-field tip. (d) Modern s-SNOM based on a tapping-mode atomic force microscope. The integration of Fourier-transform infrared spectroscopy (FTIR) with s-SNOM gives rise to Nano-FTIR. The integration of pump-probe spectroscopy with s-SNOM ends up as ultrafast nanoscopy, which combines nanometer spatial resolution with femtosecond temporal resolution.
Figure 24.
Figure 24.
Pathways en route to broadband and multimodal SNOM for quantitative nano-imaging and nano-spectroscopy.
Figure 25.
Figure 25.. Concept and spatial resolution characterization of IR photothermal imaging.
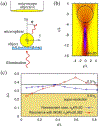
(A) Visible beam propagation geometry when the IR beam is off. (B) When the IR light is on, the photothermal effect leads to deflection of the visible beam. (C) IR photothermal imaging of a 500-nm polymer bead. The horizontal and vertical line profile cross the center of the bead indicating a sub-micrometer spatial resolution. Reproduced with permission.[509] Copyright 2016, American Association for the Advancement of Science.
Figure 26.
Figure 26.. Widefield IR photothermal imaging setup and live-cell chemical maps.
(A) Mid-IR pump and visible probe are loosely focused to the sample and thus enables the widefield detection of the photothermal responses. (B-C) Label-free live ovarian cancer cell imaging targeted at the lipid C=O bond vibration and the protein amide I band. Scale bars: 10 μm. Reproduced with permission.[513] Copyright 2019, American Association for the Advancement of Science.
Figure 27.
Figure 27.. Energy level diagrams of pump-probe microscopy based on contrast mechanisms of
(a) ground state depletion, (b) stimulated emission, (c) excited state absorption, and (d) two-photon absorption.
Figure 28.
Figure 28.
(a) Example of a two-beam laser-scanning pump-probe nanoscope setup. BS: beam splitter, EOM: an electro-optical modulator for intensity modulation, vpp: vortex phase plate, DM: dichroic mirror, PBS: polarizing beam splitter, SH: scanning head unit, O: objective, C: condenser, det: detector. The pump beam is shown in green while the probe beam in red. (b) Temporal modulation behavior of input and output pulse trains before and after interacting with the sample. Depending on the light–molecule interaction, the probe beam can undergo either a relative gain (SE, SRG, GSD) or a loss (TPA, ESA) in its output intensity (ΔT ), exhibiting in-phase and anti-phase modulation, respectively. The pump temporal modulation is shown as a black square wave. The input probe intensity is marked by a dashed grey line. The tunable temporal delay (Δt ) of input pulses is shown in the inset graph. (c) Normalized pump−probe and saturated pump−probe images of SLG folding and defects. Scale bar 2 μm. Zoomed regions I and II are also presented, and line profiles across the arrows are shown as black dots (non-saturated case, PP) and red dots (saturated case, SPP). Gaussian fits of the non-saturated data are shown as solid black lines, while Lorentzian single-peak (I) and double-peak (II) fits of the saturated data are shown as solid red lines. The dashed red lines in graph II highlight the single Lorentzian peaks retrieved from the analysis. The obtained resolution is marked in the graphs as full-width-half-maximum of the fitted curves. Adapted with permission.[534] Copyright 2019, American Chemical Society.
Figure 29.
Figure 29.. Examples of label-free super-resolution Raman imaging.
A mouse brain tissue observed by a) conventional line illumination and b) structured line illumination Raman microscopy using 532 nm excitation. Raman peaks at 1682 cm−1 (amide-I, red) and 2848 cm−1 (CH2 stretching, green) were used for image reconstruction. c) the intensity profiles of Raman band observed between the arrows in a) and b). d)-f) SRS images of an expanded HeLa cell. A vibrational mode of CH3 at 2940 cm−1 was detected by using 1031.1 nm Stokes and 791.2 nm pump beams. e) and f) are zoomed images of the yellow box region in d) and e), respectively. g) the line profile on the yellow line in f). Scale bars: 30 μm in d) and 2 μm in e) and f). Reproduced under the terms of the CC BY 4.0 License. [564] Copyright 2015, The Authors, published by Springer Nature. Reproduced under the terms of the CC BY 4.0 License. [571] Copyright 2021, The Authors, published by Springer Nature.
Figure 30.
Figure 30.. Illustration of the operation principle for the two possible directions:
(a). A narrow pump Gaussian beam at 532 nm, creates a hole in the middle of a wider IR probe beam. (b). Donut shape 532 nm pump beam blocks the periphery of the Gaussian IR probe beam and transmits only a narrow beam in its center [596].
Figure 31.
Figure 31.
The dip generated in the Gaussian IR probe beam was induced by the green pump beam. One diffraction limit unit is 600 μm. (a). The image of the transmitted Gaussian probe beam and its profile. (b). The shaped probe beam and its profile. The probe beam is having a dip that is superimposed on its center by the pump beam.
Figure 32.
Figure 32.
Gaussian probe IR laser beam at the diffraction limit scan across a resolution target containing 3-bars having a period of 500 μm: (a). Without applying the pump beam. No resolution improvement is obtained. (b). A scan of the target with the pump beam creating a dip in the probe’s beam PSF. Super-resolution is obtained and the target is reconstructed. The red lines are the direct scan results. The blue lines are the direct scan results deconvoluted with the shape of the probe beam having the central dip [602].
Figure 33.
Figure 33.. Optical nonlinearity and super-resolution imaging in plasmonic NS.
(a)(d)(g) are various types of nonlinearities, including sub-linearity (a), super-linearity (d), and all-optical switch (g), from a single gold nanosphere (80- or 100-nm diameter). (b)(e)(h) Super-resolution scattering image are obtained by SAX microscopy (b), where images are reconstructed by signal demodulated at fm and 3fm, where fm is the temporal modulation frequency; by super-linear microscopy (e), where images are formed under low and high illumination; and by SUSI microscopy (h), where a λ=592nm donut suppression beam is applied. (c)(f)(i) are corresponding line profiles, quantifying the resolution enhancement.
Figure 34.
Figure 34.. Optical nonlinearity and super-resolution imaging in dielectric NSs.
(a)(d)(g) are various types of nonlinearities, including sub-linearity (a), super-linearity (d), and all-optical switch (g), from a single silicon NS or silicon NS array. (b)(e)(h) Super-resolution scattering images are obtained by SAX microscopy (b); by differential signal processing in super-linear microscopy denoted as differential reverse saturation scattering (DRSS) (e); and by STED-like microscopy (h), where a λ=693nm donut suppression beam is applied under low and high illumination to present different scattering saturated levels. (c)(f)(i) are corresponding line profiles, quantifying the resolution enhancement.
Figure 35.
Figure 35.
(Left) The essentials of NPMR. A train of intensity modulated pump pulses (red) is focused on a sample. Focused and position overlapping train of probe pulses (green), with constant intensity, are delayed by a few ps. The increase of the sample temperature, induced by the pump pulses give rise to changes in the probe reflectivity (blue line). The black dots represent the changes in the probe-reflectivity. The harmonics analysis of changes in reflectivity with a lock-in amplifier, provide the nonlinearity of the response. (Right) the improvement in resolution of at test sample increasing with the harmonics order. Reproduced with permission.[625]. Copyright 2015 American Chemical Society.
Figure 36
Figure 36
A schematic view of the experimental system. The role of the galvo mirror is to enable the combination of SPOM and NMPR.
Figure 37.
Figure 37.
(Left) Super resolution Photo-modulated reflectivity using single color or two color. The sample consists of Au double lines, 125 nm wide, with gaps of 370, 270 and 180 nm, respectively. (a) Line imaging of probe reflection (red) and pump reflection (purple). (b) Two color Photo-modulated reflectivity line imaging using first (blue), and second (black) harmonics. (c) Single color photo-modulated reflectivity using first (orange), and second (black) harmonics. Note the resolution enhancement (95 ±5 nm) at 2ω1 in both two and single-color modalities. Reproduced with permission.[627], Copyright 2012, OSA Publishing. (Right) The effect of apodization: Line scan of SR target using clear beam (blue) and apodized beam (brown).
Figure 38.
Figure 38.
Schematic for nonlinear structured illumination-based super-resolution microscopy. By spatially modulating the incident/excitation fields, one can detect higher spatial frequencies associated with the sample. After reconstruction, an image with improved resolution can be formed.
Figure 39.
Figure 39.
Label-free tissue imaging with non-linear optical microscopy modalities. a) TPEF+SHG and b) H&E images of murine colon. The TPEF+SHG image (green:TPEF, red:SHG) was collected ex vivo through an endomicroscope objective. Figure adapted from [24]. c) THG+SHG (green:THG, red:SHG) and d) H&E images of human brain affected by glioblastoma, showing hypercellularity, vascular proliferative changes, and aggregation of macrophages (arrows). Figure adapted from [636]. e) SRS+SHG (green: lipids SRS@2845cm−1, blue: proteins SRS@2930cm−1, red: collagen SHG) and f) H&E images of laryngeal squamous cell carcinoma tissues. Figure adapted from [640]. g) CARS+TPEF+SHG (green:TPEF, red:CARS, blue:SHG), h) H&E and i) virtual H&E images of human colon. The virtual H&E image was computed from the NLO image using Deep Learning. Figure adapted from [659].
Figure 40.
Figure 40.
When a glycerin microdroplet is illuminated near its edge with a tapered fiber tip, an image of the tip may be seen at the opposite edge of the microdroplet.
Figure 41.
Figure 41.
Numerical simulations of image magnification (M=R1/R2=2 ) using a compound inverted Eaton lens.
Figure 42.
Figure 42.
Numerical modeling of excitation and scattering of surface electromagnetic waves in a gradient waveguide made of doped graphite at λ0=275nm. The guided UV field propagating through the waveguide is scattered by a 4 nm diameter metal nanowire which is located near the waveguide.
Figure 43:
Figure 43:. Wave propagation on the surface of a sphere.
The wave is emitted from a point source at some point on the surface. While propagating, the wave initially expands but then focuses on the point antipodal to the source. If the wave gets absorbed at the image the focus has point-like precision as the peaks show.
Figure 44:
Figure 44:
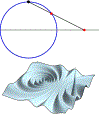
Stereographic projection. In the stereographic projection, a line is drawn from the North Pole of the sphere to the point to be projected. Where this line intersects the plane through the Equator lies the projected point. The top picture shows the stereographic projection in a cut through the sphere. The lower picture shows the wave on the sphere (Figure 1) projected accordingly. The stereographic projection is a conformal map that preserves angles and just distorts distances. An isotropic material does the same. In particular, Maxwell’s fish eye [9] acts like a sphere in stereographic projection [8]. As light can be perfectly focused on a sphere (Figure 43) it can be perfectly focused in Maxwell’s fish eye [686], too, provided the image gets absorbed and does not interact with the source [695,697].
Figure45 –
Figure45 –. Microsphere nanoscopy.
(a) Contact mode setup and imaging examples (50–100 nm samples) (b) Resolution analysis by the PSF convolution method (λ=405, confocal mode). (c) Non-contact scanning superlens imaging, setup, and examples (microsphere attached to AFM tip, sample: 80–90 nm nanodevices and fluorescent-labelled actin filament). (d) SR mode demo at size parameter q = 26.94164 with peak value ~43.5k and theoretical resolution λ/3λ/6 for n=1.5, q=090 microspheres.
Figure 46
Figure 46. Metamaterial Solid immersion Lens (mSIL).
(a) Concept of mSIL and synthesis approach (b) Near-field coupling between nanoparticles in mSIL transforms incident propagating wave into large-area structured evanescent wave illumination of substrate at FWHM resolution ~8 nm. (c1) Super-resolution imaging of 60 nm feature on IC chip by mSIL. (c2) Bottom surface of mSIL detached from c1 sample. (d) 50 nm Polystyrene particle imaged by mSIL. (e) 45 nm IC chip imaged by mSIL.
Figure 47:
Figure 47:. Schematic of MSI in the transmission geometry.
(b) Virtual image of a dipole marked by the dot near the microsphere. The image intensity is plotted as a function of the transverse coordinate y and position x of the focal plane of the objective. The refractive index of the microsphere is ns=1.4 and of the background is nb=1. (c) Resolution δ for imaging in water nb=1.33 background for the index contrast ns/nb=1.4. The horizontal lines define two diffraction limits and the colored area defines the super-resolution regime. The data points for (c) are taken from Ref. [737] and rescaled for the immersion case.
Figure 48:
Figure 48:. Imaging of subwavelength current distribution (Equation (28)).
(a) Scattered energy W (normalized to some W0 ) towards the objective (π/2<φ<π/2) as a function of the phase index of the current for several values of the particle size. The nonresonant case is exemplified by kR=5,8,20, the resonant case by kR=20.384 (WGM with azimuthal number m=24, see Figure 4 in Ref. [748]. The colored area defines the region nph>ns in which the resolution above the SIL limit can be achieved. (b, c) Images produced by the current with nph=1.6 for various focal plane locations for kR=20 and kR=20.382. The images are normalized to their maximum values, which in (c) is 46 times higher than in (b). The oscillating curves near the microspheres in (b, c) illustrate current (2).
FIGURE 49.
FIGURE 49.
Designs of cellphone microscopy based on: (a) lensless shadow imaging on top of the sensor array, (b) digital in-line holographic imaging, (c) combination with the microscope objective, and (d) microoptics solutions.
FIGURE 50.
FIGURE 50.
(a) Comparison of images of various biomedical samples taken by a standard microscope with 10×(NA=0.25) objective (left column) and by proposed cellphone microscopy (right column) through LASFN35 ball lens with D=2.0mm. Pairs of cellphone images are obtained at different positions of the ball lens. (b, c) Images of nanoplasmonic structures resolved through the ball lens by cellphone microscopy at λ=480nm: double-stripe object and ‘Siemens star’ target [771], respectively. (d) Intensity cross-sections measured using Siemens star target [771] at different radial distances (indicated (1–3) in (c)) and corresponding intensity profiles calculated by convolution with 2-D Gaussian PSF with FWHM = 0.9 μm. Good agreement with theory indicates that the resolution is 0.9 μm. (e) Summary of resolution quantification for double-stripe objects performed using ball lenses with D=0.5mm, 1.0 mm, and 2.0 mm at λ=430, 480, 546, 589, and 632 nm.
Figure 51.
Figure 51.
Normally polarized dipole p creates an axially symmetric wave beam qualitatively described by the laws of geometrical optics. (a) – Non-divergent beam and its normalized intensity distribution over the transverse coordinate x normalized to the sphere radius R. (b) – Divergent beam and its intensity distribution over the angle α of rays whose continuations cross at the same point – that of the virtual dipole located at the left of the sphere.
Figure 52.
Figure 52.. Two normally oriented dipoles are resolved despite of the subwavelength gap δ.
The resolution occurs because the gap between two virtual sources is magnified so that δv > λ/2. The lens grants an additional magnification (Δ > δv). (a) A beam of parallel rays transforms at the Rayleigh length DR into a conical beam with a pronounced phase center (virtual source). In the inset the simulated picture of this beam behind the Rayleigh range is presented. (b) In the conventional scenario, the spherical fronts are created immediately behind the sphere.
Figure 53.
Figure 53.
(a) Intensity color map for two horizontal dipoles symmetrically sandwiched between a large silicon block and a 2D «microsphere» of glass and separated by the subwavelength gap δ. The second «microsphere» operates as a lens. In its focal plane (dashed line) the image is formed. (b) The intensity distribution in the image plane for two gaps: δ=0.24λ (blue curve) and δ=0.5λ (pink curve). The image is magnified: Δ=0.49λ2δ and Δ=1.04λ2δ.
Figure 54
Figure 54
(a) Surface topography reconstructions of a 200-nm-groove standard and (b) Layout of compensated microsphere-assisted interference microscope. LS, light source. MO, microscope objective. MS, microsphere. S, sample. M, reference mirror (with a microsphere). L, relay lens. C, camera.
Figure 55
Figure 55
Real part of the electric field showing the evanescent wave coupling by a 4-μm-diameter microsphere (nsph=1.5). The evanescent wave was generated by total internal reflexion using at a substrate / air interface and a plane wave with an incident angle of 55°. nsub=1.5 and λ>600nm.
Figure 56.
Figure 56.
Arrays of sup-hemispheres. CSEM, Switzerland.[803]

References

    1. Abbe E, “Beiträge zur Theorie des Mikroskops und der mikroskopischen Wahrnehmung,” Archiv für mikroskopische AnatomieArchiv für mikroskopische Anatomie Entwichlungsmech 9, 413–468 (1873).
    1. von Helmholtz H, “The theoretical limits of resolving power in the microscope,” Poggendorff Ann. Jubelbd, 557 (1874).
    1. Rayleigh Lord, “On the manufacture and theory of diffraction-gratings,” Philos. Mag 47, 81–93, 193–205 (1874).
    1. Hell SW et al., “The 2015 super-resolution microscopy roadmap,” J. Phys. D: Appl. Phys 48, 443001 (2015).
    1. Huang B, Bates M, and Zhuang X, “Super resolution fluorescence microscopy,” Annu. Rev. Biochem 78, 993–1016 (2009). - PMC - PubMed