[Preprint]. 2024 Jun 5:2024.02.15.24302255.
doi: 10.1101/2024.02.15.24302255.

ACK1 and BRK non-receptor tyrosine kinase deficiencies are associated with familial systemic lupus and involved in efferocytosis

Affiliations

ACK1 and BRK non-receptor tyrosine kinase deficiencies are associated with familial systemic lupus and involved in efferocytosis

Stephanie Guillet et al. medRxiv. .

Update in

Abstract

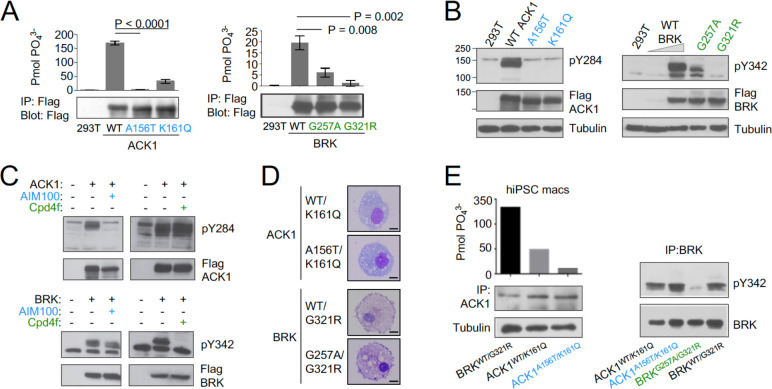
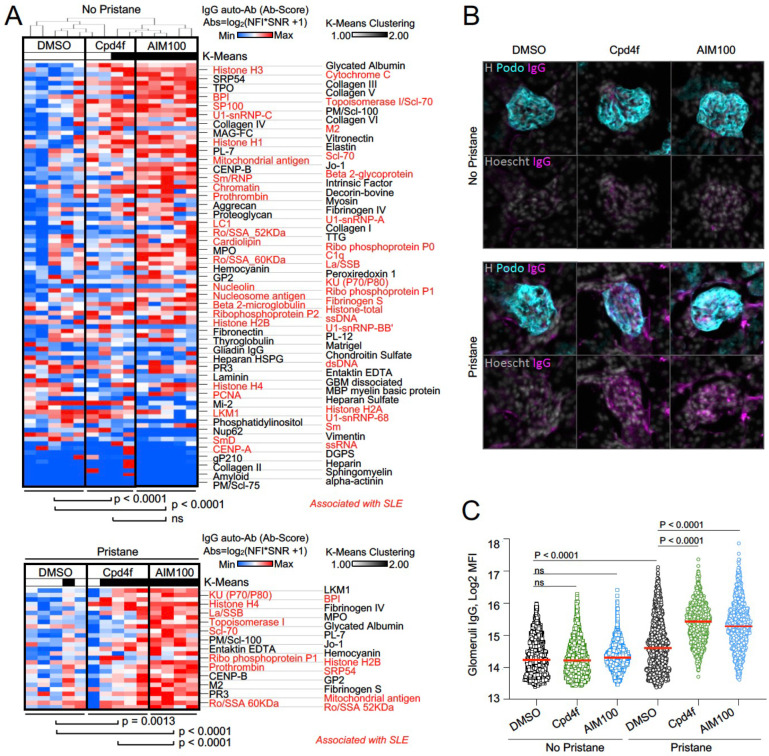
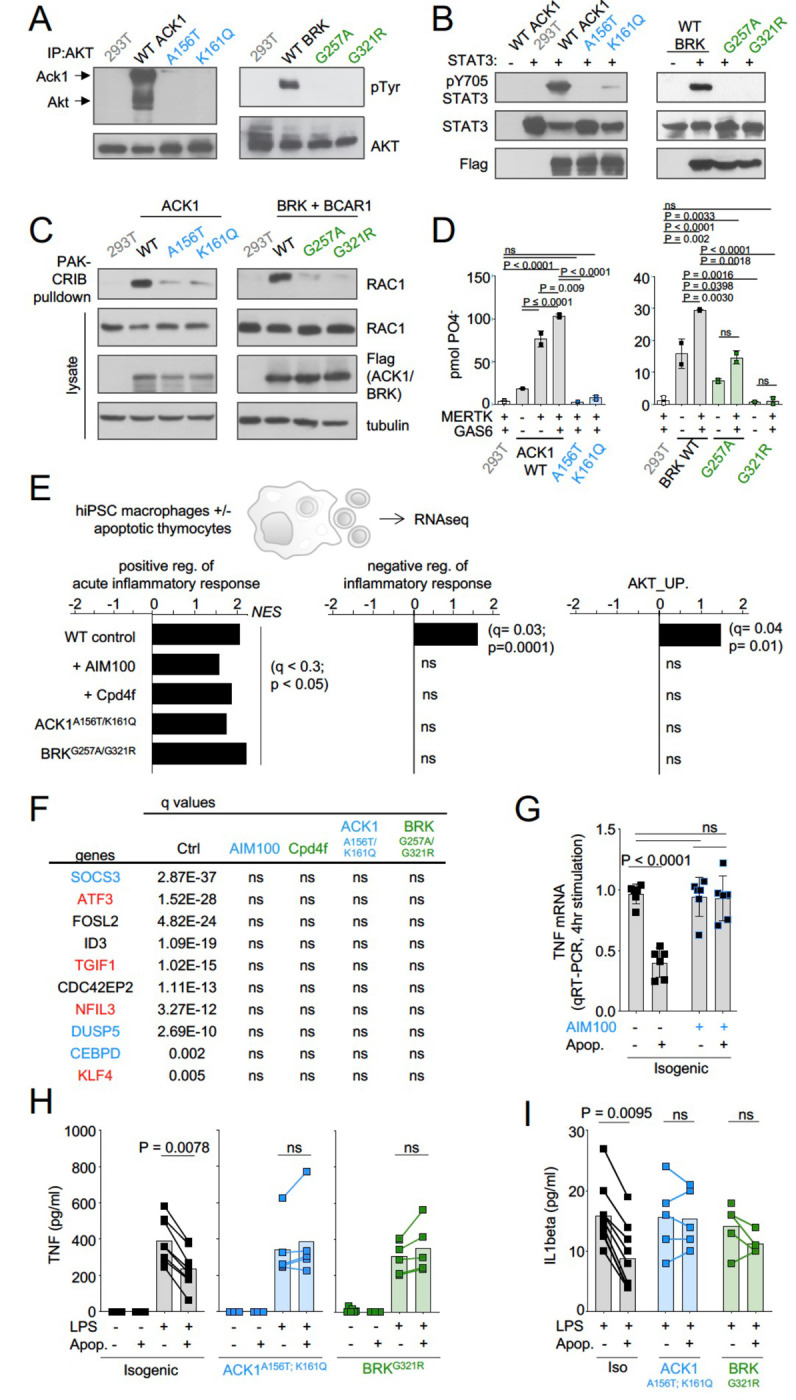
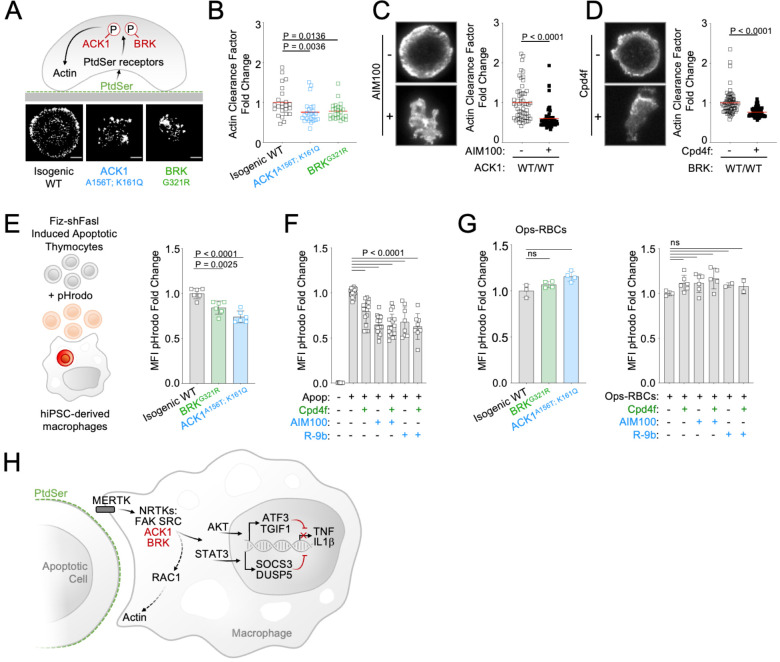
Systemic Lupus Erythematosus (SLE) is an autoimmune disease, the pathophysiology and genetic basis of which are incompletely understood. Using a forward genetic screen in multiplex families with systemic lupus erythematosus (SLE) we identified an association between SLE and compound heterozygous deleterious variants in the non-receptor tyrosine kinases (NRTKs) ACK1 and BRK. Experimental blockade of ACK1 or BRK increased circulating autoantibodies in vivo in mice and exacerbated glomerular IgG deposits in an SLE mouse model. Mechanistically, non-receptor tyrosine kinases (NRTKs) regulate activation, migration, and proliferation of immune cells. We found that the patients' ACK1 and BRK variants impair efferocytosis, the MERTK-mediated anti-inflammatory response to apoptotic cells, in human induced Pluripotent Stem Cell (hiPSC)-derived macrophages, which may contribute to SLE pathogenesis. Overall, our data suggest that ACK1 and BRK deficiencies are associated with human SLE and impair efferocytosis in macrophages.


Figures

Figure 1.
Figure 1.. NRTK compound heterozygous missense variants in two multiplex families with SLE.
(A, B) Pedigrees and Sanger re-sequencing of DNA from patients and healthy relatives of kindred 1 (A) carrying K161Q and A156T ACK1 mutations and kindred 2 (B) carrying G257A and G321R BRK mutations. Individuals with SLE are indicated by black boxes; deceased individuals are shown by diagonal bar; bold indicates the members analyzed by WES; squares indicate males, circles indicate females, and hexagons indicate generation I or II individuals with undisclosed sex for confidentiality. BlackGuanine, greenAdenine, redThymidine, blueCytosine. Arrows indicate nucleotide substitutions. Text indicates amino-acid substitutions. (C) Domain architecture (top panel) of ACK1 and BRK, with indicated mutations. SH2, Src homology 2; SH3, Src homology 3; Kinase, tyrosine kinase domain; C, Cdc42 binding domain; PR, Proline rich domain; SAM, Sterile α motif. Alignment of kinase domains (bottom panel) from ACK1 and BRK orthologs. Arrows indicate positions of mutations and stars indicate the amino acids conserved throughout species. (D) Three dimensional (3D) structures of ACK1 and BRK. Topthe crystal structure of ACK1 in a complex with AMP-PCP (PDB ID1U54). The mutated residues (A156 and K161) are shown in red, and the nucleotide analog is in green. Bottomthe crystal structure of BRK in a complex with the ATP-competitive inhibitor dasatinib (PDB ID5H2U). The mutated residues (G257 and G321) are shown in red, and dasatinib is in green.
Figure 2.
Figure 2.. ACK1 and BRK mutations are null and hypomorph alleles. (A) Immunoprecipitation (IP) kinase assay.
ACK1 (Top) was immunoprecipitated from 293T cells expressing Flag-tagged ACK1 wild type (WT), ACK1 A156T, or ACK1 K161Q with anti-Flag Ab. Immunoprecipitated proteins were used for duplicate in vitro kinase reactions with WASP synthetic peptide. Samples of the immunoprecipitates were also probed with anti-Flag Ab. BRK (bottom) was immunoprecipitated as above from 293T cells expressing Flag-tagged BRK WT and mutants with anti-Flag Ab. Kinase reactions were performed with peptide AEEEIYGEFEAKKKG, and represented as above, and samples of the immunoprecipitates probed with anti-Flag Ab. p-values were calculated using an Anova test (Tukey’s multiple comparisons test). (B) Western blot analyses of lysates from 293T cells expressing (left panel) Flag-tagged WT or mutant forms ACK1 probed with anti-ACK1 Tyr(P)284 (PY284), anti-Flag and anti-tubulin antibodies (Ab), and expressing (right panel) Flag-tagged WT or mutant BRK probed with anti-BRK Tyr(P)342 (PY342), anti-Flag and anti-tubulin antibodies. For BRK, 293T cells were starved overnight, and stimulated with 100 ng/ml EGF for 10 min. The lysate from WT BRK indicated as low was from cells transfected with one-tenth the amount of WT DNA. (C) Western blot analyses of lysates from 293T cells expressing ACK1-Flag or BRK-Flag treated with AIM100 or Cpd4f and probed with anti-ACK1 Tyr(P)284 (PY284) or anti-BRK Tyr(P)342 (PY342) and anti-Flag antibodies. (D) May-Grunwald-Giemsa staining of iPSC-derived macrophages from familial controls and ACK1 and BRK patients. Scale bar 10 μm, 100X objective. Representative images from over 50 observed cells per line. (E) Immunoprecipitation (IP) kinase assay in patients’ macrophages. (Left panel) ACK1 was immunoprecipitated from BRKWT/G321R, ACK1WT/K161Q and ACK1A156T/K161Q iPSC-derived macrophages with anti-ACK1 Ab. The immunoprecipitated proteins were used in duplicate for in vitro kinase reactions with WASP synthetic peptide. Samples of the immunoprecipitates were also probed with anti-ACK1 Ab and anti-tubulin Ab. (Right panel) BRK was immunoprecipitated from ACK1WT/K161Q, ACK1A156T/K161Q, BRKWT/G321R and BRKG257A/G321R iPSCs-derived macrophages with anti-BRK Ab. The immunoprecipitated proteins were probed with anti-BRK Tyr(P)342 (PY342) and anti-BRK antibodies.
Figure 3.
Figure 3.. ACK1 and BRK blockade induces autoimmunity in mice. (A) Heatmaps comparing the levels of IgG autoantibodies detected in serum of mice treated with inhibitors.
Heatmaps show autoantigen microarray panels performed on serum from 4 month-old BALB/cByJ female mice which received a weekly intra-peritoneal injection of DMSO (vehicle, 20ul/mice), AIM100 (25mg/kg in 20ul), or Cpd4f (20mg/kg in 20ul/) since the age of five weeks. Top panel depicts results for mice that did not receive a pristane injection. Bottom panel represents results for the top differentially produced auto-antibodies in inhibitor treated or control mice that received a Pristane injection at 5 week of age. Plotted values represent Ab Scores (Log2 [antigen net fluorescence intensity (NFI) × signal to noise ratio (SNR) +1]. Heatmap columns represent serum analysis of independent mice (n=4–5 for each of the 3 conditions). Heatmap rows sorted top to bottom starting with most significantly increased Ab Score in Cpd4f and AIM100 mice in comparison to DMSO treated mice. P-values were calculated using a Wilcoxon matched-pairs signed rank tests. Hierarchical clustering is based on one minus Pearson correlation with complete linkage method. K-means clustering is based on Euclidean distance, with 2 clusters, with 10000 maximum iterations. (B,C) Immunofluorescence for mouse IgG on kidney sections. Representative micrographs (B) displaying glomeruli on kidney sections from 4 month-old BALB/cByJ female mice treated as in (A) and stained with Hoechst 33342, anti-mouse IgG, and anti-mouse Podoplanin antibody. In the quantification plot (C) each symbol represents the IgG mean fluorescence intensity (MFI) in a single glomerulus, of mice treated with designated inhibitors, in the presence or absence of pristane. Approximately 250 glomeruli we analyzed per section/mouse (>95% of all glomeruli in an entire longitudinal kidney section). n=4–5 mice per condition. P-values were obtained using a Kruskal-Wallis test with multiple comparisons.
Figure 4.
Figure 4.. ACK1 and BRK kinase deficiency disrupts the anti-inflammatory response driven by apoptotic cells in macrophages. (A) Western blot analysis for AKT phosphorylation by ACK1 and BRK.
Cell lysates from 293T cells were incubated with anti-AKT. Immunoprecipitated proteins were probed with anti-phosphotyrosine and anti-AKT antibodies. (B) Western blot analysis for STAT3 phosphorylation by ACK1 and BRK. Lysates from 293T cells coexpressing STAT3 and Flag-tagged WT or mutant forms (A156T and K161Q) of ACK1 or mutant forms (G257A and G321R) of BRK were probed with anti-phospho-STAT3 (Tyr705), anti-STAT3 and anti-Flag antibodies. For analysis of BRK, cells were treated with 100 ng/ml EGF for 10 min. (C) RAC activation by WT ACK1 and BRK. Cell lysates from 293T cells expressing WT or mutant forms of ACK1 (left) and lysates from 293T cells expressing WT or mutant forms of BRK (right) were incubated with GST-PAK CRIB sepharose beads, and the level of RAC1 GTP was determined by immunoblotting with anti-Rac1 antibody. Lysates were also probed with anti-Rac1, anti-FLAG and anti-tubulin antibody. For analysis of BRK, 293T cells were cotransfected with CAS and stimulated with 100 ng/ml EGF for 10 min. (D) MERTK increases kinase activity of BRK and ACK1. IP kinase assay. ACK1 (left) was immunoprecipitated from 293T cells co-transfected with Flag-tagged ACK1 WT, ACK1 A156T, or ACK1 K161Q and MERTK with anti-Flag Ab. Immunoprecipitated proteins were used in duplicate in vitro for kinase reactions with WASP synthetic peptide and results represented as pmol phosphate transferred. BRK (right) was immunoprecipitated as above from 293T cells co-transfected with Flag-tagged BRK WT or mutants and MERTK with anti-Flag Ab. Kinase reactions was performed with peptide AEEEIYGEFEAKKKG, and represented as above. P-values were calculated using an Anova test (Tukey’s multiple comparison test) (p > 0.05 (ns); p < 0.05 (*); p < 0.01 (**); p < 0.001 (***); p < 0.0001 (****). (E) Regulation of inflammatory response. Significant normalized enrichment scores (NES) for GO ‘positive regulation of acute inflammation’ gene set, GO ‘negative regulation of inflammatory response’ gene set, and GO ‘AKT_UP.V1_UP’ gene set in WT and mutant macrophages, and WT treated with AIM100 (2 μM) or Cpd4f (0.5 μM), exposed to apoptotic cells, with 3 replicates per experimental condition. Significant enrichment (p-value<0.05 and FDR (q-value) <0.25) are calculated as reported in methods. (F) Table of the top 10 differentially regulated genes by apoptotic cells in WT macrophages are not differentially expressed in mutant macrophages and WT macrophages treated with AIM100 or Cpd4f (treated as in E). Numbers indicate FDR (q-value). Known target genes of STAT3 and AKT are labeled in blue and red respectively (G) TNF mRNA production by WT macrophages treated with AIM100 (2 μM) 4hrs after exposure to apoptotic cells. n=6, from 2 independent experiments. (H,I) TNF and IL1β production by macrophages, as measured by ELISA on media collected from mutant and isogenic WT macrophages (C12.1) incubated with mouse apoptotic thymocytes for 90 min, then stimulated with LPS (1 ng/ml) for 18 h. n≥4, from ≥2 independent experiments. P-values in H were calculated by Wilcoxon matched-pairs signed rank tests for data that is not normally distributed, while p-values in G and I were calculated using an Anova test with Tukey’s correction for multiple comparisons.
Figure 5.
Figure 5.. ACK1 and BRK kinase deficiency alter actin remodeling at the phagocytic cup and modestly decrease engulfment of apoptotic cells in macrophages.
(A) Actin remodeling in macrophages. Schematic and representative images of of F-actin by TIRF microscopy in macrophages of indicated genotype, deposited on PtdSer-coated plates for 20 min. (B) Quantification of actin clearance factor for macrophages of the indicated genotypes. Actin remodeling (actin clearance factor) was calculated as a ratio of F-actin staining intensity at cell border divided by F-actin staining intensity at cell center. The actin clearance factor ratios were normalized to the mean value of WT control. Each replicate indicates actin clearance factor fold change from WT mean in single cells. n>20, from 2 independent experiments. Red lines denote the mean. (C,D) Actin remodeling quantification (as in A,B) and representative TIRF images of WT macrophages (C12.1 line) pretreated with DMSO, AIM100 (2 μM) or Cpd4f (0.5 μM). n>24, from 3 independent experiments. P-values in B-D were obtained using a Mann-Whitney test. (E,F) Uptake of apoptotic cells. (E) Schematic depicts uptake of apoptotic mouse thymocytes treated with Fiz-shFASL and labeled with the pH-sensitive dye pHrodo by iPSC-derived macrophages. Isogenic WT (C12.1 line) and isogenic ACK and BRK point mutant macrophages were incubated with pHrodo-labeled mouse apoptotic thymocytes for 90 minutes and analyzed by flow cytometry. Graph represents mean pHrodo fluorescence Intensity (MFI) fold change calculated by dividing total pHrodo MFI (610/20 nm) of individual samples by the average MFI of isogenic WT macrophages. n≥3, from 3 independent experiments. P-values were obtained using an Anova test with Tukey’s correction for multiple comparisons. (F) Uptake of apoptotic cells as in (E) with WT macrophages (C12.1 line) pretreated with AIM100 (2 μM), R-9b (4 μM), Cpd4f (0.5 μM), or DMSO. n≥8, from ≥4 independent experiments. (G) Uptake of opsonized sheep red blood cells. WT macrophages (C12.1 line) are pretreated as in (F) and incubated with opsonized pHrodo sheep red blood cells for 90 min. Graphs represent mean fluorescence Intensity (MFI) fold change calculated by dividing total pHrodo MFI (610/20 nm) of individual samples by the average MFI of WT macrophages. n≥2, from 2 independent experiments. P-values are obtained using an Anova test with Tukey’s correction for multiple comparisons. (H) Schematic representation of ACK1 and BRK proposed function in efferocytosis.

References

    1. Dall’Era M. in Current Rheumatology Diagnosis and Treatment. 3rd ed. (eds Imboden J.B., Hellman D.B., & Stone J.H.) (McGraw-Hill, 2013).
    1. Petri M. et al. Derivation and validation of the Systemic Lupus International Collaborating Clinics classification criteria for systemic lupus erythematosus. Arthritis Rheum 64, 2677–2686, doi:10.1002/art.34473 (2012). - DOI - PMC - PubMed
    1. Rees F., Doherty M., Grainge M. J., Lanyon P. & Zhang W. The worldwide incidence and prevalence of systemic lupus erythematosusa systematic review of epidemiological studies. Rheumatology 56, 1945–1961, doi:10.1093/rheumatology/kex260 (2017). - DOI - PubMed
    1. Johnson A. E., Gordon C., Palmer R. G. & Bacon P. A. The prevalence and incidence of systemic lupus erythematosus in Birmingham, England. Relationship to ethnicity and country of birth. Arthritis Rheum 38, 551–558, doi:10.1002/art.1780380415 (1995). - DOI - PubMed
    1. Feldman C. H. et al. Epidemiology and sociodemographics of systemic lupus erythematosus and lupus nephritis among US adults with Medicaid coverage, 2000–2004. Arthritis Rheum 65, 753–763, doi:10.1002/art.37795 (2013). - DOI - PMC - PubMed

Publication types