[Preprint]. 2024 Jun 6:rs.3.rs-4362092.
doi: 10.21203/rs.3.rs-4362092/v1.

Targeting of SUMOylation leads to cBAF complex stabilization and disruption of the SS18::SSX transcriptome in Synovial Sarcoma

Affiliations

Targeting of SUMOylation leads to cBAF complex stabilization and disruption of the SS18::SSX transcriptome in Synovial Sarcoma

Konstantinos V Floros et al. Res Sq. .

Update in

  • Targeting SUMOylation promotes cBAF complex stabilization and disruption of the SS18::SSX transcriptome in synovial sarcoma.
    Floros KV, Fairchild CK Jr, Li J, Zhang K, Roberts JL, Kurupi R, Paudel D, Xing Y, Hu B, Kraskauskiene V, Hosseini N, Shen S, Inge MM, Smith-Fry K, Li L, Sotiriou A, Dalton KM, Jose A, Abdelfadiel EI, Hill RD, Slaughter JM, Shende M, Lorenz MR, Tanaka N, Kajino T, Nelson ML, Hinojosa MR, Kehinde VA, Belvin BR, Sugiokto FG, Lai Z, Dimopoulos AC, Boikos SA, Stamatouli AM, Lewis JP, Manjili MH, Ebi H, Valerie K, Li R, Poklepovic A, Koblinski JE, Siggers T, Banito A, Dozmorov MG, Jones KB, Radhakrishnan SK, Faber AC. Floros KV, et al. Nat Commun. 2025 Nov 5;16(1):9761. doi: 10.1038/s41467-025-64665-8. Nat Commun. 2025. PMID: 41193430 Free PMC article.

Abstract

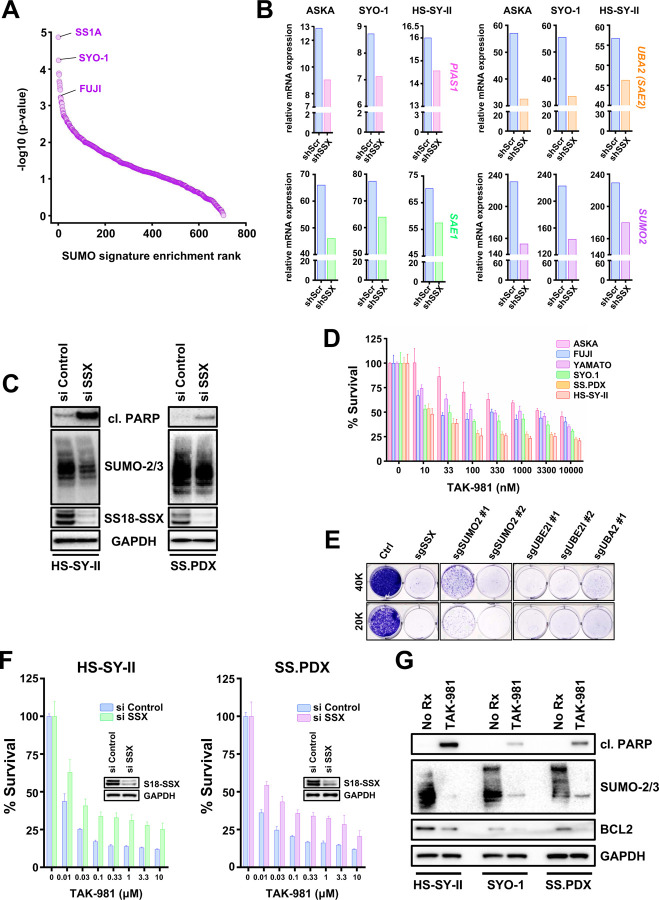
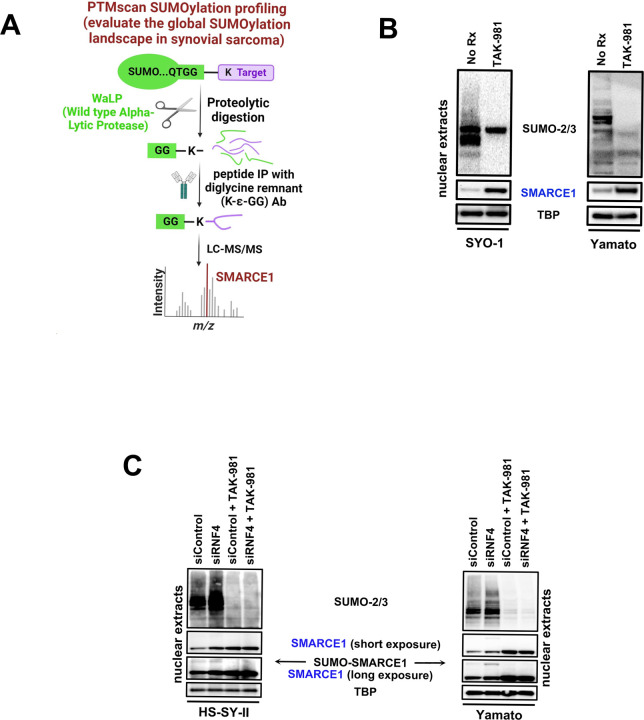
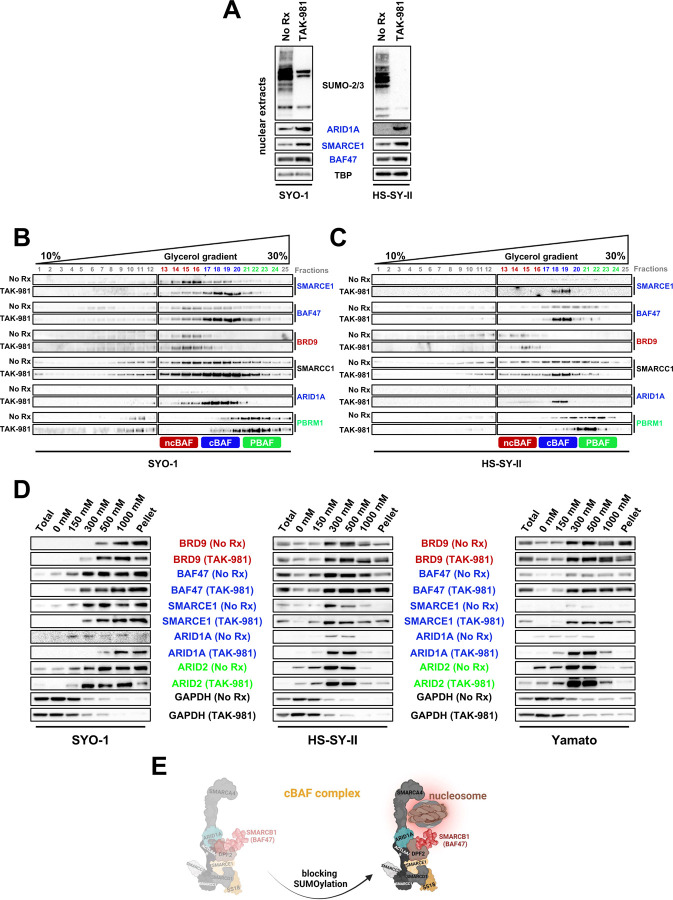
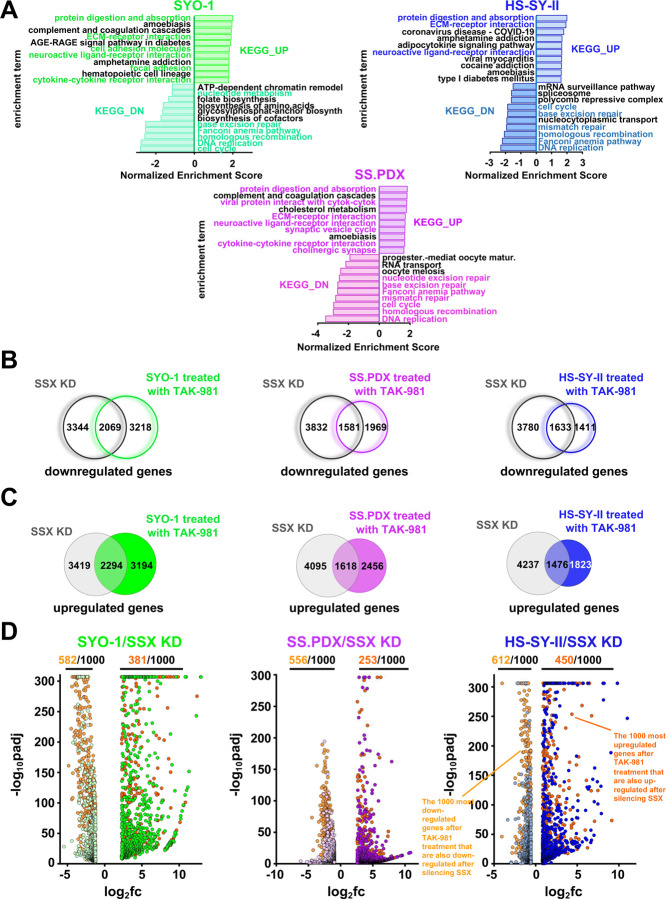
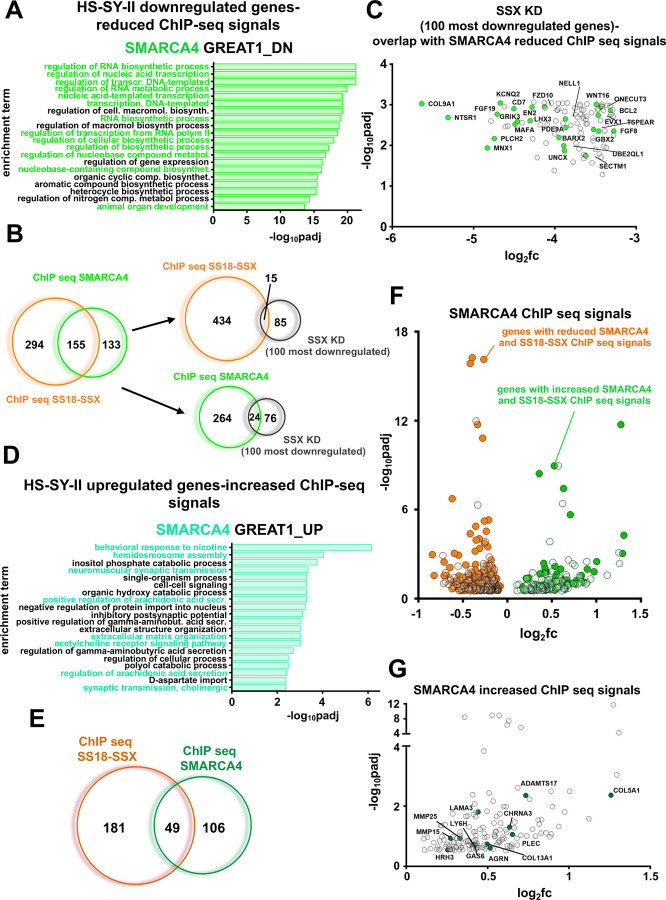
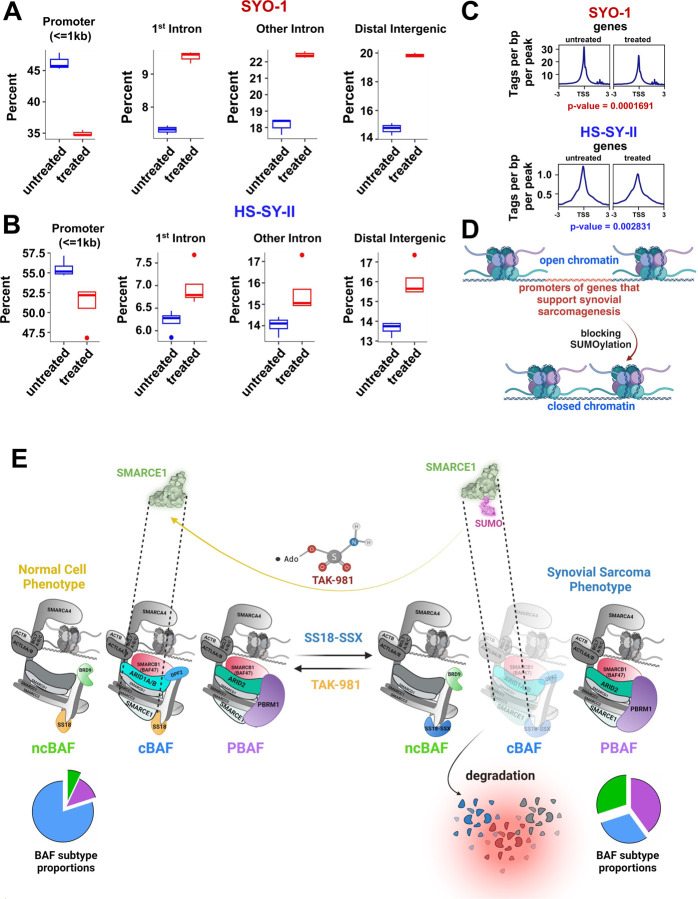
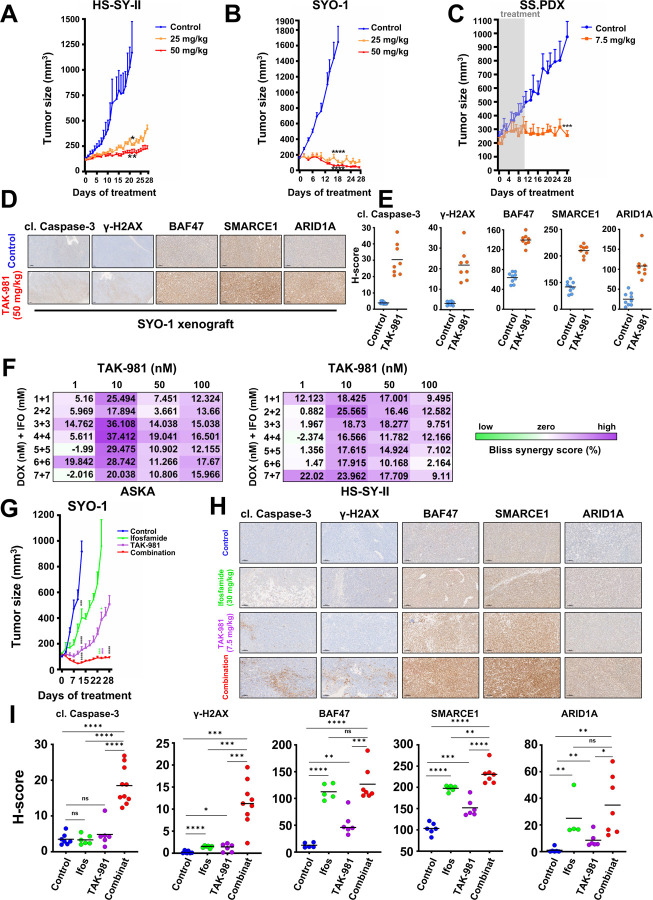
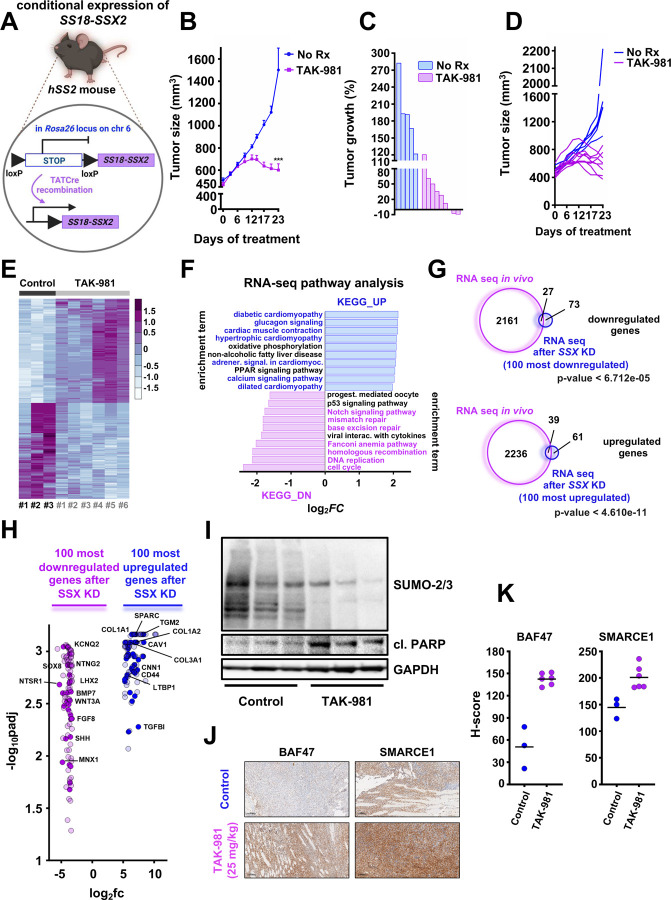
Synovial Sarcoma (SS) is driven by the SS18::SSX fusion oncoprotein and is ultimately refractory to therapeutic approaches. SS18::SSX alters ATP-dependent chromatin remodeling BAF (mammalian SWI/SNF) complexes, leading to the degradation of canonical (cBAF) complex and amplified presence of an SS18::SSX-containing non-canonical BAF (ncBAF or GBAF) that drives an SS-specific transcription program and tumorigenesis. We demonstrate that SS18::SSX activates the SUMOylation program and SSs are sensitive to the small molecule SAE1/2 inhibitor, TAK-981. Mechanistically, TAK-981 de-SUMOylates the cBAF subunit SMARCE1, stabilizing and restoring cBAF on chromatin, shifting away from SS18::SSX-ncBAF-driven transcription, associated with DNA damage and cell death and resulting in tumor inhibition across both human and mouse SS tumor models. TAK-981 synergized with cytotoxic chemotherapy through increased DNA damage, leading to tumor regression. Targeting the SUMOylation pathway in SS restores cBAF complexes and blocks the SS18::SSX-ncBAF transcriptome, identifying a therapeutic vulnerability in SS, positioning the in-clinic TAK-981 to treat SS.

Keywords: BAF complexes; DNA damage; SUMOylation; SWI/SNF; TAK-981; synovial sarcoma; targeted therapy.


Conflict of interest statement

Additional Declarations: There is NO Competing Interest. DECLARATION OF INTERESTS A.C.F. is a consultant and equity holder in Treeline Biosciences and has previously served as a scientific advisor for AbbVie and has received research funding from IDP Pharma. K.V. receives support from AstraZeneca. R.L. is an inventor of a provisional patent on targeted killing of EBV-positive cancer cells by CRISPR/dCas9-mediated EBV reactivation. S.B. is Consultant for Caris Lifescience and has received honoraria from SpringWorks for an educational lecture. K.V. receives support from AstraZeneca with no relationship to the present study. The authors declare that these listed activities have no relationship to the present study.

Figures

Figure 1.
Figure 1.
A) Cell lines ranked by enrichment (−log10(p-value)) in the SUMO signature (BIOCARTA_SUMO_PATHWAY) using single-sample GSEA on cell line-specific genes ordered by the gene dependency scores (DEMETER2 scores from DepMap). B) RNA levels of genes involved in SUMOylation following shSSX knockdown were obtained from a RNA seq analysis performed in SS cell lines C) SS cells were transfected with si SSX for 18h and whole cell lysates (supplemented with 0.5M of N-ethylmaleimide (NEM)) were probed with the indicated antibodies. D) SS cells were treated with increasing concentrations of the SUMOylation inhibitor, TAK-981, and cell viability was assessed 72h later using cell-titer glo. Student’s t tests were performed for comparisons between each TAK-981 treatment and No Rx for each cell line. Differences were considered statistically different if p < 0.05. For all calculated p-values: * p < 0.05, ** p < 0.01, *** p < 0.001, **** p < 0.0001. E) HS-SY-II cells underwent CRISPR/Cas9-mediated gene targeting of the indicated SUMOylation genes and cells were counted and plated at low density (20.000 or 40.000 cell per 6 -well plate) and stained with crystal violet 12 days later. F) SS cells were transfected with siRNA directed against SSX for 36h, reseeded, and treated with increasing concentrations of TAK-981 for 72h before cell viability was assessed (inset is immunoblotting confirming knockdown). G) SS cells were treated with 100nM TAK-981 for 36h or left untreated (No Rx) and whole cell lysates (supplemented with 0.5M of N-ethylmaleimide (NEM)) were probed with the indicated antibodies.
Figure 2.
Figure 2.
A) Illustration depicting the method followed for the Proteome-wide identification of SUMO modification sites by mass spectrometry (PTMscan SUMOylation profiling) of the HS-SY-II cells treated either with a) No Rx or b) 100 nM of TAK-981 for 36h prior to analysis. B) SS cells were treated with 100nM TAK-981 for 36h or left untreated (No Rx) and nuclear lysates (supplemented with 0.5M of N-ethylmaleimide (NEM)) were probed with the indicated antibodies. C) and D) SS cells transfected with scramble (sc) siRNA or siRNA directed against siRNF4 were treated with 100nM TAK-981 for 36h or left untreated (No Rx) and nuclear lysates (supplemented with 0.5M of N-ethylmaleimide (NEM)) were probed with the indicated antibodies. TBP was used as a nuclear loading control.
Figure 3.
Figure 3.
A) SS cells were treated with 100nM TAK-981 for 36h or left untreated (No Rx) and nuclear lysates (supplemented with 0.5M of N-ethylmaleimide (NEM)) were probed with the indicated antibodies. TBP was used as a nuclear loading control. B) and C) SYO-1 and HS-SY-II cells were pretreated with no drug or 100 nM of TAK-981 for 36h. Density sedimentation assay (10%–30% glycerol gradient) followed by immunoblotting the indicated BAF family components was performed on nuclear extracts. D) Immunoblot of SS cells for specific BAF components was performed following treatment with no drug and 100 nM of TAK-981 for 36h and differential salt extraction (0–1,000 mM NaCl). GAPDH was used as a cytoplasmic loading control. E) Illustration depicting the changes in chromatin affinity for the cBAF complex after TAK-981 treatment.
Figure 4.
Figure 4.
A) Normalized enrichment scores after KEGG analysis of RNA-seq data demonstrating pathways altered by 100nM TAK-981 treatment for 36h in the indicated SS cells. B) Venn diagram of genes significantly downregulated following SS18-SSX knockdown or treatment with 100nM TAK-981 for 36h. C) Venn diagram of genes significantly upregulated following SS18-SSX knockdown or treatment with 100nM TAK-981 for 36h. D) Volcano plots of the most down- or upregulated 1000 genes following SS18-SSX knockdown plotted with the common downregulated genes (orange dots) or common upregulated genes (red dots) by RNA seq, among the indicated SS cell line.
Figure 5.
Figure 5.
A) Gene ontology analysis of genes associated with significantly reduced SMARCA4 ChIP-seq signals after TAK-981 treatment in HS-SY-II cells. B) Venn diagrams of the overlap in significantly downregulated genes among the different noted experiments. C) Overlap of 100 most significantly downregulated genes following SS18-SSX knockdown with significantly reduced SMARCA4 ChIP seq signals. D) Gene ontology analysis of genes associated with significantly upregulated SMARCA4 ChIP-seq signals after TAK-981 treatment in HS-SY-II cells. E) Venn diagram of the overlap in significantly upregulated genes among the different noted experiments. F) Overlap of the genes with both reduced SMARCA4 ChIP-seq signals and SS18-SSX ChIP-seq signals (orange dots), and genes with both increased SMARCA4 ChIP-seq signals and SS18-SSX ChIP-seq signals (green dots). G) Genes related to the mesenchymal phenotype associated with increased SMARC4A ChIP-seq signals (green dots).
Figure 6.
Figure 6.
(A and B) Boxplots demonstrating distribution of SYO-1 and HS-SY-II Atac seq peaks genome-wide, focusing on downregulated RNA-Seq normalized genes for HS-SY-II transduced with SS18-SSX shRNA ((filtered for DEGs with log2 (fold change) > +1). C) SYO-1 and HS-SY-II Atac seq profiles for downregulated RNA-Seq normalized genes of HS-SY-II cells transduced with SS18-SSX shRNA (the same list of downregulated genes used in Figure 6A and 6B), centered on TSS (transcription starting sites). D) Schema of changes at the chromatin following TAK-981 treatment in SS. E) Model of TAK-981 efficacy. TAK-981 deSUMOylates SMARCE1, leading to loss of RNF4-mediated degradation. SMARCE1 stabilization leads to cBAF complex stabilization at chromatin, and relative loss of ncBAF at chromatin. The result is inhibition of the SS18-SSX-ncBAF-driven transcriptome.
Figure 7.
Figure 7.
A) HS-SY-II tumor-bearing NSG mice were treated with 25mg/kg or 50mg/kg TAK-981 three consecutive days a week (Tuesday-Thursday) or control (no treatment) and tumors were monitored by caliper at least 3/w (n=6 for control, 5 for 25 mg/kg and 6 for 50 mg/kg). B) SYO-1 tumor-bearing NSG mice were treated with 25mg/kg or 50mg/kg TAK-981 3/w or control (no treatment) and tumors were monitored by caliper at least 3/w (n=8 for control, 8 for 25 mg/kg and 9 for 50 mg/kg). C) SS.PDX tumor-bearing NSG mice were treated with 7.5mg/kg TAK-981 or control three consecutive days a week (Tuesday-Thursday) the first and second week of the experiment. The drug administration was paused after the second round of treatment (day 10) and the mice were monitored for tumor growth for a total period of 28 days (n=6 for control, 5 for 7.5 mg/kg). For A-C, Student’s t tests were performed for comparisons between TAK-981 treatment and control (no treatment) for the indicated time points. Differences were considered statistically different if p < 0.05. For all calculated p-values: * p < 0.05, ** p < 0.01, *** p < 0.001, **** p < 0.0001. D) Representative images of IHC analysis of the indicated antibodies in SYO-1 tumors from experiment shown in (B). Scale bars = 100 μm. E) H-scores of staining from (D). F) Bliss Sum synergy scores were obtained following treatment with the indicated drugs at the indicated concentrations. G) SYO-1 tumor-bearing NSG mice were treated with TAK-981 via tail vein injection at a dosage of 7.5 mg/kg, three consecutive days a week (Tuesday-Thursday) for four weeks (28 days) and ifosfamide via intraperitoneal injection at a dosage of 30 mg/kg, for three consecutive days a week (Tuesday-Thursday) the first and fourth week of the experiment. Tumor measurements were performed every other day by calipers, and the average tumor volume + SEM for each cohort is displayed (n=7 for control, 9 for ifosfamide, 8 for TAK-981 and 8 for combination treatment). Student’s t tests were performed for comparisons between control and each of the treatments (ifosfamide, TAK-981, combination - black asterisks, for the 13th day of treatment). The comparisons to ifosfamide are depicted with green asterisks and the comparisons to TAK-981 are depicted with purple asterisks, for the 24th day of treatment. Differences were considered statistically different if p < 0.05. For all calculated p-values: * p < 0.05, ** p < 0.01, *** p < 0.001, **** p < 0.0001.H) Representative images of IHC analysis of the indicated antibodies in SYO-1 tumors from the experiment shown in (G). Scale bars = 100 μm. I) H-scores of staining from (H). Student’s t tests were performed for all the comparisons. Differences were considered statistically different if p < 0.05. For all calculated p-values: * p < 0.05, ** p < 0.01, *** p < 0.001, **** p < 0.0001.
Figure 8.
Figure 8.
A) Schema of the design of the mouse experiment. B) hSS2 mice were treated with 25mg/kg 3/w or vehicle (control) and tumors were monitored by caliper at least 3/w (n=5 for control and n=9 for the TAK-981 treatment cohort). Student’s t tests were performed. Differences were considered statistically different if p < 0.05. For all calculated p-values: * p < 0.05, ** p < 0.01, *** p < 0.001, **** p < 0.0001. C) Waterfall plot of data from (B). D) Individual tumor growth from the experiment shown in (B and C). E) Heatmap of the RNA expression profiles of the 1000 most differentiated genes following TAK-981 treatment, after RNA seq analysis in the indicated hSS2 tumors (n=3 for control and n=6 for TAK-981 treatment). F) Pathway analysis of RNA-seq data from hSS2 tumors. G) Venn diagrams of significant gene changes caused by TAK-981 in hSS2 mice and the 100 most up- or down-regulated genes in vitro following SS18-SSX knockdown in HS-SY-II cells. H) Volcano plot of the 100 most down- or upregulated genes following SS18-SSX knockdown in vitro plotted with the common downregulated genes (purple dots) or common upregulated genes (blue dots) after RNA seq in the hSS2 tumors. I) Representative tumors from the control and TAK-981 treated cohort were harvested 2–3h after the last TAK-981 administration and tumor lysates (supplemented with 0.5M of N-ethylmaleimide (NEM)) were subjected to western blot analyses and probed for the indicated proteins. J) Representative images of IHC analysis of the indicated antibodies in the tumors from the experiment shown in (B). Scale bars = 100 μm. K) H-scores of staining from (J).

References

    1. Alkhatib M.H., AlMotwaa S.M., and Alkreathy H.M. (2019). Incorporation of ifosfamide into various essential oils -based nanoemulsions ameliorates its apoptotic effect in the cancers cells. Sci Rep 9, 695. 10.1038/s41598-018-37048-x. - DOI - PMC - PubMed
    1. Banito A., Li X., Laporte A.N., Roe J.S., Sanchez-Vega F., Huang C.H., Dancsok A.R., Hatzi K., Chen C.C., Tschaharganeh D.F., et al. (2018). The SS18-SSX Oncoprotein Hijacks KDM2B-PRC1.1 to Drive Synovial Sarcoma. Cancer Cell 33, 527–541 e528. 10.1016/j.ccell.2018.01.018. - DOI - PMC - PubMed
    1. Barrott J.J., Zhu J.F., Smith-Fry K., Susko A.M., Nollner D., Burrell L.D., Pozner A., Capecchi M.R., Yap J.T., Cannon-Albright L.A., et al. (2017). The Influential Role of BCL2 Family Members in Synovial Sarcomagenesis. Mol Cancer Res 15, 1733–1740. 10.1158/1541-7786.Mcr-17-0315. - DOI - PMC - PubMed
    1. Benjamin R.S., Legha S.S., Patel S.R., and Nicaise C. (1993). Single-agent ifosfamide studies in sarcomas of soft tissue and bone: the M.D. Anderson experience. Cancer Chemother Pharmacol 31 Suppl 2, S174–179. - PubMed
    1. Blay J.Y., von Mehren M., Jones R.L., Martin-Broto J., Stacchiotti S., Bauer S., Gelderblom H., Orbach D., Hindi N., Dei Tos A., and Nathenson M. (2023). Synovial sarcoma: characteristics, challenges, and evolving therapeutic strategies. ESMO Open 8, 101618. 10.1016/j.esmoop.2023.101618. - DOI - PMC - PubMed

Publication types

LinkOut - more resources