. 2024 Mar 29;27(6):109625.
doi: 10.1016/j.isci.2024.109625. eCollection 2024 Jun 21.

Organic phosphate but not inorganic phosphate regulates Fgf23 expression through MAPK and TGF-ꞵ signaling

Affiliations

Organic phosphate but not inorganic phosphate regulates Fgf23 expression through MAPK and TGF-ꞵ signaling

Danielle M A Ratsma et al. iScience. .

Abstract

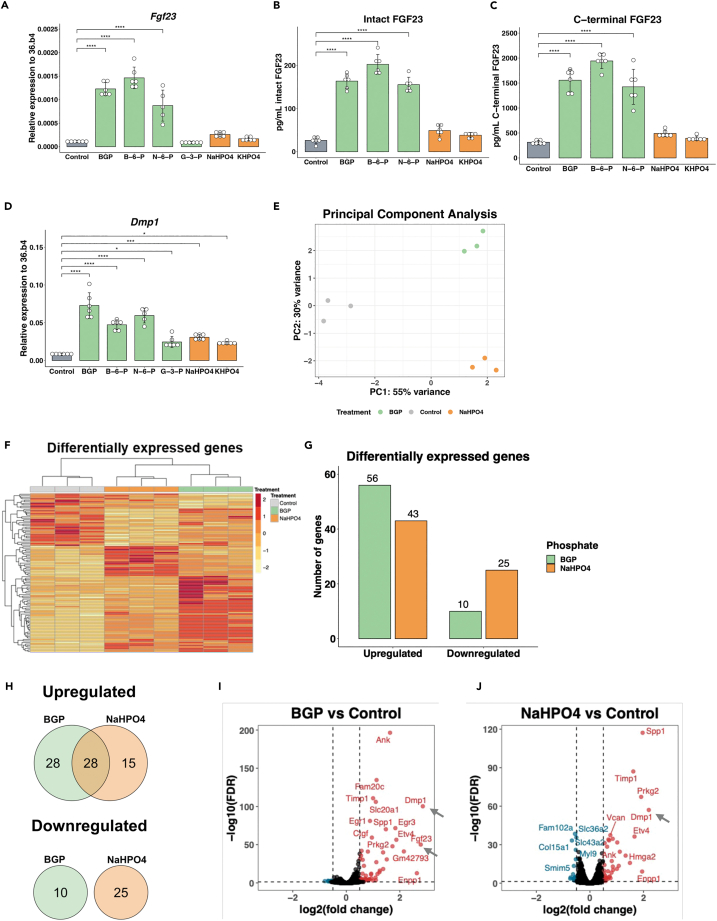
One of the main regulators of phosphate homeostasis is fibroblast growth factor 23 (FGF23), secreted by osteocytes. The effects of organic versus inorganic dietary phosphate on this homeostasis are unclear. This study used MC3T3-E1 FGF23-producing cells to examine the transcriptomic responses to these phosphates. Most importantly, the expression and secretion of FGF23 were only increased in response to organic phosphate. Gene ontology terms related to a response to environmental change were only enriched in cells treated with organic phosphate while cells treated with inorganic phosphate were enriched for terms associated with regulation of cellular phosphate metabolism. Inhibition of MAPK signaling diminished the response of Fgf23 to organic phosphate, suggesting it activates FGF23. TGF-β signaling inhibition increased Fgf23 expression after the addition of organic phosphate, while the negative TGF-β regulator Skil decreased this response. In summary, the observed differential response of FGF23-producing to phosphate types may have consequences for phosphate homeostasis.

Keywords: Transcriptomics; cell biology; molecular biology.


Conflict of interest statement

The authors declare no competing interests.

Figures

None
Graphical abstract
Figure 1
Figure 1
Overview of the experimental set-up Different phosphates. MC3T3-E1 cells were treated with different types of organic (green) and inorganic (phosphates) at day 27 for 24 h, after which a qPCR for Fgf23 and Dmp1 was performed. RNA sequencing. BGP (organic) and NaHPO4 (inorganic) were used for RNA sequencing after phosphate treatment at day 27. Comparison. Gene signatures of BGP and NaHPO4 were compared to find uniquely regulated genes and pathways by each type of phosphate. FGF23 regulation. Compounds were used to study whether found regulated genes were involved in the regulation of FGF23. Created with BioRender.com.
Figure 2
Figure 2
Only organic phosphate regulates FGF23 (A) Expression of Fgf23 by organic and inorganic phosphate in which the gray bar represents the control, green bars represent organic phosphate, and orange bars represent inorganic phosphate. (B and C) Secretion of (B) C-terminal and (C) intact FGF23 after treatment with organic and inorganic phosphate in which the gray bar represents the control, green bars represent organic phosphate, and orange bars represent inorganic phosphate. (D) Expression of Dmp1 by organic and inorganic phosphate in which the gray bar represents the control, green bars represent organic phosphate, and orange bars represent inorganic phosphate. (E) PCA plot for the following treatments: Control (gray), 4 mM BGP (green), and 4 mM NaHPO4 (orange). (F) Heatmap based on differentially expressed genes (DEGs) for the following treatments: Control (gray), 4 mM BGP (green), and 4 mM NaHPO4 (orange). (G) Total DEGs for BGP (green) and NaHPO4 (orange). (H) Venn diagrams for shared and unique DEGs by BGP (green) and NaHPO4 (orange). (I) Volcano plot DEGs by BGP treatment in which blue dots represent downregulated genes and red dots represent upregulated genes. (J) Volcano plot for DEGs regulated by NaHPO4 in which blue dots represent downregulated genes and red dots represent upregulated genes. Gene expression was normalized to housekeeping gene 36.b4. Error bars indicate ±SEM. Significance was indicated as following: ∗p < 0.05, ∗∗∗p < 0.001, ∗∗∗∗p < 0.0001. Abbreviations: BGP: β-glycerophosphate, B-6-P: β-glucosamine-6-phosphate, N-6-P: N-acetyl-D-galactosamine-6 phosphate, NaHPO4: Na2HPO4/NaH2PO4, KHPO4: K2HPO4/KH2PO4.
Figure 3
Figure 3
BGP and NaHPO4 regulate unique pathways and processes (A) Results from gene ontology (GO) analysis comparing the top 15 most significantly enriched biological processes for treatment with 4 mM BGP and 4 mM NaHPO4 in which the color represents the false discovery rate (FDR). (B) Volcano plot DEGs by BGP treatment versus control in which blue dots represent downregulated genes and red dots represent upregulated genes. (C) Venn diagrams of genes that are regulated in both BGP versus control (purple) and BGP versus NaHPO4 (blue) conditions. (D) Heatmap of genes regulated uniquely by BGP tested on different phosphates by qPCR, color represents the log2 fold change (Log2FC) after treatment with 4 mM of the indicated phosphate. Gene expression was normalized to housekeeping gene 36.b4. Error bars indicate ±SEM. Significance was indicated as following: ∗p < 0.05, ∗∗p < 0.01, ∗∗∗p < 0.001, ∗∗∗∗p < 0.0001. Abbreviations: BGP: β-glycerophosphate, B-6-P: β-glucosamine-6-phosphate, N-6-P: N-acetyl-D-galactosamine-6 phosphate, NaHPO4: Na2HPO4/NaH2PO4, KHPO4: K2HPO4/KH2PO4.
Figure 4
Figure 4
Regulation of FGF23 by different phosphate through MAPK and TFG-β signaling (A and B) Expression of (A) Fgf23 and (B) Dmp1 after treatment with 4 mM BGP, 10 μM MEK inhibitor U0126, HES1 inhibitor 15 μM perhexiline, proteasome inhibitor 1 μM MG132, or a combination. (C and D) Expression of (C) Fgf23 and (D) Dmp1 after treatment with 4 mM BGP, TGF-β inhibitors: 5 μM LY364947, 10 μM SM16 or 10 μM IN130, or a combination. (E–G) Expression of (E) Fgf23, (F) Dmp1 and (G) Skil after addition of 10ng/mL TFG-β for 3, 6 or 24 h. (H and I) Expression of (H) Skil and (I) Fgf23 after addition of 4 mM NaHPO4 for 3, 6 or 24 h. Gene expression was normalized to housekeeping gene 36.b4. Error bars indicate ±SEM. Significance was indicated as following: ∗∗p < 0.01, ∗∗∗p < 0.001, ∗∗∗∗p < 0.0001.

References

    1. Cooke A. Dietary food-additive phosphate and human health outcomes. Compr. Rev. Food Sci. Food Saf. 2017;16:906–1021. - PubMed
    1. Ritz E., Hahn K., Ketteler M., Kuhlmann M.K., Mann J. Phosphate additives in food—a health risk. Dtsch. Arztebl. Int. 2012;109:49–55. - PMC - PubMed
    1. Sullivan C.M., Leon J.B., Sehgal A.R. Phosphorus-containing food additives and the accuracy of nutrient databases: implications for renal patients. J. Ren. Nutr. 2007;17:350–354. - PMC - PubMed
    1. Erem S., Razzaque M.S. Dietary phosphate toxicity: an emerging global health concern. Histochem. Cell Biol. 2018;150:711–719. - PubMed
    1. Cupisti A., Kalantar-Zadeh K. Elsevier; 2013. Management of Natural and Added Dietary Phosphorus Burden in Kidney Disease; pp. 180–190. - PMC - PubMed