

What Are the Reliable Plasma Biomarkers for Mild Cognitive Impairment? A Clinical 4D Proteomics Study and Validation
- PMID: 38883967
- PMCID: PMC11178428
- DOI: 10.1155/2024/7709277
What Are the Reliable Plasma Biomarkers for Mild Cognitive Impairment? A Clinical 4D Proteomics Study and Validation
Abstract
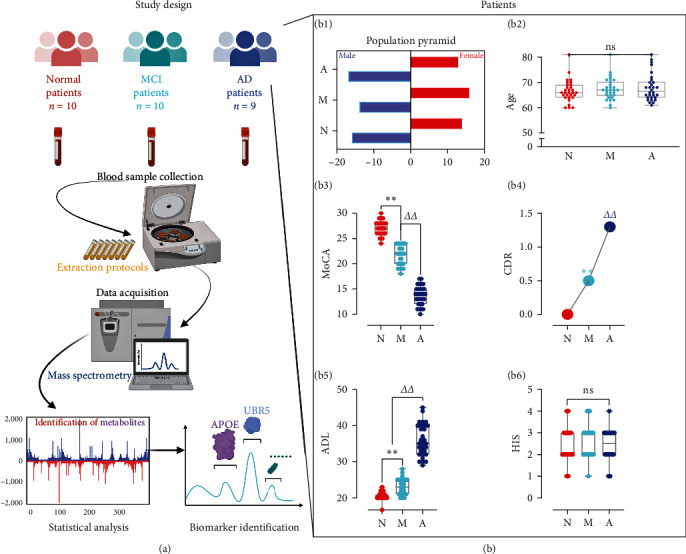
Objective: At present, Alzheimer's disease (AD) lacks effective treatment means, and early diagnosis and intervention are the keys to treatment. Therefore, for mild cognitive impairment (MCI) and AD patients, blood sample analysis using the 4D nonstandard (label-free) proteomic in-depth quantitative analysis, looking for specific protein marker expression differences, is important. These marker levels change as AD progresses, and the analysis of these biomarkers changes with this method, which has the potential to show the degree of disease progression and can be used for the diagnosis and preventive treatment of MCI and AD.
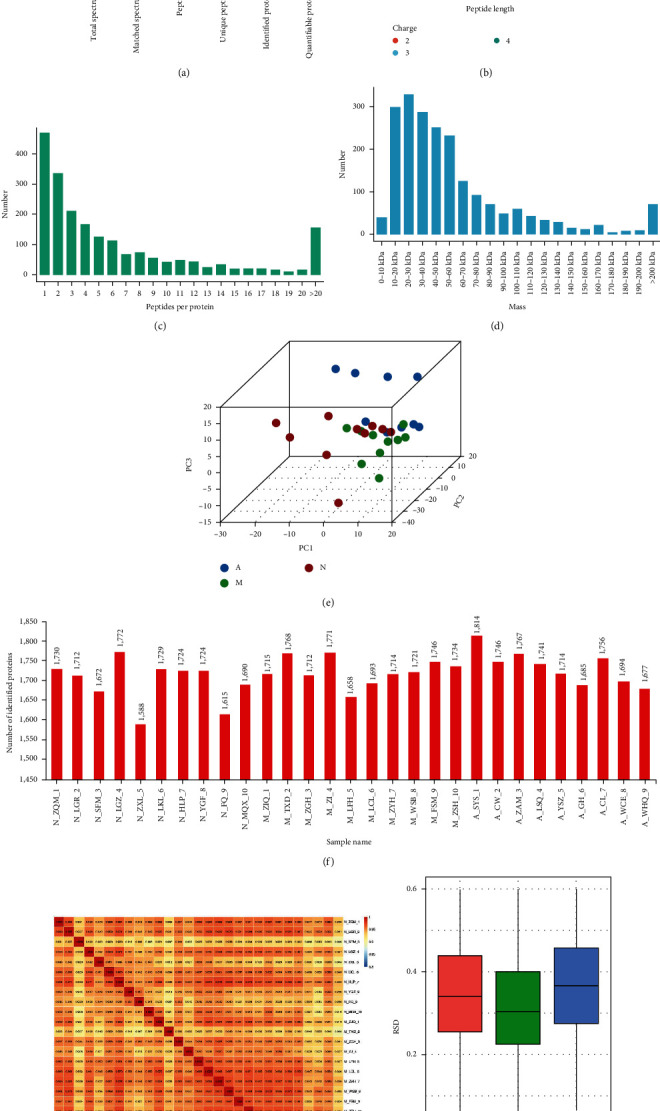
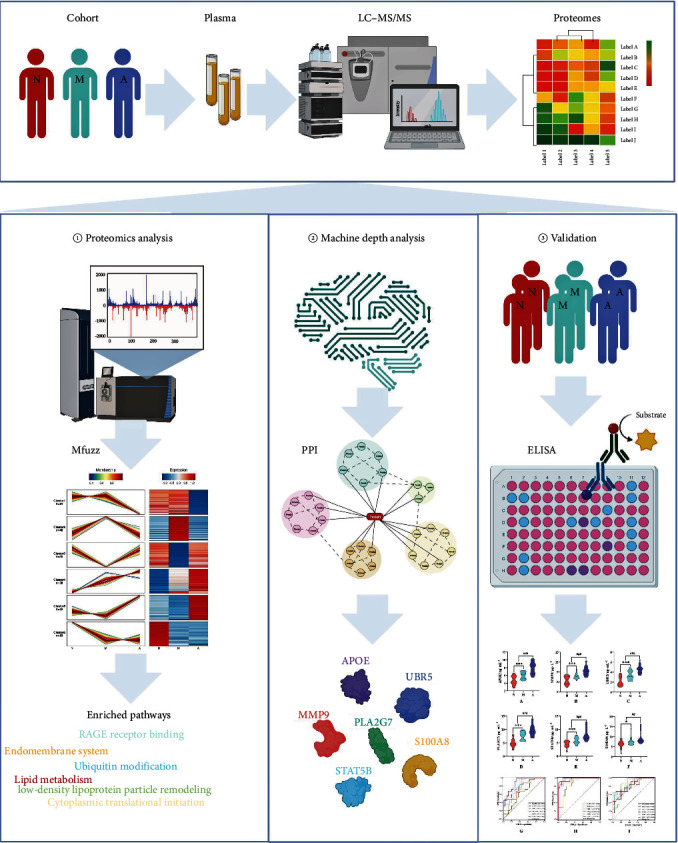
Materials and methods: Patients were recruited according to the inclusion and exclusion criteria and divided into three groups according to scale scores. Elderly patients diagnosed with AD were selected as the AD group (n = 9). Patients diagnosed with MCI were classified into the MCI group (n = 10). Cognitively healthy elderly patients were included in the normal cognition control group (n = 10). Patients' blood samples were used for 4D label-free proteomic in-depth quantitative analysis to identify potential blood biomarkers. The sample size of each group was expanded (n = 30), and the selected biomarkers were verified by enzyme-linked immunosorbent assay (ELISA) to verify the accuracy of the proteomic prediction.
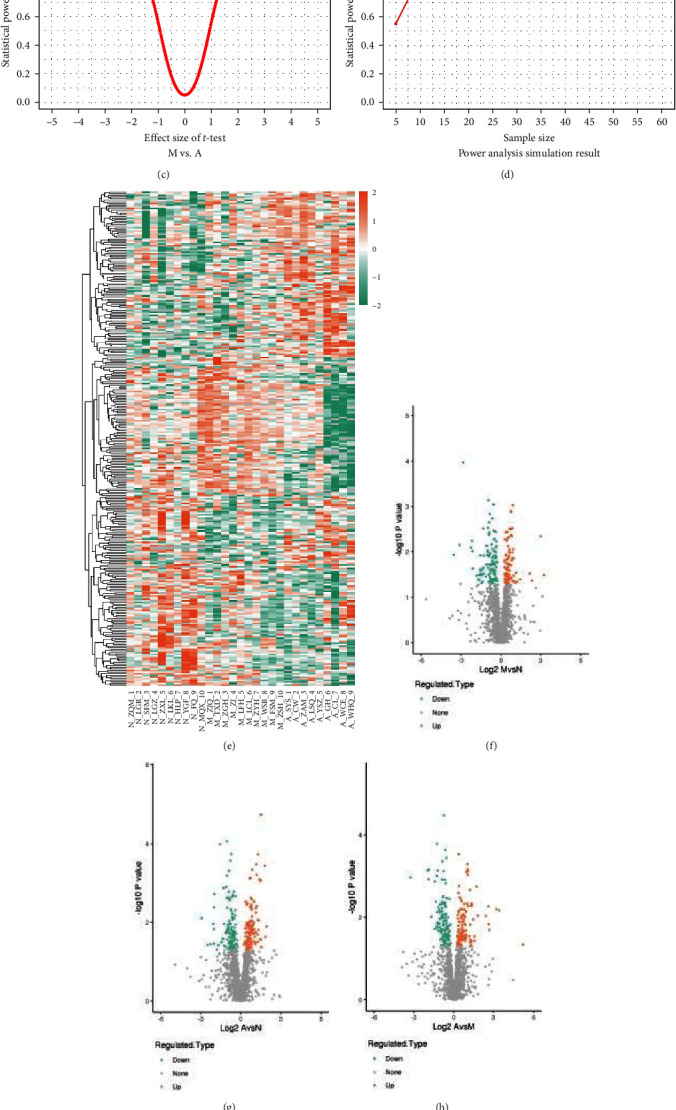
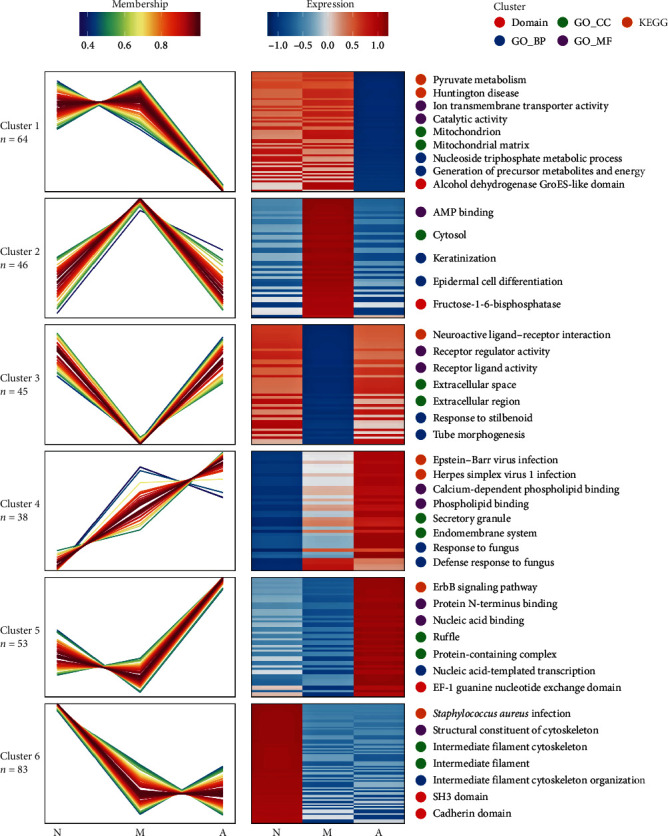
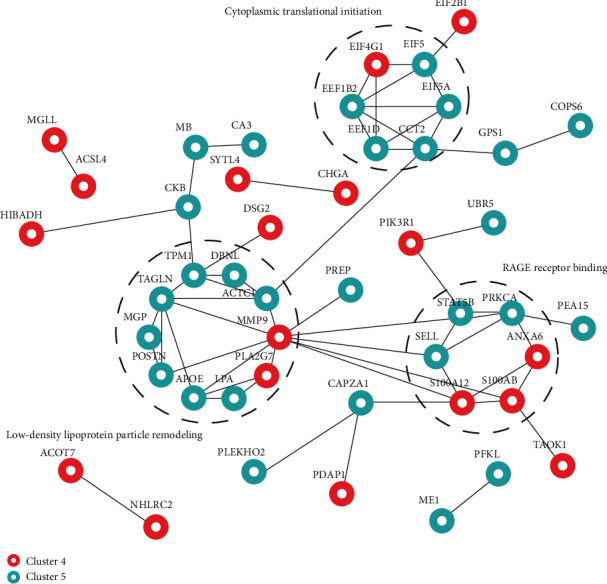
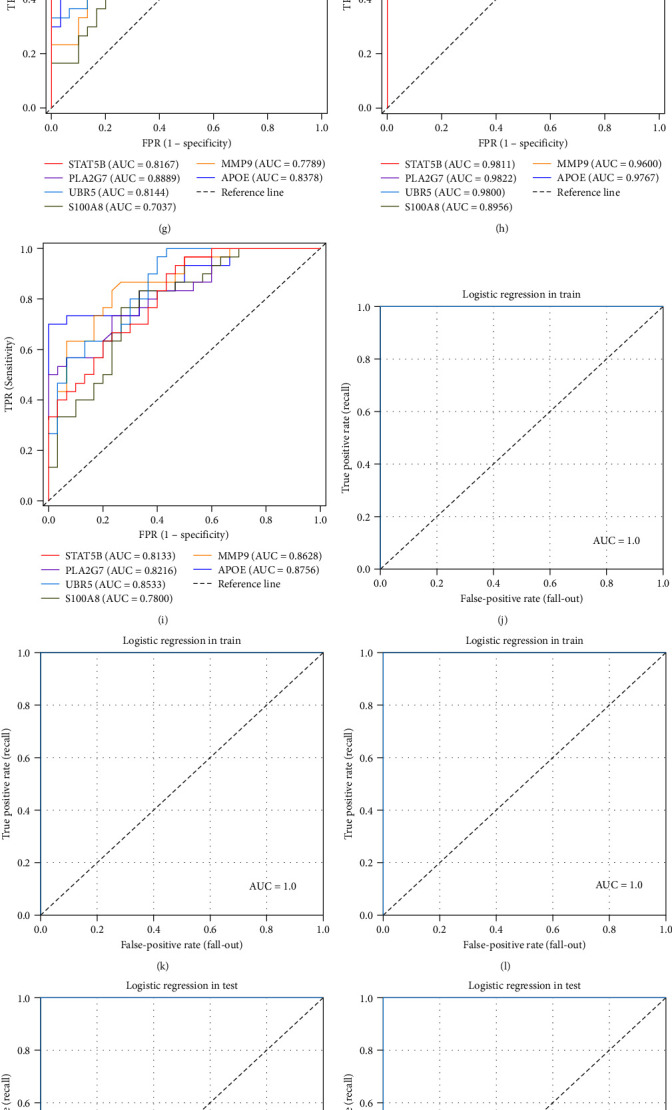
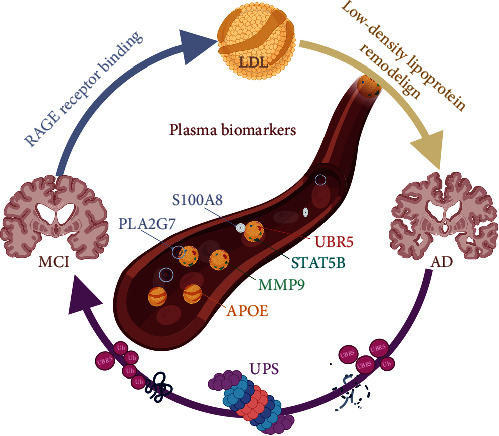
Results: Six specific blood markers, namely, APOE, MMP9, UBR5, PLA2G7, STAT5B, and S100A8, were detected by 4D label-free proteomic quantitative analysis. These markers showed a statistically significant upregulation trend in the MCI and AD groups compared with the normal cognition control group (P < 0.05). ELISA results showed that the levels of these six proteins in the MCI group were significantly higher than those in the normal cognition control group, and the levels of these six proteins in the AD group were significantly higher than those in the MCI group (P < 0.05).
Conclusion: The plasma levels of APOE, MMP9, UBR5, PLA2G7, STAT5B, and S100A8 in cognitively healthy elderly patients and patients with MCI and AD were significantly different and, more importantly, showed a trend of increasing expression. These results indicate that these six human plasma markers have important diagnostic and therapeutic potential in the identification of cognitive impairment and have value for in-depth research and clinical application.
Copyright © 2024 Zhitao Hou et al.
Conflict of interest statement
The authors declare that they have no conflicts of interest.
Figures
Similar articles
-
Biomarkers for Early Diagnostic of Mild Cognitive Impairment in Type-2 Diabetes Patients: A Multicentre, Retrospective, Nested Case-Control Study.EBioMedicine. 2016 Feb 6;5:105-13. doi: 10.1016/j.ebiom.2016.02.014. eCollection 2016 Mar. EBioMedicine. 2016. PMID: 27077117 Free PMC article.
-
Evaluation of plasma proteomic data for Alzheimer disease state classification and for the prediction of progression from mild cognitive impairment to Alzheimer disease.Alzheimer Dis Assoc Disord. 2013 Jul-Sep;27(3):233-43. doi: 10.1097/WAD.0b013e31826d597a. Alzheimer Dis Assoc Disord. 2013. PMID: 23023094
-
Increased Plasma Beta-Secretase 1 May Predict Conversion to Alzheimer's Disease Dementia in Individuals With Mild Cognitive Impairment.Biol Psychiatry. 2018 Mar 1;83(5):447-455. doi: 10.1016/j.biopsych.2017.02.007. Epub 2017 Mar 27. Biol Psychiatry. 2018. PMID: 28359566 Free PMC article.
-
Evaluation of the diagnostic value of peripheral BDNF levels for Alzheimer's disease and mild cognitive impairment: results of a meta-analysis.Int J Neurosci. 2020 Mar;130(3):218-230. doi: 10.1080/00207454.2019.1667794. Epub 2019 Sep 24. Int J Neurosci. 2020. PMID: 31518516 Review.
-
Peripheral Brain-Derived Neurotrophic Factor Levels in Alzheimer's Disease and Mild Cognitive Impairment: a Comprehensive Systematic Review and Meta-analysis.Mol Neurobiol. 2017 Nov;54(9):7297-7311. doi: 10.1007/s12035-016-0192-9. Epub 2016 Nov 4. Mol Neurobiol. 2017. PMID: 27815832
Cited by
-
Mechanism of action and therapeutic potential of S100A8/A9 in neuroinflammation and cognitive impairment: From molecular target to clinical application (Review).Int J Mol Med. 2025 Oct;56(4):147. doi: 10.3892/ijmm.2025.5588. Epub 2025 Jul 19. Int J Mol Med. 2025. PMID: 40682852 Free PMC article. Review.
-
Oligodendrocyte-Specific STAT5B Overexpression Ameliorates Myelin Impairment in Experimental Models of Parkinson's Disease.Cells. 2025 Jul 25;14(15):1145. doi: 10.3390/cells14151145. Cells. 2025. PMID: 40801579 Free PMC article.
-
An exploratory study on the metagenomic and proteomic characterization of hypothyroidism in the first half of pregnancy and correlation with Th1/Th2 balance.Front Immunol. 2025 May 15;16:1500866. doi: 10.3389/fimmu.2025.1500866. eCollection 2025. Front Immunol. 2025. PMID: 40443669 Free PMC article.
-
Plasma senescence associated secretory proteins: A new link to mild cognitive impairment.J Nutr Health Aging. 2025 May;29(5):100561. doi: 10.1016/j.jnha.2025.100561. Epub 2025 Apr 24. J Nutr Health Aging. 2025. PMID: 40279862 Free PMC article. No abstract available.
References
-
- Anderson T. S., Ayanian J. Z., Souza J., Landon B. E. Representativeness of participants eligible to be enrolled in clinical trials of aducanumab for alzheimer disease compared with medicare beneficiaries with alzheimer disease and mild cognitive impairment. JAMA . 2021;326(16):1627–1629. doi: 10.1001/jama.2021.15286. - DOI - PMC - PubMed
-
- Hemmy L. S., Linskens E. J., Silverman P. C., et al. Brief cognitive tests for distinguishing clinical alzheimer-type dementia from mild cognitive impairment or normal cognition in older adults with suspected cognitive impairment. Annals of Internal Medicine . 2020;172(10):678–687. doi: 10.7326/M19-3889. - DOI - PubMed
MeSH terms
Substances
LinkOut - more resources
Full Text Sources
Medical
Miscellaneous
