

High-Dimensional Fixed Effects Profiling Models and Applications in End-Stage Kidney Disease Patients: Current State and Future Directions
- PMID: 38883969
- PMCID: PMC11178325
- DOI: 10.6000/1929-6029.2023.12.24
High-Dimensional Fixed Effects Profiling Models and Applications in End-Stage Kidney Disease Patients: Current State and Future Directions
Abstract
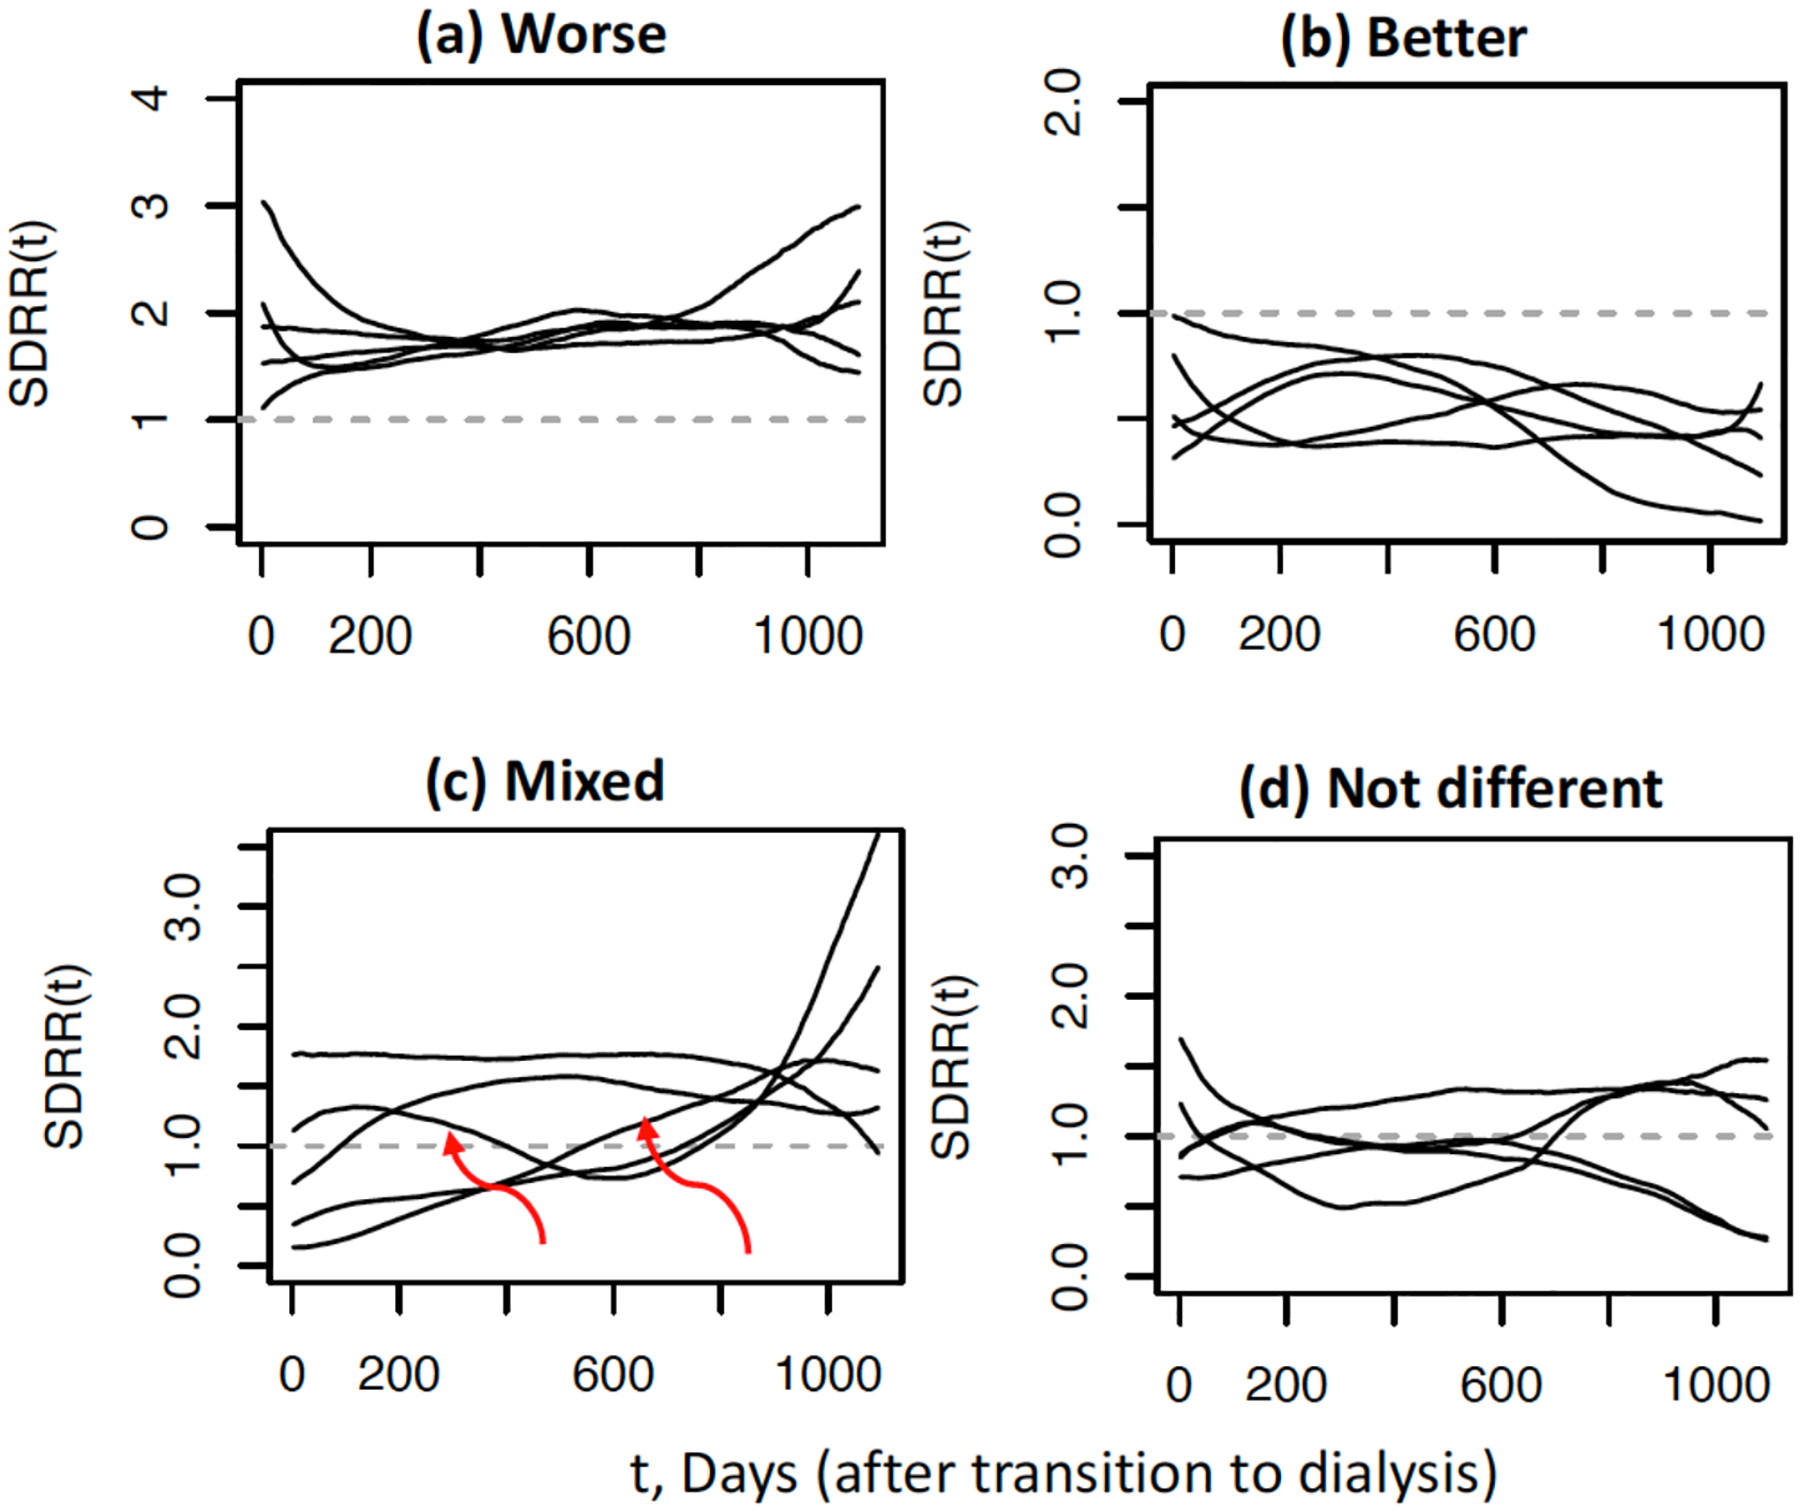
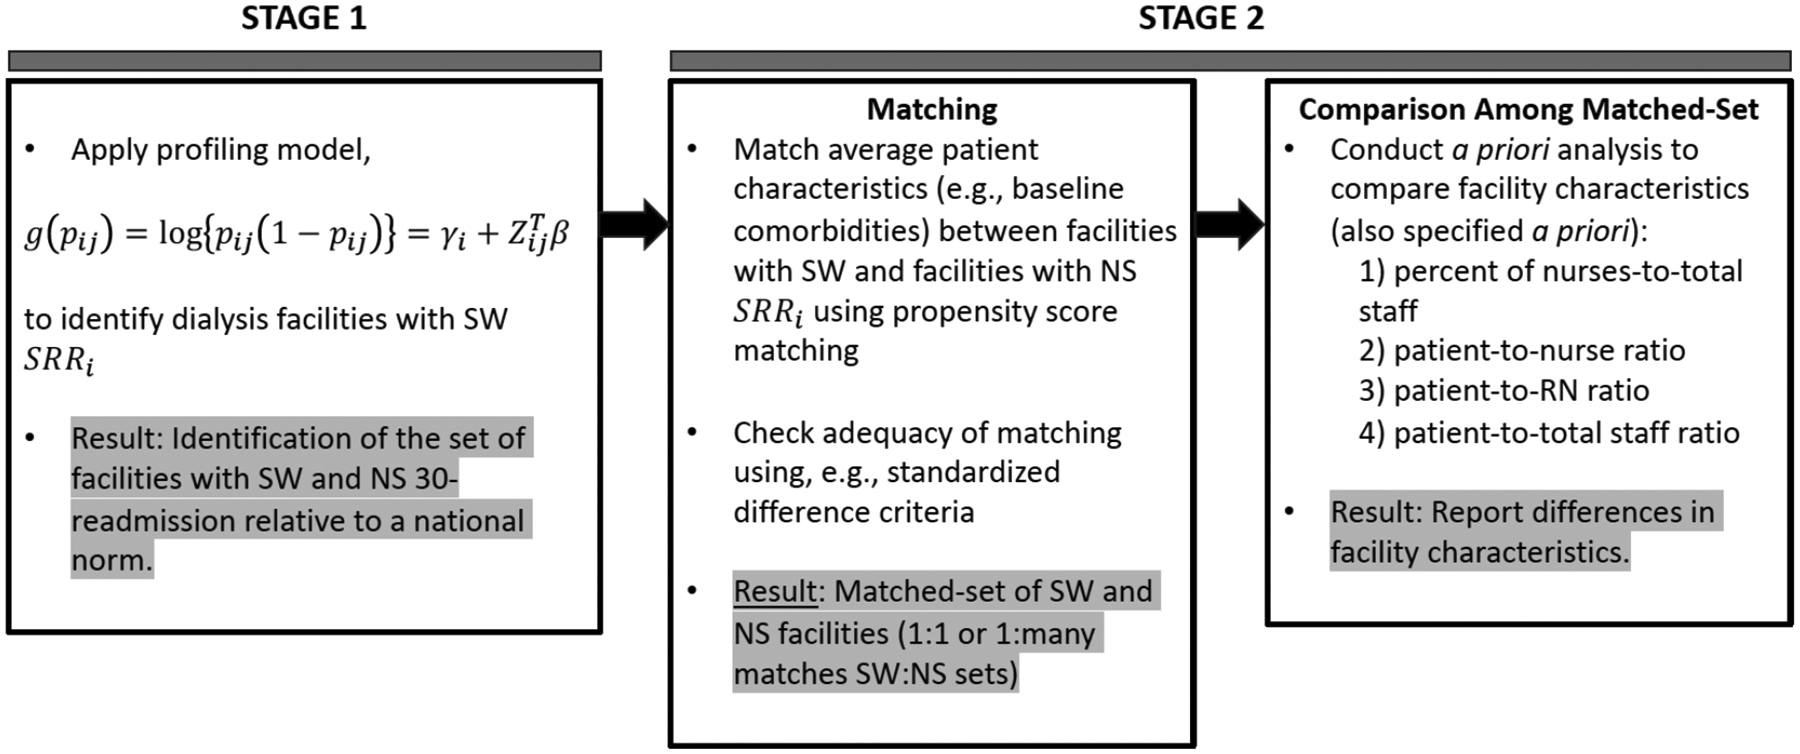
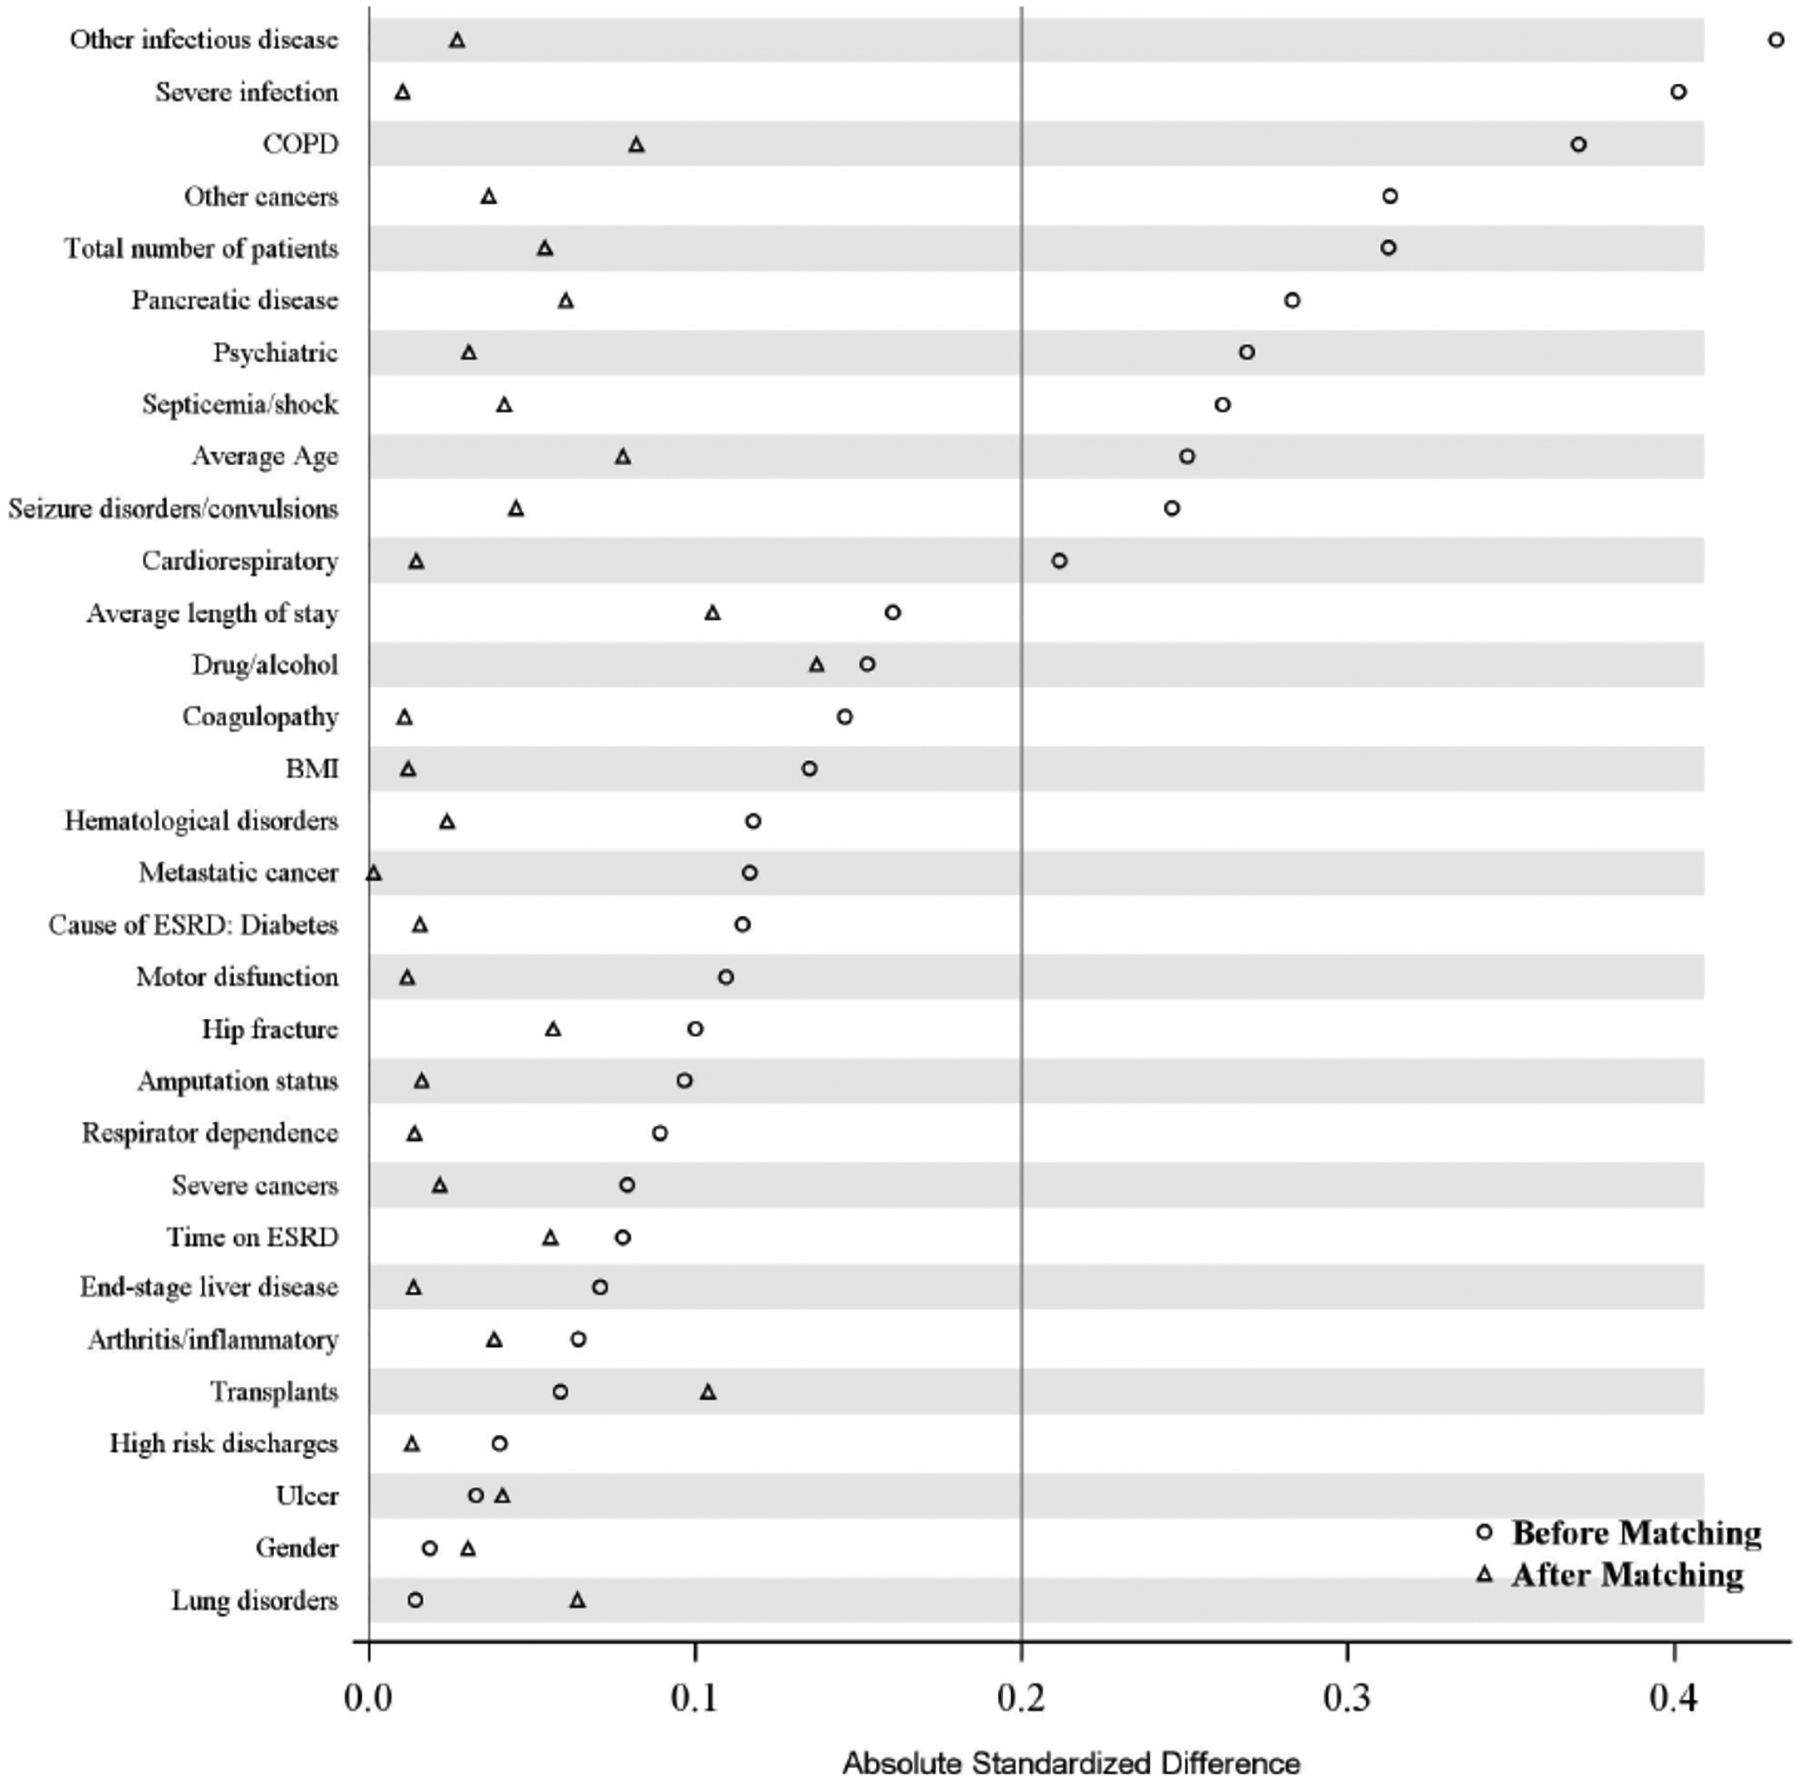
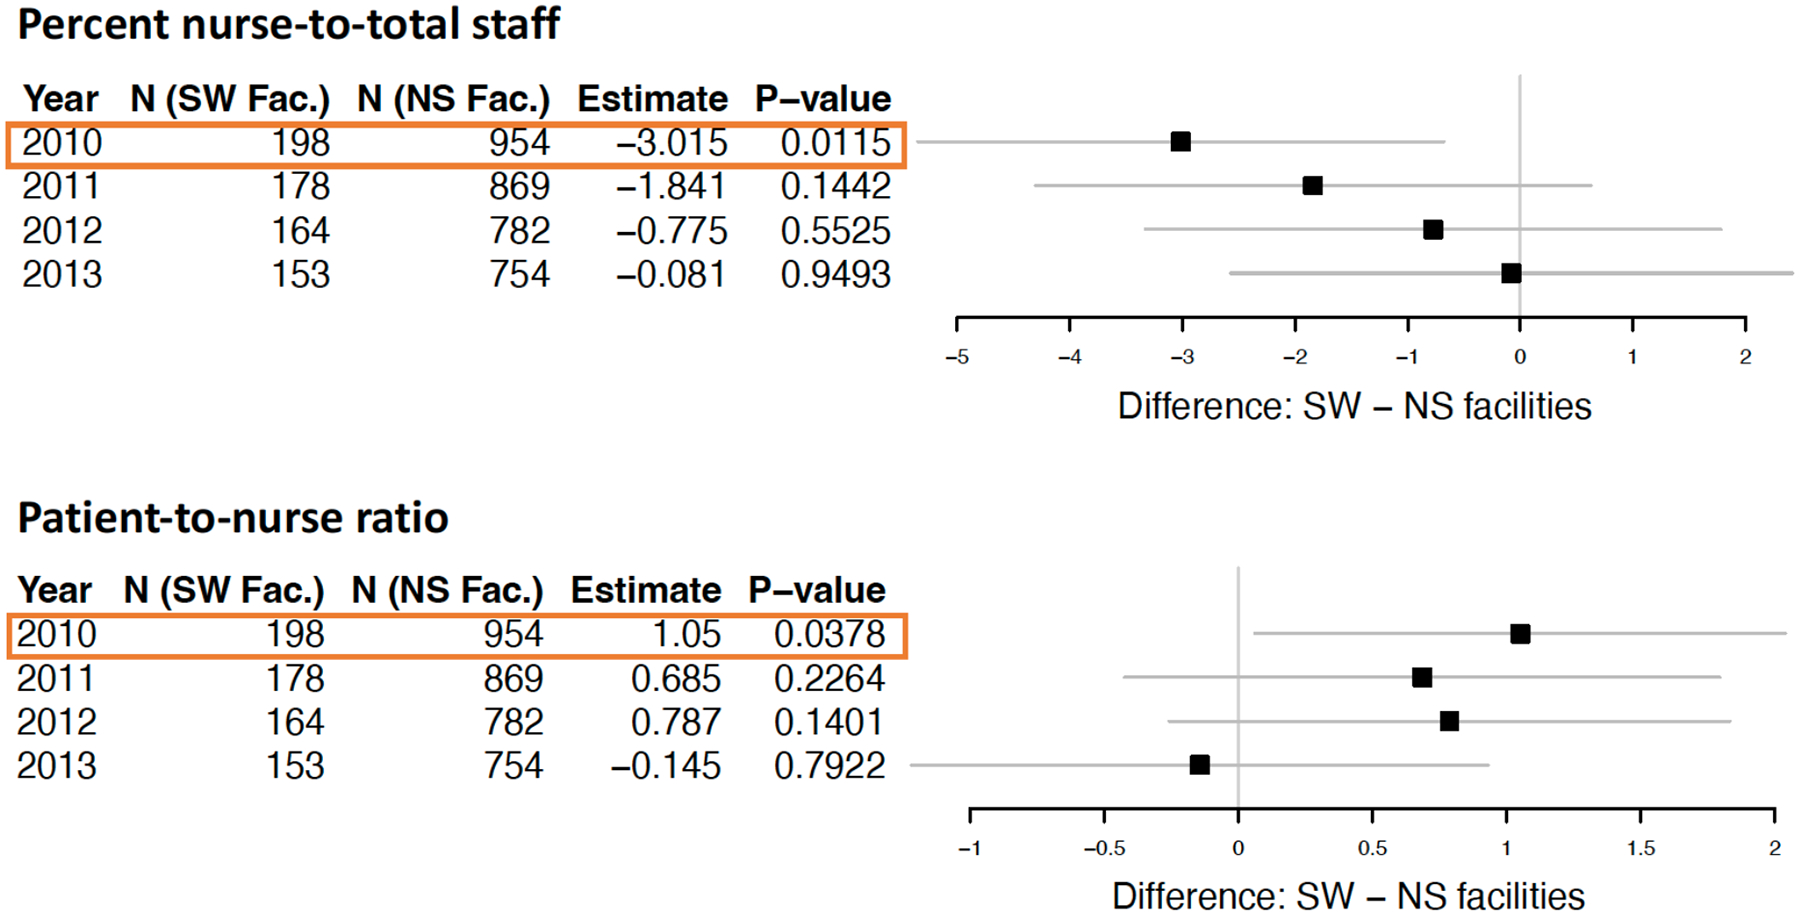
Profiling analysis aims to evaluate health care providers, including hospitals, nursing homes, or dialysis facilities among others with respect to a patient outcome, such as 30-day unplanned hospital readmission or mortality. Fixed effects (FE) profiling models have been developed over the last decade, motivated by the overall need to (a) improve accurate identification or "flagging" of under-performing providers, (b) relax assumptions inherent in random effects (RE) profiling models, and (c) take into consideration the unique disease characteristics and care/treatment processes of end-stage kidney disease (ESKD) patients on dialysis. In this paper, we review the current state of FE methodologies and their rationale in the ESKD population and illustrate applications in four key areas: profiling dialysis facilities for (1) patient hospitalizations over time (longitudinally) using standardized dynamic readmission ratio (SDRR), (2) identification of dialysis facility characteristics (e.g., staffing level) that contribute to hospital readmission, and (3) adverse recurrent events using standardized event ratio (SER). Also, we examine the operating characteristics with a focus on FE profiling models. Throughout these areas of applications to the ESKD population, we identify challenges for future research in both methodology and clinical studies.
Keywords: Dialysis facility staffing; Poisson regression; United States Renal Data System; end-stage kidney disease; fixed effects; generalized linear mixed model; high-dimensional parameters; multilevel varying coefficient model; propensity score; random effects.
Conflict of interest statement
CONFLICTS OF INTEREST The authors declare they have no known conflicts of interests that could influence the work reported here.
Figures

Similar articles
-
Time-dynamic profiling with application to hospital readmission among patients on dialysis.Biometrics. 2018 Dec;74(4):1383-1394. doi: 10.1111/biom.12908. Epub 2018 Jun 5. Biometrics. 2018. PMID: 29870064 Free PMC article.
-
Profiling dialysis facilities for adverse recurrent events.Stat Med. 2020 Apr 30;39(9):1374-1389. doi: 10.1002/sim.8482. Epub 2020 Jan 30. Stat Med. 2020. PMID: 31997372 Free PMC article.
-
Association of US Dialysis Facility Staffing with Profiling of Hospital-Wide 30-Day Unplanned Readmission.Kidney Dis (Basel). 2019 Jun;5(3):153-162. doi: 10.1159/000496147. Epub 2019 Feb 5. Kidney Dis (Basel). 2019. PMID: 31259177 Free PMC article.
-
Reducing hospital readmissions in patients with end-stage kidney disease.Kidney Int. 2015 Dec;88(6):1250-1260. doi: 10.1038/ki.2015.307. Epub 2015 Oct 14. Kidney Int. 2015. PMID: 26466320 Review.
-
Precision Medicine in the Transition to Dialysis and Personalized Renal Replacement Therapy.Semin Nephrol. 2018 Jul;38(4):325-335. doi: 10.1016/j.semnephrol.2018.05.003. Semin Nephrol. 2018. PMID: 30082053 Review.
References
-
- United States Renal Data System. USRDS 2022Annual Data Report: Epidemiology of kidney disease in the United States. Bethesda, MD: National Institutes of Health, National Institute of Diabetes and Digestive and Kidney Diseases. Available from https://adr.usrds.org/2022.
-
- United States Renal Data System. USRDS 2020 Annual Data Report: Epidemiology of Kidney Disease and in the United States. National Institutes of Health, National Institute of Diabetes and Digestive and Kidney Diseases, Bethesda, MD. [cited 2020]: Available from https://adr.usrds.org/2020.
-
- Kalantar-Zadeh K, Kovesdy CP, Streja E, Rhee MC, Soohoo M, Chen JLT, Molnar MZ, Gillen D, Nguyen DV, Norris KC, Sim JJ, Jacobsen SS Transition of care from pre-dialysis prelude to renal replacement therapy: the blueprints of emerging research in advanced chronic kidney disease. Nephrol Dial Transplant 2017; 32(suppl_2): ii91–ii98. 10.1093/ndt/gfw357 - DOI - PMC - PubMed
-
- United States Renal Data System. USRDS 2015 Annual Data Report: Epidemiology of Kidney Disease in the United States. National Institutes of Health, National Institute of Diabetes and Digestive and Kidney Diseases, Bethesda, MD.
-
- Soohoo M, Streja E, Obi Y, Rhee CM, Gillen DL, Sumida K, Nguyen DV, Kovesdy CP, Kalantar-Zadeh K. Predialysis kidney function and its rate of decline predict mortality and hospitalization after starting dialysis. Mayo Clinic Proceedings 2018; 93(8): 1074–1085. 10.1016/j.mayocp.2018.01.030 - DOI - PMC - PubMed