Long-Term Administration of Omeprazole-Induced Hypergastrinemia and Changed Glucose Homeostasis and Expression of Metabolism-Related Genes
- PMID: 38884019
- PMCID: PMC11178409
- DOI: 10.1155/2024/7747599
Long-Term Administration of Omeprazole-Induced Hypergastrinemia and Changed Glucose Homeostasis and Expression of Metabolism-Related Genes
Abstract
Introduction: PPIs, or proton pump inhibitors, are the most widely prescribed drugs. There is a debate regarding the relationship between long-term PPI use and the risk of type 2 diabetes mellitus (T2DM). A potential connection between T2DM and PPIs could be an elevated gastrin concentration. This study is aimed at investigating the long-term effects of PPI omeprazole (OZ) on glucose homeostasis and pancreatic gene expression profile in mice.
Methods: Healthy adult male BALB/c mice were randomly divided into three equal groups (n = 10 in each one): (1) experimental mice that received OZ 20 mg/kg; (2) control mice that received 30 μl saline per os; (3) intact mice without any interventions. Mice were treated for 30 weeks. Glucose homeostasis was investigated by fasting blood glucose level, oral glucose tolerance test (GTT), insulin tolerance test (ITT), and basal insulin resistance (HOMA-IR). Serum gastrin and insulin concentration were determined by ELISA. Expressions of Sirt1, Pparg, Nfκb1 (p105), Nfe2l2, Cxcl5, Smad3, H2a.z, and H3f3b were measured by RT-PCR.
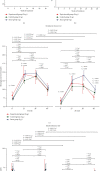
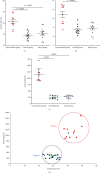
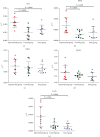
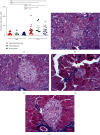
Result: The ROC analysis revealed an increase in fasting blood glucose levels in OZ-treated mice in comparison with control and intact groups during the 30-week experiment. A slight but statistically significant increase in glucose tolerance and insulin sensitivity was observed in OZ-treated mice within 30 weeks of the experiment. The mice treated with OZ exhibited significant increases in serum insulin and gastrin levels, accompanied by a rise in the HOMA-IR level. These animals had a statistically significant increase in Sirt1, Pparg, and Cxcl5 mRNA expression. There were no differences in β-cell numbers between groups.
Conclusion: Long-term OZ treatment induced hypergastrin- and hyperinsulinemia and increased expression of Sirt1, Pparg, and Cxcl5 in mouse pancreatic tissues accompanied by specific changes in glucose metabolism. The mechanism of omeprazole-induced Cxcl5 mRNA expression and its association with pancreatic cancer risk should be investigated.
Copyright © 2024 Alina Kabaliei et al.
Conflict of interest statement
The authors declared no competing interests.
Figures


Similar articles
-
Disturbed islet-cell function related to endogenous gastrin release. Studies on insulin secretion and glucose tolerance in pernicious anemia.J Clin Invest. 1976 Jul;58(1):41-9. doi: 10.1172/JCI108457. J Clin Invest. 1976. PMID: 777030 Free PMC article.
-
No Association of Proton Pump Inhibitor Use with Fasting or Postload Glycaemia in Patients with Cardiovascular Disease: A Cross-Sectional Retrospective Study.Int J Med Sci. 2017 Sep 2;14(10):1015-1021. doi: 10.7150/ijms.19457. eCollection 2017. Int J Med Sci. 2017. PMID: 28924374 Free PMC article.
-
A novel formula Sang-Tong-Jian improves glycometabolism and ameliorates insulin resistance by activating PI3K/AKT pathway in type 2 diabetic KKAy mice.Biomed Pharmacother. 2016 Dec;84:1585-1594. doi: 10.1016/j.biopha.2016.10.101. Epub 2016 Nov 6. Biomed Pharmacother. 2016. PMID: 27829545
-
Proton pump inhibitors: impact on glucose metabolism.Endocrine. 2013 Feb;43(1):22-32. doi: 10.1007/s12020-012-9755-3. Epub 2012 Aug 12. Endocrine. 2013. PMID: 22886351 Review.
-
Metabolic phenotyping guidelines: assessing glucose homeostasis in rodent models.J Endocrinol. 2014 Sep;222(3):G13-25. doi: 10.1530/JOE-14-0182. Epub 2014 Jul 23. J Endocrinol. 2014. PMID: 25056117 Review.
References
MeSH terms
Substances
LinkOut - more resources
Full Text Sources
Medical

