. 2024 May 31:14:1287479.
doi: 10.3389/fonc.2024.1287479. eCollection 2024.

MR histology reveals tissue features beneath heterogeneous MRI signal in genetically engineered mouse models of sarcoma

Affiliations

MR histology reveals tissue features beneath heterogeneous MRI signal in genetically engineered mouse models of sarcoma

Stephanie J Blocker et al. Front Oncol. .

Abstract

Purpose: To identify significant relationships between quantitative cytometric tissue features and quantitative MR (qMRI) intratumorally in preclinical undifferentiated pleomorphic sarcomas (UPS).

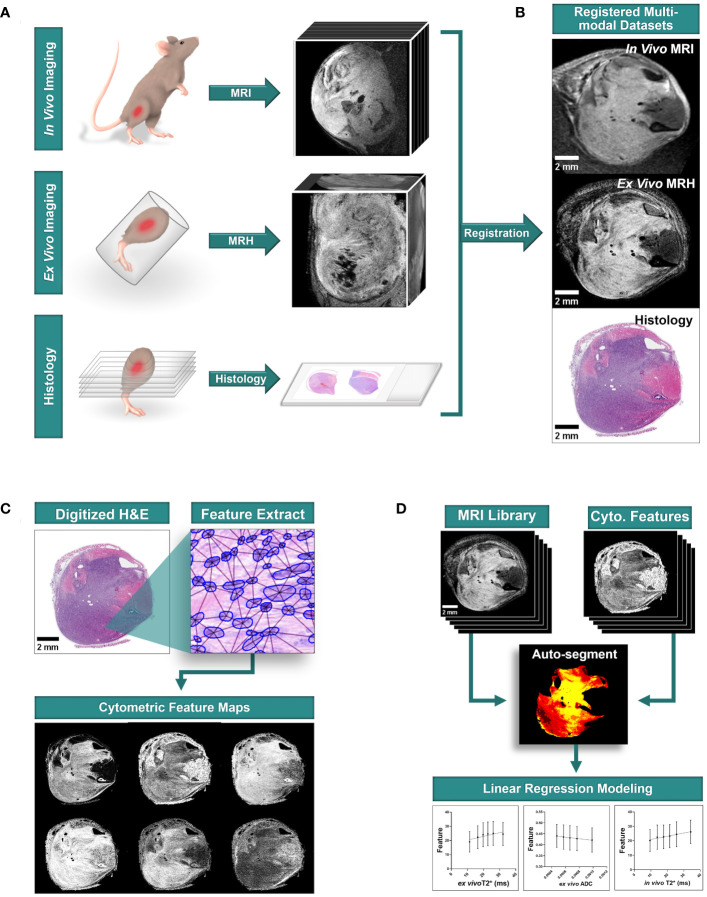
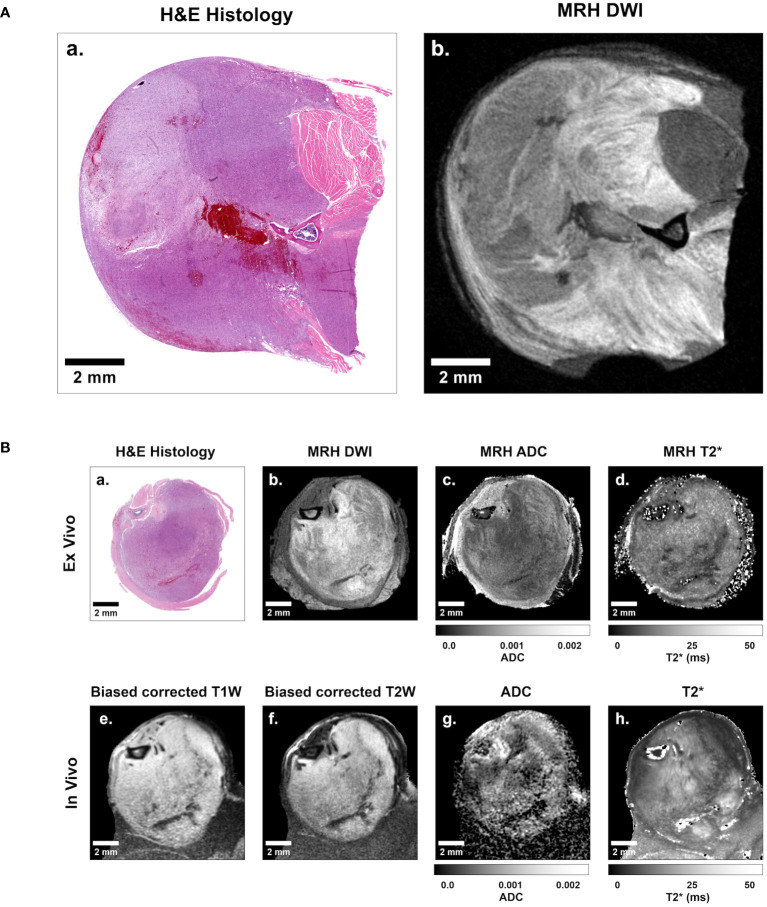
Materials and methods: In a prospective study of genetically engineered mouse models of UPS, we registered imaging libraries consisting of matched multi-contrast in vivo MRI, three-dimensional (3D) multi-contrast high-resolution ex vivo MR histology (MRH), and two-dimensional (2D) tissue slides. From digitized histology we generated quantitative cytometric feature maps from whole-slide automated nuclear segmentation. We automatically segmented intratumoral regions of distinct qMRI values and measured corresponding cytometric features. Linear regression analysis was performed to compare intratumoral qMRI and tissue cytometric features, and results were corrected for multiple comparisons. Linear correlations between qMRI and cytometric features with p values of <0.05 after correction for multiple comparisons were considered significant.

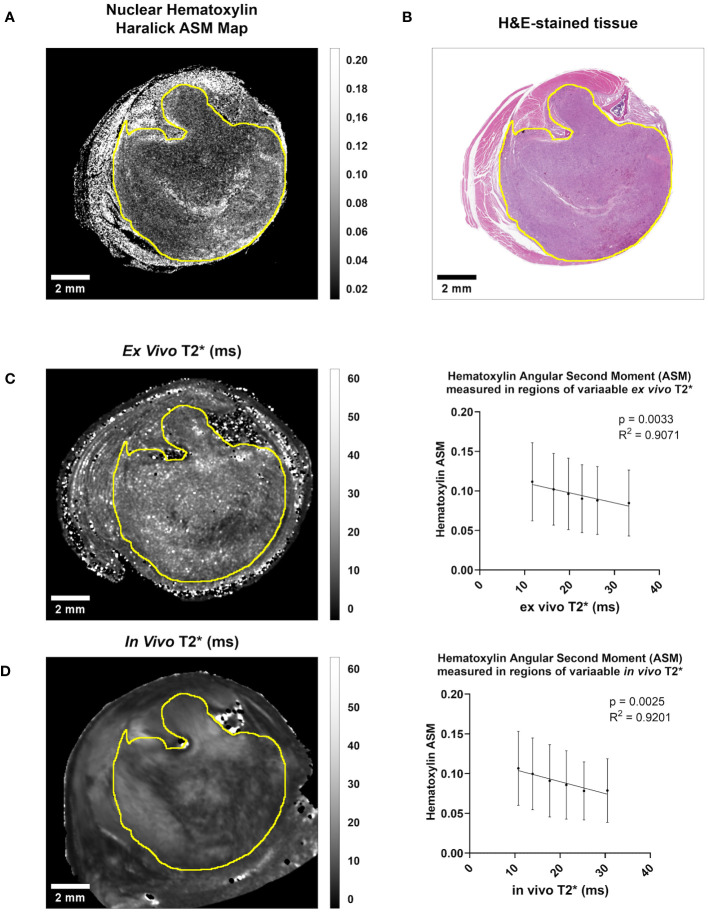
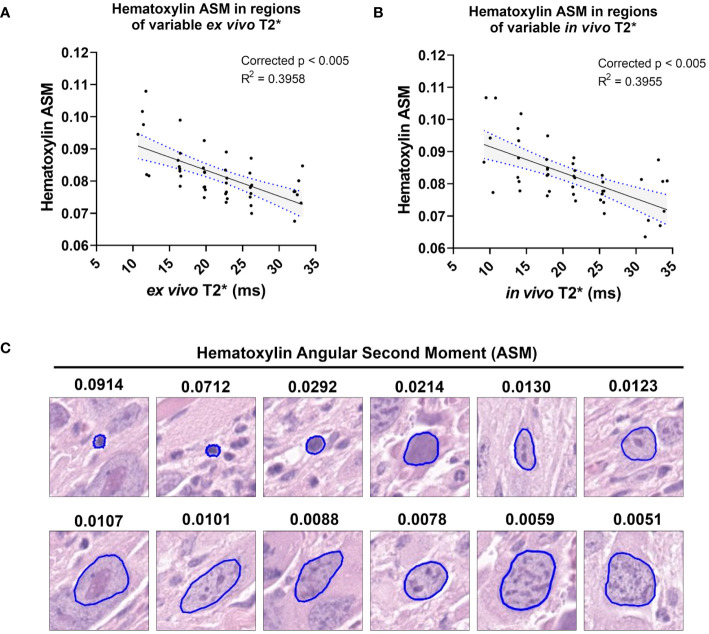
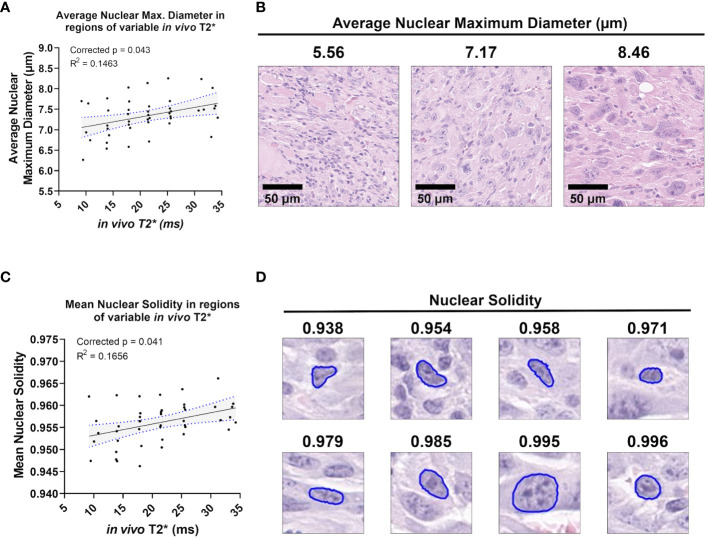
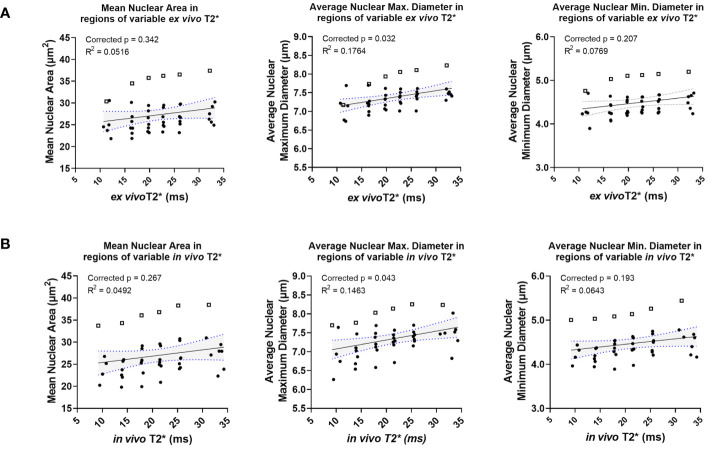
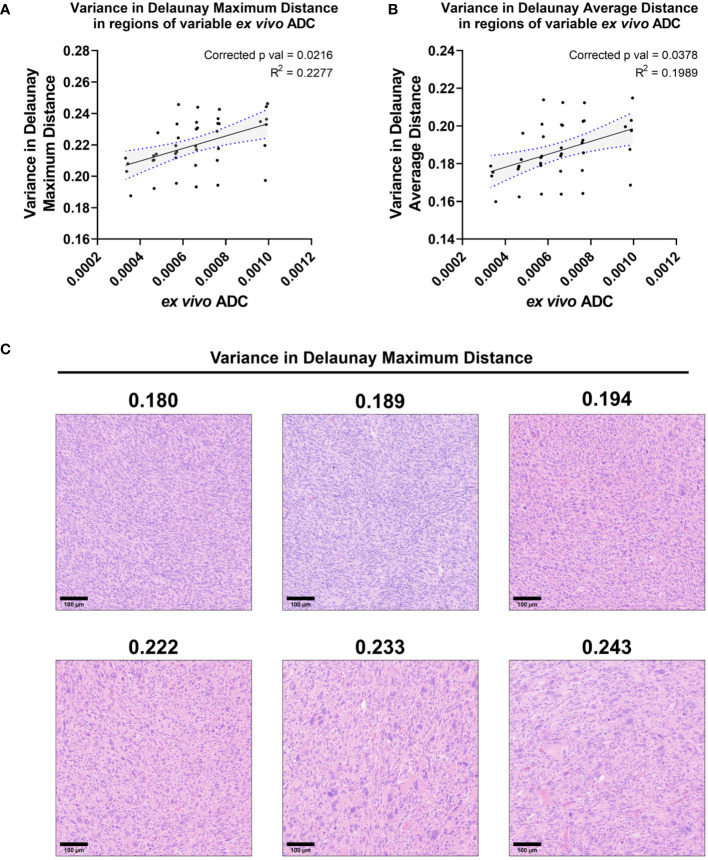
Results: Three features correlated with ex vivo apparent diffusion coefficient (ADC), and no features correlated with in vivo ADC. Six features demonstrated significant linear relationships with ex vivo T2*, and fifteen features correlated significantly with in vivo T2*. In both cases, nuclear Haralick texture features were the most prevalent type of feature correlated with T2*. A small group of nuclear topology features also correlated with one or both T2* contrasts, and positive trends were seen between T2* and nuclear size metrics.

Conclusion: Registered multi-parametric imaging datasets can identify quantitative tissue features which contribute to UPS MR signal. T2* may provide quantitative information about nuclear morphology and pleomorphism, adding histological insights to radiological interpretation of UPS.

Keywords: MRI; feature mapping; histology; image registration; multi-modal; preclinical; sarcoma.


Conflict of interest statement

DK is a co-founder of XRAD Therapeutics, which is commercializing radiosensitizers. DK is on the scientific advisory board for Lumicell, which is commercializing intraoperative imaging technology. DK has received research support from Merck, XRAD Therapeutics, Bristol Myers Squibb, and Varian. However, this funding did not support this work. The remaining authors declare that the research was conducted in the absence of any commercial or financial relationships that could be construed as a potential conflict of interest.

Figures

Figure 1
Figure 1
Multi-modal sarcoma imaging library registration and analysis workflow. Mouse models of UPS were imaged to construct registered imaging data libraries. (A) Tumors were imaged with MRI in vivo, and fixed tissues were imaged at high resolution with MRH before preparation for conventional histology with hematoxylin and eosin (H&E) staining. (B) Tumor imaging libraries were registered to histological sections. (C) Quantitative cytometric feature maps were generated from H&E-stained tumor cross sections. (D) Registered MR imaging datasets were compared to quantitative cytometrics intratumorally to probe for linear relationships between tumor features and MR signal. Scale bars = 2 mm.
Figure 2
Figure 2
Representative sarcoma imaging library including multi-contrast, multi-resolution MR datasets registered to digitized 2D histological slides. (A) Shown is a sample of a digitized 2D histology image (left) with a registered 35 μm isotropic MRH diffusion-weighted image (right). (B) The complete imaging suite gathered for each sarcoma-bearing animal included registered ex vivo histology (B.a), diffusion-weighted MRH (B.b), MRH apparent diffusion coefficient (ADC) maps (B.c), MRH T2* maps (B.d), as well as in vivo bias corrected anatomical T1-weighted (B.e) and T2-weighted (B.f) images, ADC maps (B.g), and T2* maps (B.h). Scale bars = 2 mm.
Figure 3
Figure 3
Both in vivo and ex vivo T2* demonstrate significant linear relationships with Hematoxylin Haralick Angular Second Moment (ASM) at the intratumoral level in murine soft tissue sarcomas. (A) A map of nuclear texture feature Haralick ASM was derived from an H&E-stained cross-section (B) of a soft tissue sarcoma of the hind limb. Within the tumor boundary (yellow line) Nuclear Haralick ASM demonstrated a significant linear relationship with ex vivo T2* in this sample (C). This trend was also seen when comparing Nuclear Haralick ASM to in vivo T2* imaging in this sample (D). Plotted are mean and SD Nuclear Haralick ASM in regions of variable T2*, and p-value and R2 values are included. Scale bar = 2 mm.
Figure 4
Figure 4
T2* correlates with a measure of nuclear stain texture, nuclear Haralick Angular Second Moment (ASM), in both ex vivo and in vivo MR. Among the cohort of soft tissue sarcomas (n = 8), regions of variable ex vivo T2* demonstrated a significant linear relationship with nuclear hematoxylin Haralick ASM (A). The same trend was observed in vivo among the same cohort (B). Regression lines are plotted in black, with 95% CI represented with blue dotted lines and shading. Corrected p-values and R2 values are provided for reference. Nuclear hematoxylin Haralick ASM is a measure of textural homogeneity, with high values corresponding to greater uniformity in intranuclear staining (C). Nuclear Haralick ASM is also related to size, as shown in representative nuclei with variable ASM values. Pathology images are 25 µm2 tiles, with nuclear segmentations outlined in blue.
Figure 5
Figure 5
In vivo T2* correlates with nuclear topology metrics. Among the cohort of soft tissue sarcomas (n = 8), regions of variable in vivo T2* signal demonstrated significant linear relationships with average nuclear maximum diameter (A), a direct measure of nuclear size (B). In vivo T2* also correlated significantly with mean nuclear solidity (C). Nuclear solidity is a measure of how much the nuclear boundary deviates from a convex shape, with lower values correlating with greater irregularity (D). Scale bars = 100 µm.
Figure 6
Figure 6
Ex vivo and in vivo T2* show positive correlations with nuclear size, including in a statistical outlier. Ex vivo T2* showed trends of positive correlation with nuclear size metrics, including mean nuclear area, average nuclear maximum diameter, and average nuclear minimum diameter (A). The same trends were seen with in vivo T2* and nuclear size metrics (B). In all cases, data from a single tumor (represented in each graph by open squares) exhibited larger nuclear size metrics overall relative to measurements made in all other tumors in the cohort (solid circles).
Figure 7
Figure 7
In vivo T2* correlates with three measures of variance in nuclear Hematoxylin stain intensity. Among the cohort of soft tissue sarcomas (n = 8), regions of variable in vivo T2* signal demonstrated significant linear relationship with variance in nuclear hematoxylin average intensity (A), variance in nuclear hematoxylin peak intensity (B), and variance in nuclear hematoxylin range (C). In each case, variance in hematoxylin intensity metrics showed an inverse correlation with in vivo T2*. Regression lines are plotted in black, with 95% CI represented with blue dotted lines and shading. Corrected p-values and R2 values are provided for reference. Variance in mean nuclear hematoxylin intensity is a measure of how a cell’s nuclear stain intensity varies from its local neighbors, with high values indicating more heterogeneous groups (C). Shown are representative tiles of H&E-stained soft tissue sarcomas with differing variance in nuclear mean hematoxylin intensity (top) and quantitative hematoxylin stain vector images (bottom) (D). Scale bars = 100 µm.
Figure 8
Figure 8
Ex vivo ADC correlates with two measures of Delaunay triangulation variance. Among the cohort of soft tissue sarcomas (n=8), regions of variable ex vivo ADC demonstrated a significant linear relationship with variance in Delaunay maximum distance (A) and Delaunay average distance (B). Regression lines are plotted in black, with 95% CI represented with blue dotted lines and shading. Corrected p-values and R2 values are provided for reference. Variance in Delaunay distances measures the heterogeneity of cell-to-cell distances within local populations, demonstrated visually in representative tiles comparing regions of increasing variance of Delaunay maximum distance in soft tissue sarcomas (C). Scale bars = 100 µm.

Similar articles

References

    1. Choi JH, Ro JY. The 2020 WHO classification of tumors of soft tissue: selected changes and new entities. Adv Anat Pathol. (2021) 28:44–58. doi: 10.1097/PAP.0000000000000284 - DOI - PubMed
    1. Thway K, Fisher C. Undifferentiated and dedifferentiated soft tissue neoplasms: Immunohistochemical surrogates for differential diagnosis. Semin Diagn Pathol. (2021) 38:170–86. doi: 10.1053/j.semdp.2021.09.005 - DOI - PubMed
    1. Kallen ME, Hornick JL. The 2020 WHO classification: what's new in soft tissue tumor pathology? Am J Surg Pathol. (2021) 45:e1–e23. doi: 10.1097/PAS.0000000000001552 - DOI - PubMed
    1. Fletcher CD, Dal Cin P, de Wever I, Mandahl N, Mertens F, Mitelman F, et al. . Correlation between clinicopathological features and karyotype in spindle cell sarcomas. A report of 130 cases from the CHAMP study group. Am J Pathol. (1999) 154:1841–7. doi: 10.1016/S0002-9440(10)65441-7 - DOI - PMC - PubMed
    1. Steele CD, Tarabichi M, Oukrif D, Webster AP, Ye H, Fittall M, et al. . Undifferentiated sarcomas develop through distinct evolutionary pathways. Cancer Cell. (2019) 35:441–56 e8. doi: 10.1016/j.ccell.2019.02.002 - DOI - PMC - PubMed

LinkOut - more resources