. 2024 Dec;18(1):2368336.
doi: 10.1080/19336934.2024.2368336. Epub 2024 Jun 17.

The astrocyte-enriched gene deathstar plays a crucial role in the development, locomotion, and lifespan of D. melanogaster

Affiliations

The astrocyte-enriched gene deathstar plays a crucial role in the development, locomotion, and lifespan of D. melanogaster

Xiaoli Zhang et al. Fly (Austin). 2024 Dec.

Abstract

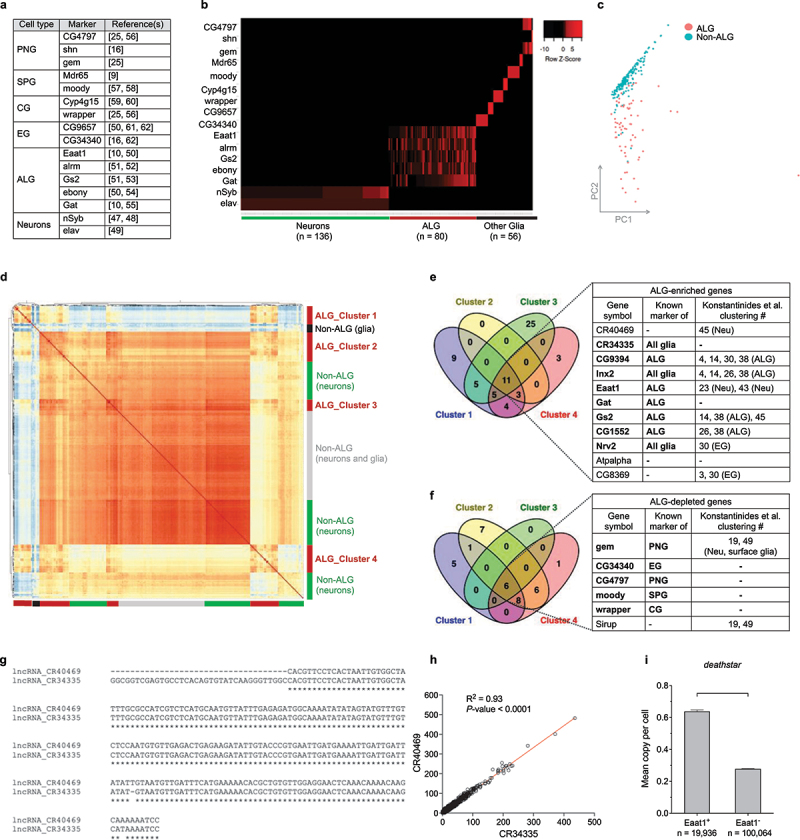
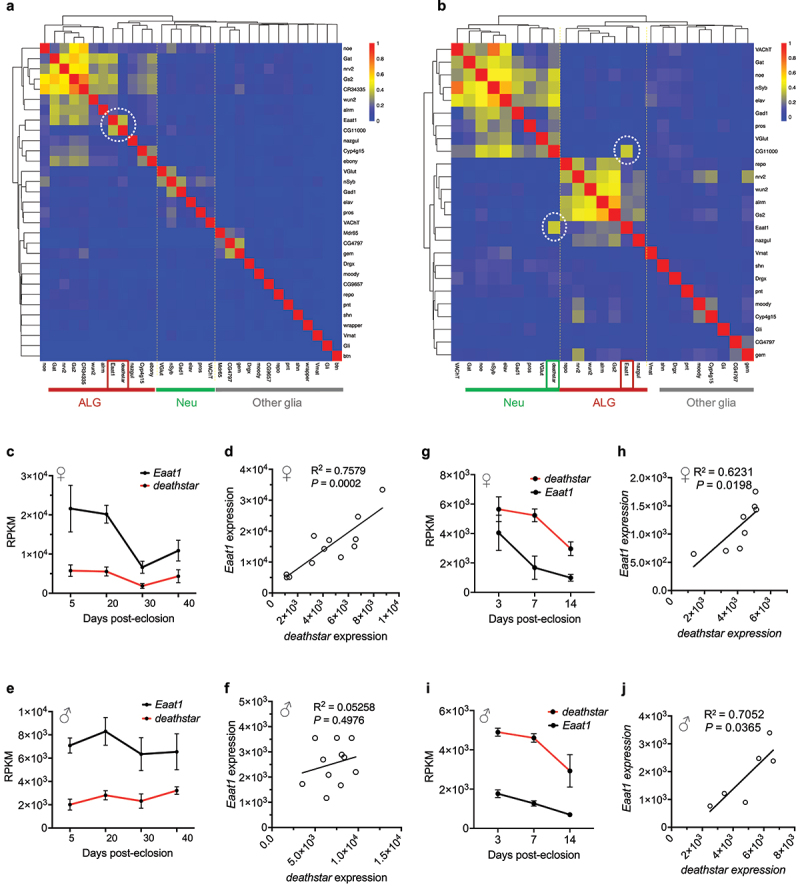
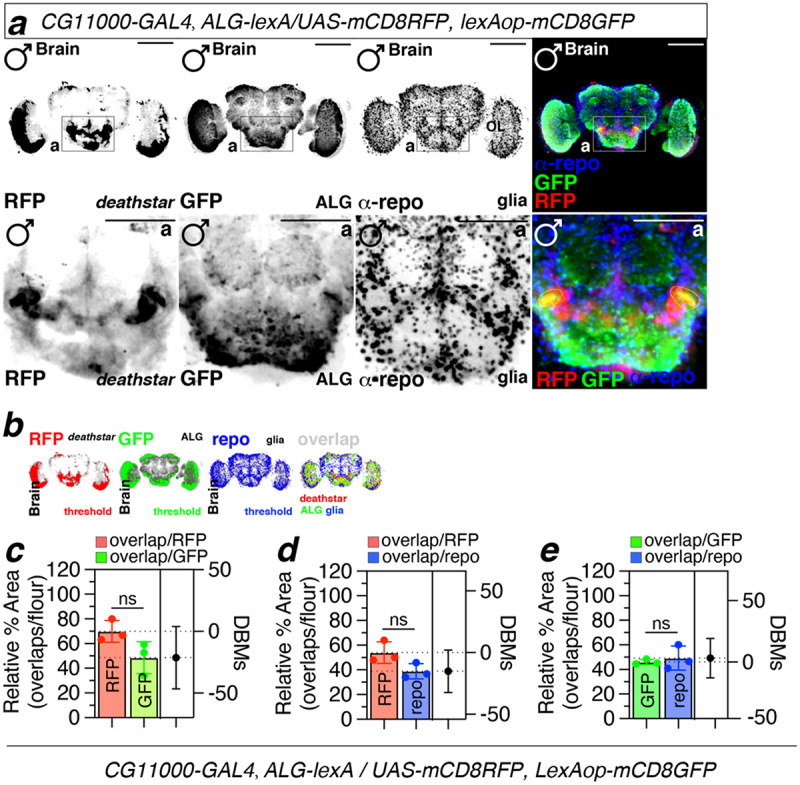
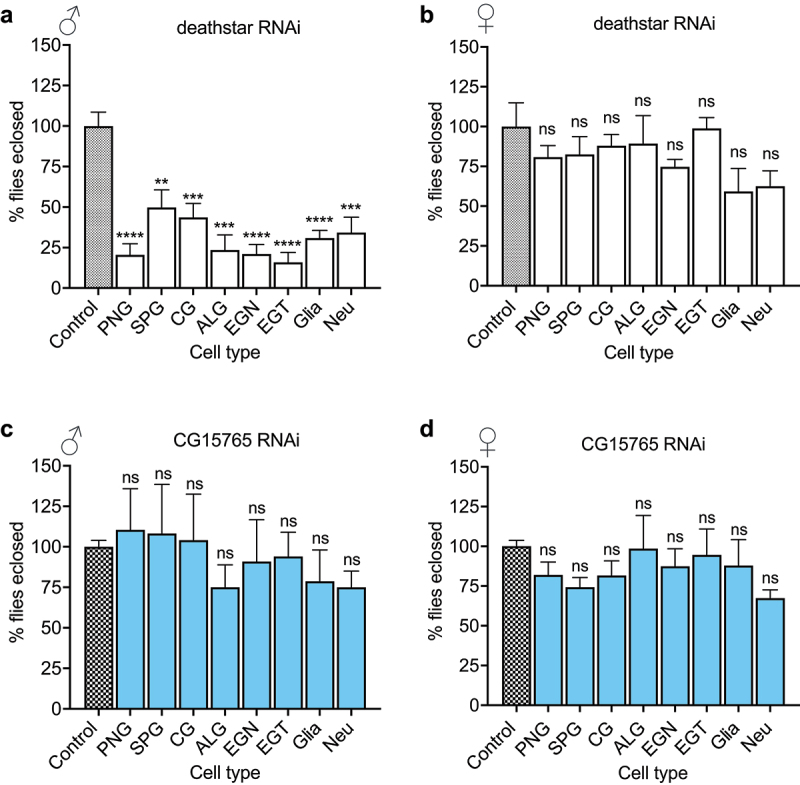
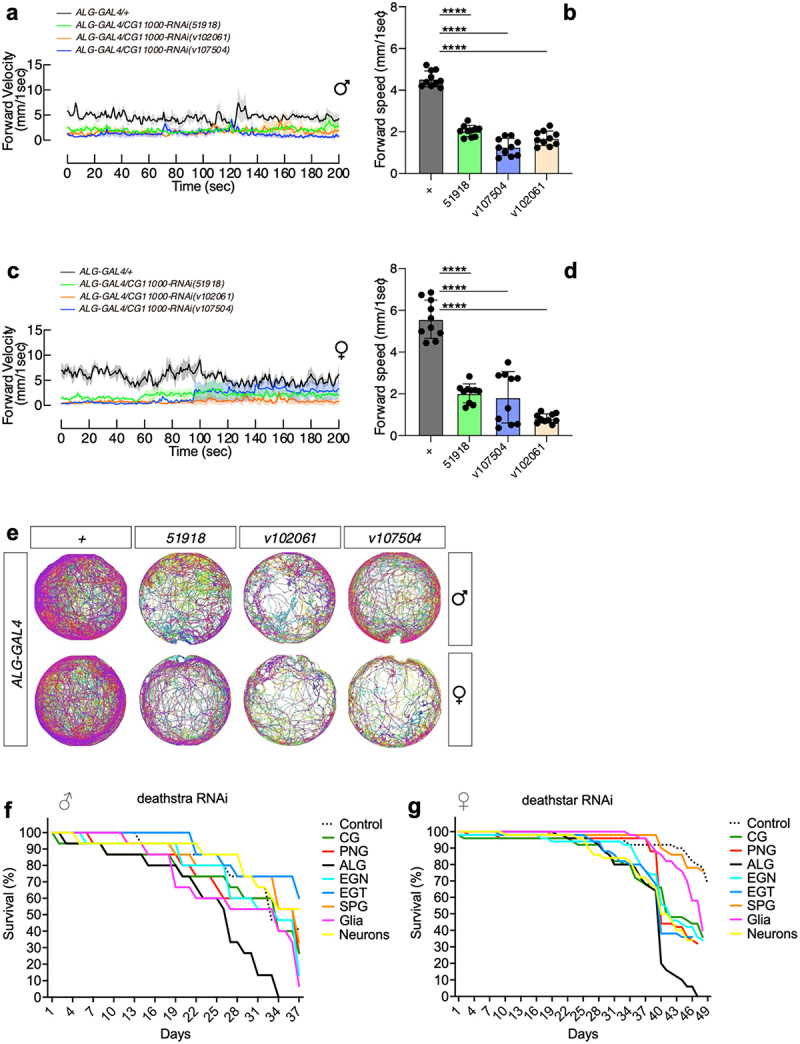
The Drosophila melanogaster brain is a complex organ with various cell types, orchestrating the development, physiology, and behaviors of the fly. While each cell type in Drosophila brain is known to express a unique gene set, their complete genetic profile is still unknown. Advances in the RNA sequencing techniques at single-cell resolution facilitate identifying novel cell type markers and/or re-examining the specificity of the available ones. In this study, exploiting a single-cell RNA sequencing data of Drosophila optic lobe, we categorized the cells based on their expression pattern for known markers, then the genes with enriched expression in astrocytes were identified. CG11000 was identified as a gene with a comparable expression profile to the Eaat1 gene, an astrocyte marker, in every individual cell inside the Drosophila optic lobe and midbrain, as well as in the entire Drosophila brain throughout its development. Consistent with our bioinformatics data, immunostaining of the brains dissected from transgenic adult flies showed co-expression of CG11000 with Eaat1 in a set of single cells corresponding to the astrocytes in the Drosophila brain. Physiologically, inhibiting CG11000 through RNA interference disrupted the normal development of male D. melanogaster, while having no impact on females. Expression suppression of CG11000 in adult flies led to decreased locomotion activity and also shortened lifespan specifically in astrocytes, indicating the gene's significance in astrocytes. We designated this gene as 'deathstar' due to its crucial role in maintaining the star-like shape of glial cells, astrocytes, throughout their development into adult stage.

Keywords: CG11000; Eaat1; astrocyte; deathstar; glia; male development; single-cell RNA sequencing.


Conflict of interest statement

No potential conflict of interest was reported by the author(s).

Figures

Figure 1.
Figure 1.
Cell type identification of single cells in Drosophila optic lobe. (a) the list of molecular markers used in this study for cell type identification. (b) Classified single cells of D. melanogaster optic lobe based on their expression pattern for the markers. Red color denotes ‘expression,’ and black color denotes ‘no expression.’ A row Z-score was used to represent the expression level of each marker. (c) The principal component analysis (PCA) plot distinguishing the ALG single cells (red dots) from single cells of other cell types (labeled as non-ALG, green dots) based on their entire transcriptome profile. (d) Hierarchical clustering categorized ALG cells into four different clusters, all exhibiting distinct global transcriptome profile form other cell types. (e) Venn diagram illustrates the number of the genes upregulated in each ALG cluster. The table lists the common upregulated genes between all ALG clusters. Bold-face fonts represent the genes with cell type-specificity reports in previous studies. If the genes were previously attributed to a particular cell type cluster by Konstantinides et al. [25], the features of the clusters are presented in the table. (f) Venn diagram illustrates the number of downregulated genes in each ALG cluster. The table lists the common downregulated genes in all ALG clusters. Also, the clustering information of Konstantinides et al. study is presented for each gene. (g) Sequence homology between CR40469 and CR34335 transcripts using ClustalW. Both sequences are shown in 5‘ → 3’ orientation. (h) Positive expression correlation of CR40469 and CR34335 genes in Drosophila optic lobe (n = 120,000 single cells). (i) Increased expression of deathstar gene in Eaat1-expressing (Eaat1+) cells in Drosophila optic lobe.
Figure 2.
Figure 2.
Positive expression correlation of deathstar with Eaat1. a) Heatmap analysis based on the Pearson correlation coefficient between deathstar and known molecular markers of Drosophila nervous system across sequenced single cells of Drosophila optic lobe (n = 120,000 cells). deathstar is co-clustered with the ALG markers including Eaat1 (dotted circle). b) Heatmap analysis based on the Pearson correlation coefficient between deathstar and known molecular markers of Drosophila nervous system across sequenced single cells of Drosophila mid-brain (n = 28,695). Two dotted circles in the heatmap point to the positive expression correlation of deathstar with Eaat1, among other markers. c-d) Correlation analysis of deathstar and Eaat1 expression level using a bulk RNA-seq data of developing whole brain from female D. melanogaster (n = 12 flies). e-f) Correlation analysis of deathstar and Eaat1 expression using a bulk RNA-seq data of developing whole brain of male D. melanogaster (n = 11 flies). g-j) Significant expression correlation between deathstar and Eaat1 genes across developmental time-points of female (g-h), and male (i-j) D. melanogaster, obtained from the bulk RNA-seq data analysis of developing whole brain of the flies.
Figure 3.
Figure 3.
Coexpression of deathstar and Eaat1 in the Drosophila brain. a) Overlapping fluorescence signals correspond to the deathstar (RFP, red) and Eaat1 (GFP, green) expression, was shown in the midbrain of D. melanogaster (denoted as yellow dotted lines in the lower panel). Anti-repo antibody (α-repo) was used for labeling the glia in the Drosophila brain (blue). Scale bars = 50 µm. b) Results of the threshold function in ImageJ to differentiate real fluorescence signals from background for optimal quantification of overlapping fluorescent signals. Red signals denote deathstar (BDSC#: 91441), green signals denote Eaat1 (BDSC#: 52719), and blue signals denote repo expression. c-e) Quantification data of the overlapping signals between deathstar and Eaat1 (c), between deathstar and Repo (d), and between Eaat1 and Repo genes (e).
Figure 4.
Figure 4.
The effects of deathstar knock-down on normal development of D. melanogaster. a) In comparison with the control group, the majority of male progenies with deathstar knock-down did not develop into adults, indicated by significant reduction in eclosion rate (%). b) Deathstar knock-down in females did not show any developmental defects. Differences between the eclosion rates (%) of control group and the progenies with cell type-specific deathstar knock-down were not statistically significant (ns = nonsignificant). c-d) Eclosion rate of the progenies expressing an off-target RNAi, targeting the Drosophila CG15765 gene but not deathstar. The eclosion rate (%) was similar for all groups in both males and females.
Figure 5.
Figure 5.
The effects of deathstar knock-down on the locomotion and lifespan of adult flies. a) Expression suppression of deathstar in astrocytes of male flies resulted in the decreased level of forward velocity per second, in a 200-second time course, in comparison with the control groups which do not express any RNAi (denoted as grey/black lines). b) Average velocity rate of the flies with suppressed deathstar expression in comparison with the control group (P-value <0.0001). c) Expression suppression of deathstar in astrocytes of female flies resulted in the decreased level of forward velocity per second, in a 200-second time course, in comparison with the control groups which lacked RNAi expression. d) Average velocity rate of the flies with suppressed deathstar expression in comparison with the control group (P-value <0.0001). e) Trajectory map analysis of the flies in the RNAi groups versus control groups, illustrating impeded locomotion activities in both male and female flies with suppressed expression level of deathstar using three different RNAi lines. f–g) ALG-specific reduction of lifespan in both male and female D. melanogaster, under expression suppression of deathstar gene.

References

    1. Tolwinski NS. Introduction: Drosophila—A model system for developmental biology. MDPI; 2017. p. 9. - PMC - PubMed
    1. Spindler SR, Hartenstein V.. The Drosophila neural lineages: a model system to study brain development and circuitry. Dev Genes Evol. 2010;220(1–2):1–18. doi: 10.1007/s00427-010-0323-7 - DOI - PMC - PubMed
    1. Zhu B, Pennack JA, McQuilton P, et al. Drosophila neurotrophins reveal a common mechanism for nervous system formation. PLoS Biol. 2008;6(11):e284. doi: 10.1371/journal.pbio.0060284 - DOI - PMC - PubMed
    1. Neckameyer WS, Argue KJ. Comparative approaches to the study of physiology: Drosophila as a physiological tool. Am J Physiol Regul Integr Comp Physiol. 2013;304(3):R177–R88. doi: 10.1152/ajpregu.00084.2012 - DOI - PMC - PubMed
    1. Shin M, Copeland JM, Venton BJ. Drosophila as a model system for neurotransmitter measurements. ACS Chem Neurosci. 2018;9(8):1872–1883. doi: 10.1021/acschemneuro.7b00456 - DOI - PMC - PubMed

Substances

LinkOut - more resources