. 2024 Jun 17:12:RP89918.
doi: 10.7554/eLife.89918.

Structural characterization of ligand binding and pH-specific enzymatic activity of mouse Acidic Mammalian Chitinase

Affiliations

Structural characterization of ligand binding and pH-specific enzymatic activity of mouse Acidic Mammalian Chitinase

Roberto Efraín Díaz et al. Elife. .

Abstract

Chitin is an abundant biopolymer and pathogen-associated molecular pattern that stimulates a host innate immune response. Mammals express chitin-binding and chitin-degrading proteins to remove chitin from the body. One of these proteins, Acidic Mammalian Chitinase (AMCase), is an enzyme known for its ability to function under acidic conditions in the stomach but is also active in tissues with more neutral pHs, such as the lung. Here, we used a combination of biochemical, structural, and computational modeling approaches to examine how the mouse homolog (mAMCase) can act in both acidic and neutral environments. We measured kinetic properties of mAMCase activity across a broad pH range, quantifying its unusual dual activity optima at pH 2 and 7. We also solved high-resolution crystal structures of mAMCase in complex with oligomeric GlcNAcn, the building block of chitin, where we identified extensive conformational ligand heterogeneity. Leveraging these data, we conducted molecular dynamics simulations that suggest how a key catalytic residue could be protonated via distinct mechanisms in each of the two environmental pH ranges. These results integrate structural, biochemical, and computational approaches to deliver a more complete understanding of the catalytic mechanism governing mAMCase activity at different pH. Engineering proteins with tunable pH optima may provide new opportunities to develop improved enzyme variants, including AMCase, for therapeutic purposes in chitin degradation.

Keywords: E. coli; biochemistry; chemical biology; chitin; enzyme; human; lung; molecular biophysics; mouse; structural biology.


Conflict of interest statement

RD, AE, GC, PA, IY, BF, MT, IS No competing interests declared, SV, RL S.J.V.D. and R.M.L. are listed as inventors on a patent United States application: 17/505,561 for the use of chitinases to treat fibrotic lung disease. S.J.V.D., R.M.L., and J.S.F. are listed as inventors on a patent for mutant chitinases with enhanced expression and activity, JF S.J.V.D. and R.M.L. are listed as inventors on a patent for the use of chitinases to treat fibrotic lung disease. United States application: 17/505,561 S.J.V.D., R.M.L., and J.S.F. are listed as inventors on a patent for mutant chitinases with enhanced expression and activity

Figures
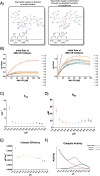
Figure 1.
Figure 1.. Kinetic properties of mAMCase catalytic domain at various pH.
(A) Chemical depiction of the conserved two-step mechanism where the glycosidic oxygen is protonated by an acidic residue and a nucleophile adds into the anomeric carbon leading to elimination of the hydrolyzed product. (B) The rate of 4MU-chitobioside catalysis (1 /s) by mAMCase catalytic domain is plotted as a function of 4MU-chitobioside concentration (µM). Each data point represents n=4 with error bars representing the standard deviation. Michaelis-Menten equation without substrate inhibition was used to estimate the kcat and KM from the initial rate of reaction at various substrate concentrations. (C) The rate of substrate turnover (1 /s) by mAMCase catalytic domain is plotted as a function of pH. Error bars represent the 95% confidence interval. (D) The Michaelis-Menten constant of mAMCase catalytic domain is plotted as a function of pH. Error bars represent the 95% confidence interval. (E) The catalytic efficiency (kcat/KM) of mAMCase catalytic domain is plotted as a function of pH. (F) Hypothetical catalytic activity modeled explained by a low pH mechanism (red), and high pH mechanism (blue) and their corresponding total activity (dashed line).
Figure 1—figure supplement 1.
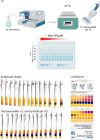
Figure 1—figure supplement 1.. pH of reaction solution before and after quenching with 0.1 M Gly-NaOH pH 10.7.
(A) Schematic of modified endpoint 4MU-chitobioside assay. (B) Reaction pH before and after quenching with 0.1 M Gly-NaOH pH 10.7, and (C) a pH strip reference sheet.
Figure 1—figure supplement 2.
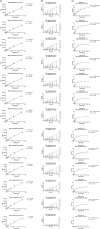
Figure 1—figure supplement 2.. Kinetics of 4MU-chitobioside catalysis by mAMCase catalytic domain at various pH.
(A) A linear fit forced through Y=0 is used to generate the standard curve for converting RFU to 4MU [µM]. Each data point represents n=8 with error bars representing the standard deviation. (B) 4MU fluorescence (RFU) is plotted as a function of time (s). Each data point represents n=4 with error bars representing the standard deviation. A linear fit is applied to each concentration of 4MU-chitobioside to calculate an initial rate. RFU is converted to µM using a 4MU standard curve. (C) The rate of 4MU-chitobioside catalysis (1 /s) by mAMCase catalytic domain is plotted as a function of 4MU-chitobioside concentration (µM). Each data point represents n=4 with error bars representing the standard deviation. Michaelis-Menten equation without substrate inhibition was used to estimate the kcat and KM from the initial rate of reaction at various substrate concentrations.
Figure 2.
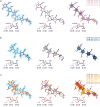
Figure 2.. Schematic representation of sugar-binding subsites in mAMCase.
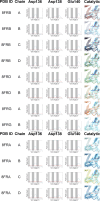
(A) PDB ID: 8GCA, chain A. Stick representation of all GlcNAc2 sugar-binding events observed in n sugar-binding subsites with 2mFo-DFc map shown as a 1.2 Å contour (blue), the subsite nomenclature, and a schematic of alternative conformation ligand modeling. (B) PDB ID: 8FRA, chain D. Stick representation of all GlcNAcn binding events observed in n+0.5 sugar-binding subsites with 2mFo-DFc map shown as a 1.2 Å contour (blue), the subsite nomenclature, and a schematic of alternative conformation ligand modeling. (C) PDB ID: 8FR9, chain B. Stick representation of all GlcNAcn binding events observed in n and n+0.5 sugar-binding subsites with 2mFo-DFc map shown as a 1.2 Å contour (blue), the subsite nomenclature, and a schematic of alternative conformation ligand modeling.
Figure 2—figure supplement 1.
Figure 2—figure supplement 1.. 96-well plate layout of crystallization conditions.
(A) Brightfield view of crystals used to determine the structures reported in this paper. (B) Hanging drop crystallization trays were set up as a 2-condition gradient to identify optimal crystallization conditions for AMCase +GlcNAcn. pH increased along the X-axis from pH 3.70–5.60. Ligand concentration increased along the Y-axis from 0 mM to 29 mM [GlcNAc2], 19 mM [GlcNAc3], 10 mM [GlcNAc4], or 8 mM [GlcNAc5]. Black boxes indicate conditions where crystals grew. Lilac boxes indicate conditions for structures reported in this paper.
Figure 2—figure supplement 2.
Figure 2—figure supplement 2.. pKa of apo and holo mAMCase in the D2 inactive and active conformation.
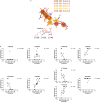
PDB ID: 8FG5, 8FG7 (apo); 8GCA, 8FRC, 8FR9, 8FRB, 8FRD, 8FRG, 8FRA (holo). Violin plots showing the distribution of pKa across Asp136, Asp138, Glu140 between (A) apo and (B) holo mAMCase structures in the inactive or active conformation.
Figure 2—figure supplement 3.
Figure 2—figure supplement 3.. Overview of key residues for mAMCase activity.
(A) Stick representation of ligand and aromatic residues Trp31, Tyr34, Trp99, and Trp218 in the active site with 2mFo-DFc map shown as a 1.2 Å contour (blue). (B) Stick representation of ligand and polar residues Arg145, His208, Asp213, and His269 in the active site with 2mFo-DFc map shown as a 1.2 Å contour (blue). (C, D) Stick representation of ligand and catalytic residues Asp136, Asp138, and Glu140 in the active site with 2mFo-DFc map shown as a 1.2 Å contour (blue).
Figure 2—figure supplement 4.
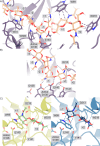
Figure 2—figure supplement 4.. Protein-ligand interactions between mAMCase and chitin.
(A) PDB ID: 8GCA, chain A with GlcNAc6 modeled for viewing simplicity. Stick representation highlighting the stabilizing H-π interactions between Trp31, Trp360, and Trp218 and the −3,–1,+1, and +2 sugars, respectively. (B) PDB ID: 8GCA, chain A with GlcNAc6 modeled for viewing simplicity. Stick representation highlighting the stabilizing hydrogen bond interactions between the –1 sugar and Asp138 (2.6 Å) and Asp213 (3.4 Å), and between the +1 sugar and Tyr141 (3.0 Å). Glu140 is 2.8 Å from the glycosidic oxygen bridging the –1 and +1 sugars. (C) PDB ID: 8FRA, chains C (left) and D (right). Stick representation highlighting the stabilizing hydrogen bond interactions that we argue stabilize the +1 sugar (left; chain A) and the +1’ sugar-binding subsite (right; chain B).
Figure 2—figure supplement 5.
Figure 2—figure supplement 5.. Ringer analysis of catalytic triad confirms alternative Asp138 conformations.
(A) Ringer analysis to detect alternative conformations in electron density maps. Ringer detected one peak for Asp136 at χ1=180° and Glu140 at χ1=300°, indicating only one conformation, whereas two peaks were detected for Asp138 at χ1=180° and χ1=300°, indicating two alternative conformations. (B) Stick representation of Asp136, Asp138, and Glu140 with 2mFo-DFc map volume shown as a 1.2 Å contour (blue).
Figure 3.
Figure 3.. Asp138 orientation correlates with ligand subsite occupancy.
(A) PDB ID: 8FR9, chain B. Schematic of the alternative conformation ligand modeling. (B) Linear correlation between sugar-binding subsite occupancy and Asp138 active conformation occupancy.
Figure 4.
Figure 4.. pKa of GH18 chitinases in the D2 inactive and active conformation.
(A) PDB ID: 8GCA, chain A. Distribution of pKa across Asp136, Asp138, Glu140 of mAMCase structures in either Asp138 inactive or Asp138 active conformation. (B) PDB ID: 3FXY, 3RM4, 3RM8, 3RME (inactive conformation); 2YBU, 3FY1 (active conformation). Distribution of pKa across Asp136, Asp138, Glu140 of hAMCase structures in either Asp138 inactive or Asp138 active conformation. (C) PDB ID: 3ALF, 3AQU, 3FXY, 3RM4, 3RM8, 3RME (inactive conformation); 2UY2, 2UY3, 2YBU, 4HME, 4MNJ, 4R5E, 4TXE (active conformation). Distribution of pKa across the catalytic triad D1xD2xE of GH18 chitinases in either D2 inactive or active conformation.
Figure 5.
Figure 5.. Distribution of distances observed every 10 ps of each simulation and their respective time courses.
(A) Asp138 χ1 angles over a 10 ns simulation. (B) Representative minimum distance snapshots of structure during pH 6.5 inactive simulation (left), and pH 2.0 active simulation (right). (C) Distribution of Asp138 χ1 angles over a 10 ns simulation.
Figure 6.
Figure 6.. Proposed model for ligand translocation towards the active site and ligand release post-catalysis.
(A) PDB ID: 8GCA, chain A with no ligand (step 1); with GlcNAc4 generated by phenix.elbow using PubChem ID: 10985690 (step 2); with GlcNAc6 generated by phenix.elbow using PubChem ID: 6918014 (step 3–4, 8); with oxazolinium intermediate generated by phenix.elbow using PubChem ID: 25260046 (steps 5.1–5.2); with GlcNAc2 and GlcNAc4 generated by phenix.elbow using PubChem ID: 439544 and 10985690, respectively (steps 6–7). Chemical representation of GH18 catalytic cycle with corresponding molecular models of each step. Catalytic residues Asp136, Asp138, Glu140, and ligands are shown as sticks. Protons are shown as gray spheres.

Update of

References

    1. Afonine PV, Grosse-Kunstleve RW, Echols N, Headd JJ, Moriarty NW, Mustyakimov M, Terwilliger TC, Urzhumtsev A, Zwart PH, Adams PD. Towards automated crystallographic structure refinement with phenix.refine. Acta Crystallographica. Section D, Biological Crystallography. 2012;68:352–367. doi: 10.1107/S0907444912001308. - DOI - PMC - PubMed
    1. Aguilera B, Ghauharali-van der Vlugt K, Helmond MTJ, Out JMM, Donker-Koopman WE, Groener JEM, Boot RG, Renkema GH, van der Marel GA, van Boom JH, Overkleeft HS, Aerts J. Transglycosidase activity of chitotriosidase: improved enzymatic assay for the human macrophage chitinase. The Journal of Biological Chemistry. 2003;278:40911–40916. doi: 10.1074/jbc.M301804200. - DOI - PubMed
    1. Barad BA, Liu L, Diaz RE, Basilio R, Van Dyken SJ, Locksley RM, Fraser JS. Differences in the chitinolytic activity of mammalian chitinases on soluble and insoluble substrates. Protein Science. 2020;29:966–977. doi: 10.1002/pro.3822. - DOI - PMC - PubMed
    1. Bhunia B, Dutta D, Chaudhuri S. Extracellular alkaline protease from Bacillus licheniformis NCIM‐2042: Improving enzyme activity assay and characterization. Engineering in Life Sciences. 2011;11:207–215. doi: 10.1002/elsc.201000020. - DOI
    1. Boot RG, Blommaart EF, Swart E, Ghauharali-van der Vlugt K, Bijl N, Moe C, Place A, Aerts JM. Identification of a novel acidic mammalian chitinase distinct from chitotriosidase. The Journal of Biological Chemistry. 2001;276:6770–6778. doi: 10.1074/jbc.M009886200. - DOI - PubMed