

Prediction of prognosis in glioblastoma with radiomics features extracted by synthetic MRI images using cycle-consistent GAN
- PMID: 38884673
- PMCID: PMC11408565
- DOI: 10.1007/s13246-024-01443-8
Prediction of prognosis in glioblastoma with radiomics features extracted by synthetic MRI images using cycle-consistent GAN
Abstract
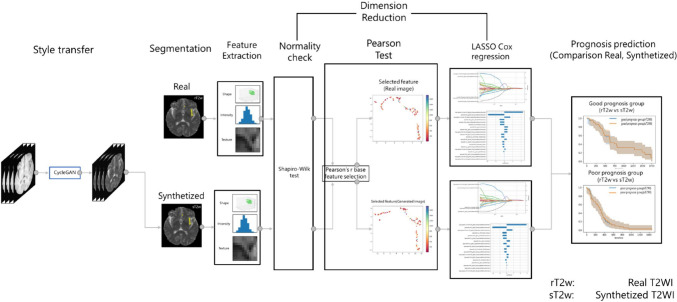
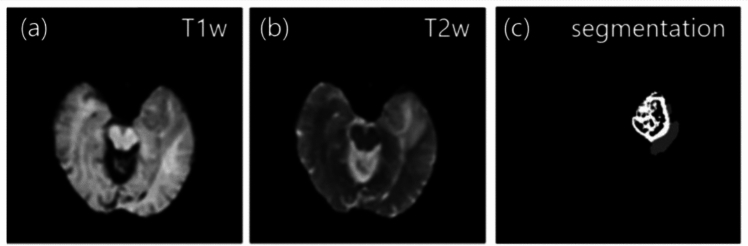
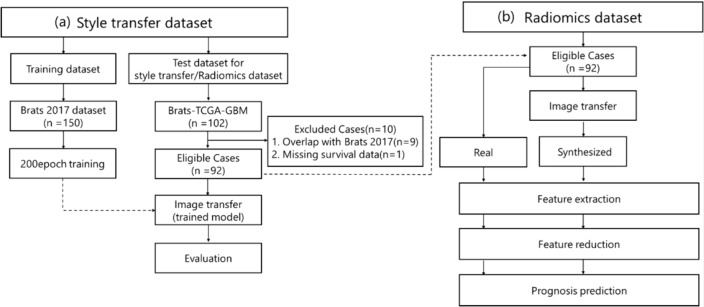
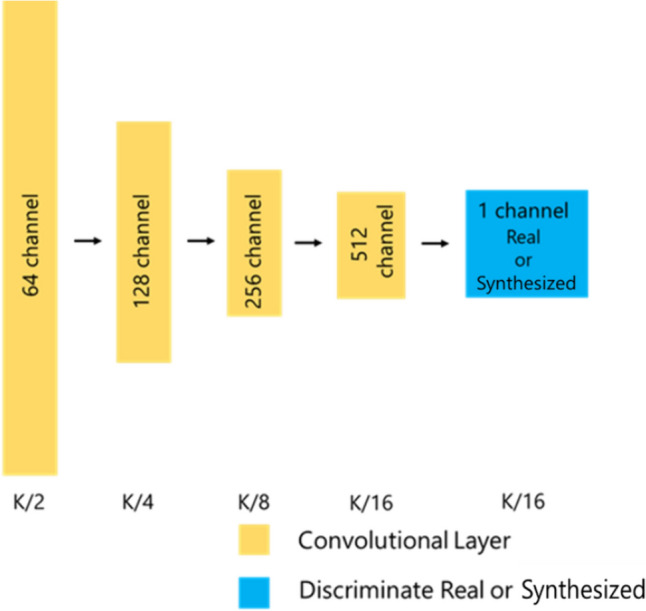
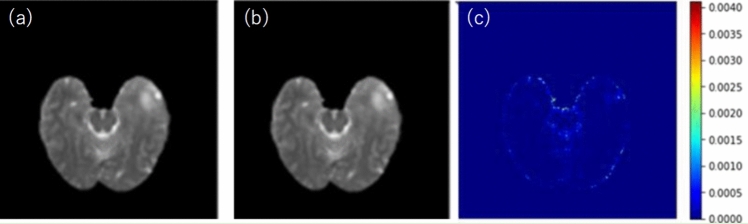
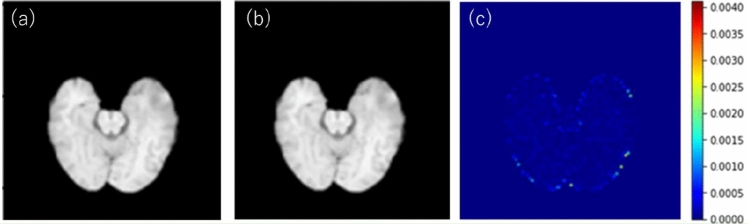
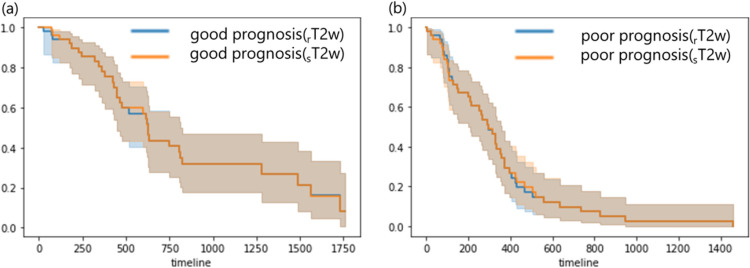
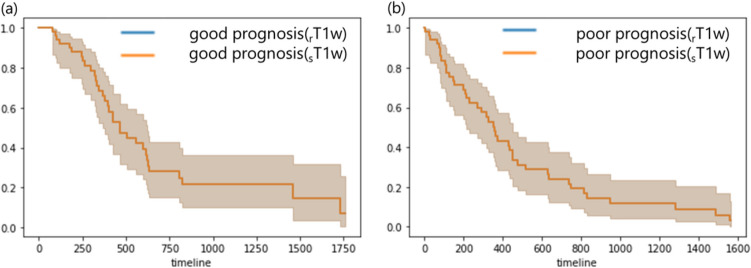
To propose a style transfer model for multi-contrast magnetic resonance imaging (MRI) images with a cycle-consistent generative adversarial network (CycleGAN) and evaluate the image quality and prognosis prediction performance for glioblastoma (GBM) patients from the extracted radiomics features. Style transfer models of T1 weighted MRI image (T1w) to T2 weighted MRI image (T2w) and T2w to T1w with CycleGAN were constructed using the BraTS dataset. The style transfer model was validated with the Cancer Genome Atlas Glioblastoma Multiforme (TCGA-GBM) dataset. Moreover, imaging features were extracted from real and synthesized images. These features were transformed to rad-scores by the least absolute shrinkage and selection operator (LASSO)-Cox regression. The prognosis performance was estimated by the Kaplan-Meier method. For the accuracy of the image quality of the real and synthesized MRI images, the MI, RMSE, PSNR, and SSIM were 0.991 ± 2.10 , 2.79 ± 0.16, 40.16 ± 0.38, and 0.995 ± 2.11 , for T2w, and .992 ± 2.63 , 2.49 ± 6.89 , 40.51 ± 0.22, and 0.993 ± 3.40 for T1w, respectively. The survival time had a significant difference between good and poor prognosis groups for both real and synthesized T2w (p < 0.05). However, the survival time had no significant difference between good and poor prognosis groups for both real and synthesized T1w. On the other hand, there was no significant difference between the real and synthesized T2w in both good and poor prognoses. The results of T1w were similar in the point that there was no significant difference between the real and synthesized T1w. It was found that the synthesized image could be used for prognosis prediction. The proposed prognostic model using CycleGAN could reduce the cost and time of image scanning, leading to a promotion to build the patient's outcome prediction with multi-contrast images.
Keywords: Cycle-GAN; GAN; Machine learning; Neural network; Radiomics.
© 2024. The Author(s).
Conflict of interest statement
The authors declare no conflicts of interest associated with this manuscript.
Figures


Similar articles
-
A Triple-Classification Radiomics Model for the Differentiation of Primary Chordoma, Giant Cell Tumor, and Metastatic Tumor of Sacrum Based on T2-Weighted and Contrast-Enhanced T1-Weighted MRI.J Magn Reson Imaging. 2019 Mar;49(3):752-759. doi: 10.1002/jmri.26238. Epub 2018 Nov 14. J Magn Reson Imaging. 2019. PMID: 30430686
-
Prediction of preoperative tumor-related epilepsy using XGBoost radiomics models with 4 MRI sequences.Biomed Phys Eng Express. 2025 Mar 19;11(3). doi: 10.1088/2057-1976/adbdd3. Biomed Phys Eng Express. 2025. PMID: 40054011
-
A Deep Learning-Based Radiomics Model for Prediction of Survival in Glioblastoma Multiforme.Sci Rep. 2017 Sep 4;7(1):10353. doi: 10.1038/s41598-017-10649-8. Sci Rep. 2017. PMID: 28871110 Free PMC article.
-
Predicting glioblastoma molecular subtypes and prognosis with a multimodal model integrating convolutional neural network, radiomics, and semantics.J Neurosurg. 2022 Dec 2;139(2):305-314. doi: 10.3171/2022.10.JNS22801. Print 2023 Aug 1. J Neurosurg. 2022. PMID: 36461822
-
Integrated Biophysical Modeling and Image Analysis: Application to Neuro-Oncology.Annu Rev Biomed Eng. 2020 Jun 4;22:309-341. doi: 10.1146/annurev-bioeng-062117-121105. Annu Rev Biomed Eng. 2020. PMID: 32501772 Free PMC article. Review.
Cited by
-
Key Cell-in-Cell Related Genes are Identified by Bioinformatics and Experiments in Glioblastoma.Cancer Manag Res. 2024 Sep 5;16:1109-1130. doi: 10.2147/CMAR.S475513. eCollection 2024. Cancer Manag Res. 2024. PMID: 39253064 Free PMC article.
References
-
- American Association of Neurological Surgeons. Classification of brain tumors. https://www.aans.org/en/Media/Classifications-of-Brain-Tumors. Accessed 2/4/2022
-
- Walker MD, Alexander E Jr, Hunt WE et al (1978) Evaluation of BCNU and/or radiotherapy in the treatment of anaplastic gliomas: a cooperative clinical trial. J Neurosurg 49(3):333–343. 10.3171/jns.1978.49.3.0333 - PubMed
-
- Lacroix M, Abi-Said D, Fourney DR et al (2001) A multivariate analysis of 416 patients with glioblastoma multiforme: prognosis, extent of resection, and survival. J Neurosurg 95:190–198. 10.3171/jns.2001.95.2.0190 - PubMed
MeSH terms
LinkOut - more resources
Full Text Sources
Medical