. 2024 Jun 17;81(1):269.
doi: 10.1007/s00018-024-05309-w.

Unveiling the crucial role of betaine: modulation of GABA homeostasis via SLC6A1 transporter (GAT1)

Affiliations

Unveiling the crucial role of betaine: modulation of GABA homeostasis via SLC6A1 transporter (GAT1)

Manan Bhatt et al. Cell Mol Life Sci. .

Abstract

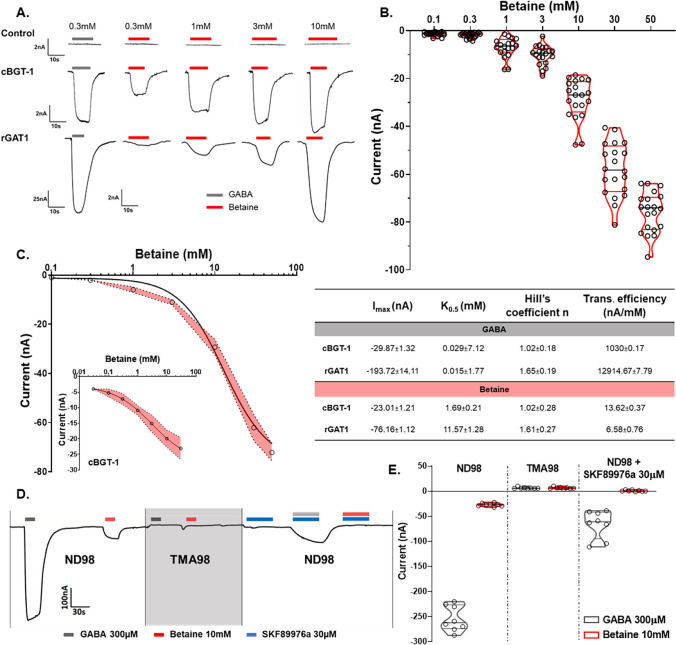
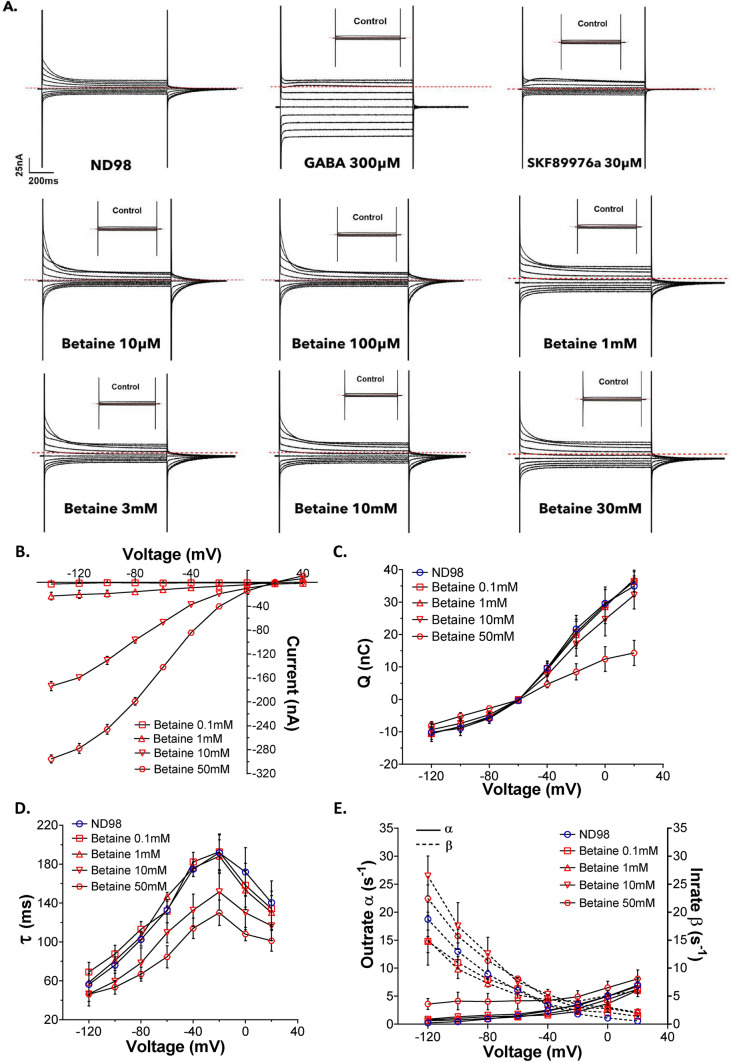
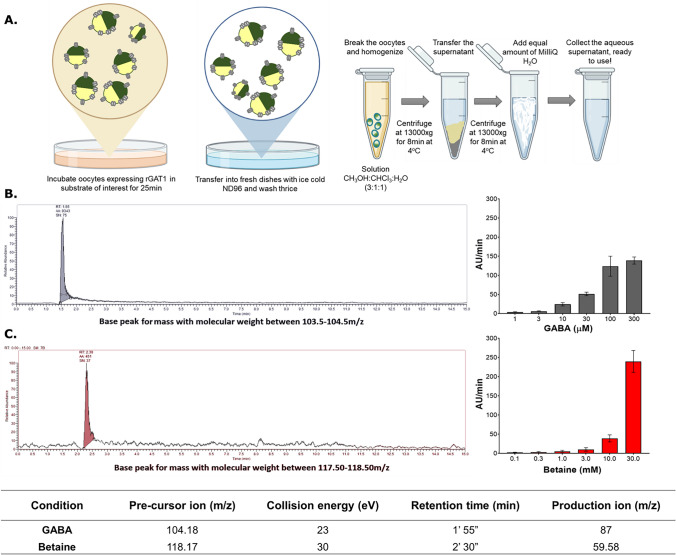
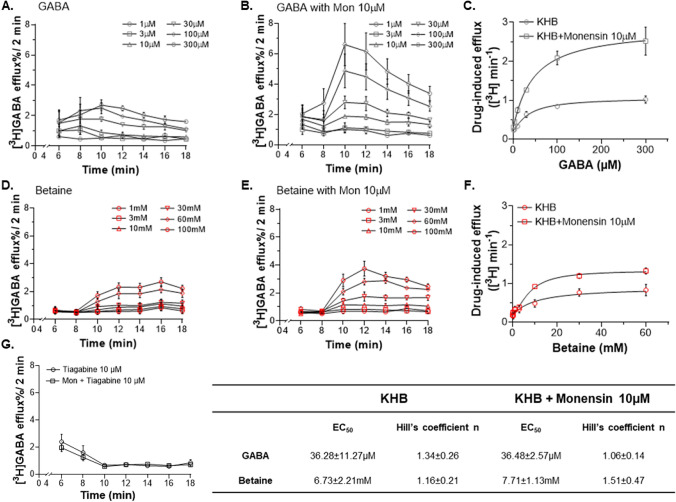
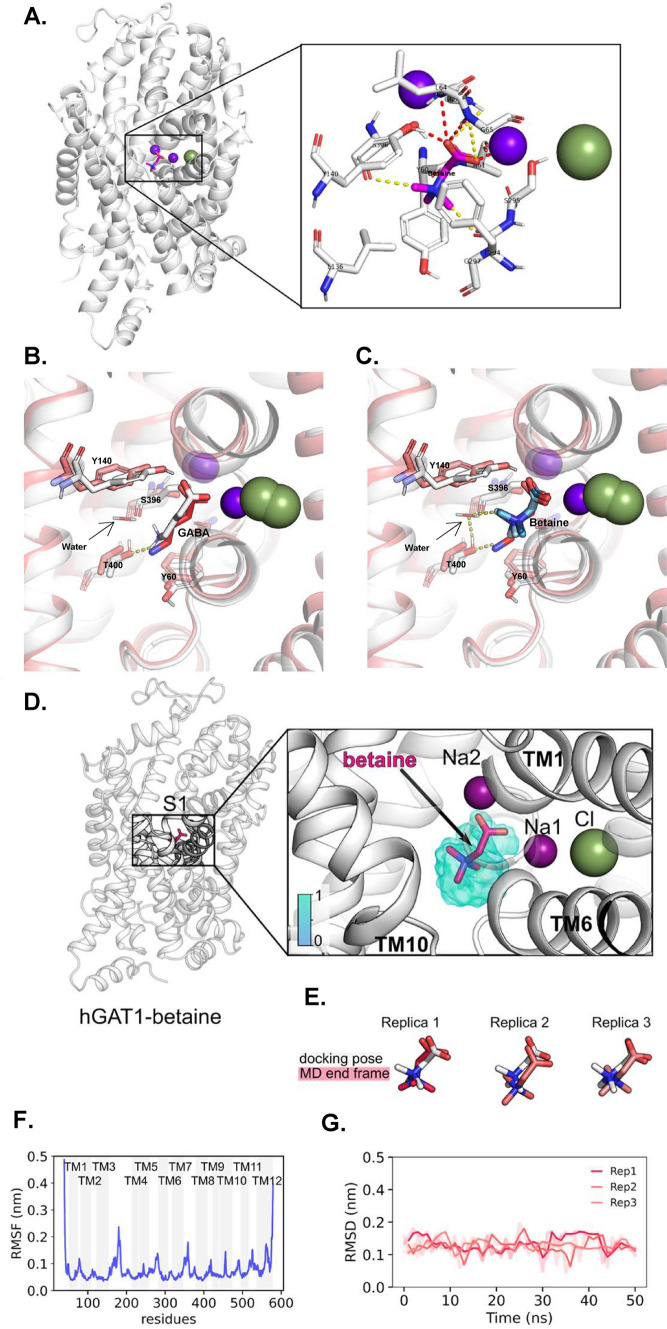
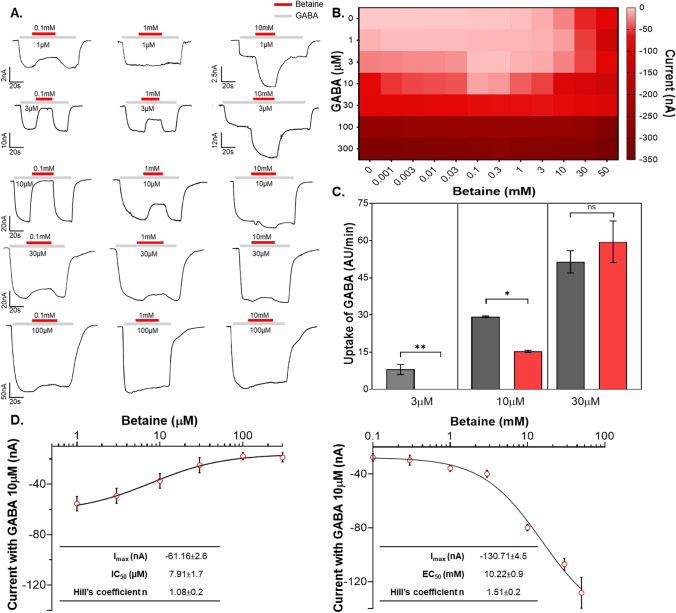
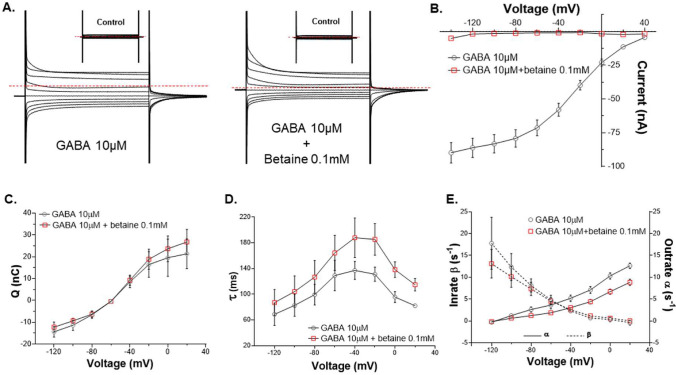
Betaine is an endogenous osmolyte that exhibits therapeutic potential by mitigating various neurological disorders. However, the underlying cellular and molecular mechanisms responsible for its neuroprotective effects remain puzzling.In this study, we describe a possible mechanism behind the positive impact of betaine in preserving neurons from excitotoxicity. Here we demonstrate that betaine at low concentration modulates the GABA uptake by GAT1 (slc6a1), the predominant GABA transporter in the central nervous system. This modulation occurs through the temporal inhibition of the transporter, wherein prolonged occupancy by betaine impedes the swift transition of the transporter to the inward conformation. Importantly, the modulatory effect of betaine on GAT1 is reversible, as the blocking of GAT1 disappears with increased extracellular GABA. Using electrophysiology, mass spectroscopy, radiolabelled cellular assay, and molecular dynamics simulation we demonstrate that betaine has a dual role in GAT1: at mM concentration acts as a slow substrate, and at µM as a temporal blocker of GABA, when it is below its K0.5. Given this unique modulatory characteristic and lack of any harmful side effects, betaine emerges as a promising neuromodulator of the inhibitory pathways improving GABA homeostasis via GAT1, thereby conferring neuroprotection against excitotoxicity.

Keywords: Betaine; E/I balance; GABA; GABA transporters; Neurological disorders; SLC6a1; Temporal inhibition.


Conflict of interest statement

AB and RZ were employed by Nanion technologies GmbH. The remaining authors declare that the research was conducted in the absence of any commercial or financial relationships that could be construed as a potential conflict of interest.

Figures

Fig. 1
Fig. 1
Betaine induces concentration- and sodium-dependent inward currents in Xenopus laevis oocytes expressing rGAT1, which can be blocked by SKF89976a. A Representative traces of current recorded for GABA 300 µM and increasing betaine concentration (0.3–10 mM) in non-injected control oocytes, oocytes expressing cBGT-1, and rGAT1 (top to down). B A violin scattered plot shows the concentration-dependent response of betaine (0.1–50 mM) in rGAT1. The current values are shown as mean ± SEM of 21/5 n (number of oocytes)/N (number of batches). C The kinetic analysis of the betaine transport in rGAT1 yielded Imax = −76.16 ± 1.12 nA, K0.5 = 11.57 ± 1.28 mM, (see Table). In the inset, for cBGT-1 the parameters were Imax = −23.01 ± 1.21 nA, K0.5 = 1.69 ± 0.21 mM. All data were fitted using logistic fit model, with current values shown as mean ± SEM of 8/3 n/N. D A representative trace of currents recorded for GABA 300 µM and betaine 10 mM in the presence of ND98, TMA98, and ND98 + SKF89976a 30 µM. E The histogram shows the mean values of the currents recorded as reported in D, the Na+ dependence, and the blocking effect of SKF89976a 30 µM on the inward induced currents by GABA 300 µM and betaine 10 mM. Current values are shown as mean ± SEM of 8/3 n/N. All recordings were performed at holding potential Vh = -60 mV
Fig. 2
Fig. 2
The pre-steady state analysis of betaine transport by rGAT1. The current response for each condition was collected by giving 0.8 s long squared pulse at –20 mV of from the holding potential of −60 mV, starting from −140 mV to + 40 mV. A The representative traces of the voltage-step response for ND98, GABA 300 µM, SKF89976a 30 µM, and different indicated betaine concentrations. The dashed red line indicates the holding current for the oocyte at the holding potential. B The current and voltage (I–V) relationship from −140 mV to + 40 mV. C The total charge dislocation and voltage (Q–V) relationship. D The decay time constant and voltage (τ–V) relationship. E The relationships of unidirectional rate constants outrate (α) and inrate (β, shown as dashed line) with voltage. All the reported values were collected in the presence of ND98 alone and with betaine 0.1, 1, 10, 50 mM. In CE the voltage levels tested were from −120 mV to + 20 mV. For BE, all values are shown as mean ± SEM of 3/1 n/N
Fig. 3
Fig. 3
Detection of GABA and betaine transport by rGAT1 using the LC–MS/MS protocol on X. laevis oocytes. A A cartoon of the protocol developed to extract the cytosol contents of the oocytes and detect the presence of the substrate of interest. B A representative trace showing the presence of GABA in rGAT1 expressing oocytes incubated in GABA 1 mM. The histogram on the right shows a qualitative measurement of a concentration-dependent GABA uptake by rGAT1 expressing oocytes incubated in different GABA concentrations (1–300 µM). C A representative trace showing the presence of betaine in rGAT1 expressing oocytes incubated in betaine 30 mM. The histogram on the right shows the qualitative measurement of a concentration-dependent betaine uptake by rGAT1 expressing oocytes incubated in different betaine concentrations (0.1–30 mM). All values are shown as arbitrary units per minute per oocyte ± SEM of 15/2 n/N. The table at the bottom shows the collision energy required to obtain a unique production ion and the retention time (in the 15-min-long protocol) for the detection of the peak correlated to GABA and betaine
Fig. 4
Fig. 4
Betaine induces efflux of [3H]-GABA in pre-loaded HEK293 cells overexpressing rGAT1. A Time course of the efflux of [3H]-GABA in the presence of increasing GABA concentrations (1–300 µM). B Time course of the efflux of [3H]-GABA in the presence of monensin 10 µM and different GABA concentrations (1–300 µM). C The kinetic analysis of the [3H]-GABA-induced efflux with and without monensin 10 µM. D Time course of the efflux of [3H]-GABA in the presence of different betaine concentrations (1–100 mM). E Time course of the efflux of [3H]-GABA in the presence of monensin 10 µM and different betaine concentrations (1–100 mM). F The kinetic analysis of the [3H]-GABA-induced efflux with and without monensin 10 µM. G Time course of the efflux of [3H]-GABA in the presence of tiagabine 10 µM with and without monensin 10 µM. All GABA and betaine solutions were prepared using KHB as the buffer solution. Data were fitted using logistic fit model and values are shown in the table at the bottom. Data are mean ± SEM from three individual experiments, performed in duplicate
Fig. 5
Fig. 5
Molecular docking and MD simulation of betaine and GABA in hGAT1 show that betaine stably binds to GAT1 and forms less polar contacts than GABA. A The successful docking of betaine in hGAT1 with zoomed-in view of the binding site. B The overlapping of GABA-bound hGAT1 Alphafold in outward-open (in white) with cryo-Em structure of the hGAT1 in the inward-occluded (PDB: 7Y7W, in red) with zoomed-in view of the GABA binding site, in the presence of water molecule stabilized by T400 shown in yellow dashed line. C The same overlapping for betaine-bound structure shows the tail of betaine forming hydrogen-bond with water molecule that is stabilized by carboxyl head of T400 shown in yellow dashed line. D MD simulation results for hGAT1 in the outward open conformation bound to betaine is with a zoomed-in view as the S1-site. The average occupancy from three simulations is visualized using an isosurface, color-coded according to the legend. E The docking poses (in white) and the respective end structures (in light red) at 50 ns resulting from MD simulations. F The root mean square displacement of each replica smoothened with a running average over 2 ns. G. The root mean square fluctuation of hGAT1 residues by plotting a mean root mean square fluctuations value from the three replicas, emphasizing residues belonging to TM helices with a grey bar. In panel A, the short-range contacts (d < 3 Å) are indicated as red dashed lines and medium-range contacts (3 Å < d < 5 Å) as yellow dashed lines. The representation illustrated includes hGAT1 as ribbons (in AD: outward-open in white. In C: inward-occluded in red), betaine and GABA shown as sticks, and Na+ (purple) and Cl (green) as spheres
Fig. 6
Fig. 6
Betaine has a dual role in rGAT1, a GABA inhibitor at low concentrations and a secondary substrate at higher concentrations. A Representative traces of GABA betaine assay in X. laevis oocytes expressing rGAT1 at holding potential Vh =  − 60 mV, where the oocyte was perfused with different GABA concentrations (1, 3, 10, 30, 100 μM) along with betaine 0.1, 1, and 10 mM. B The heatmap analysis of the GABA betaine competitive assay shows their concentration-dependent relationship, using the combination of GABA (1–300 μM) with betaine (0.001–50 mM). Data are shown as mean ± SEM of 6/2 n/N. C Detection of GABA and betaine in the oocytes incubated in GABA 3, 10, 30 µM with betaine 0.1 mM, using LC–MS/MS protocol. The qualitative analysis of GABA and betaine uptake by the oocytes is represented in this bar plot with the uptake values, as arbitrary units, of each oocyte per minute, data shown with SEM and obtained from n = 3 with five oocytes in each sample. The p values were obtained by ordinary one-way ANOVA method followed by Bonferroni’s multiple comparisons test, with a single pooled variance with statistical significance of p < 0.05. D The kinetic analysis of different betaine concentrations (0.001–50 mM) with GABA 10 μM shows the dual behaviour of betaine in rGAT1, as at the lower concentrations (left) the GABA transport current is reduced with an increase in betaine, and at the higher concentration (right) the total transport current increases. All data were fitted using the logistic fitting model, fitting values shown in the inset, and current values shown as mean ± SEM of 6/2 n/N
Fig. 7
Fig. 7
Betaine inhibits the GABA uptake by slowing down the transport cycle of rGAT1. A The representative traces of the voltage-step response, from −140 mV to + 40 mV of the oocyte expressing rGAT1, at holding potential Vh = −60 mV, with non-saturating GABA 10 μM (left) and GABA 10 μM + betaine 0.1 mM (right), the dashed red line indicates the holding current for the oocyte at the holding potential. B The current and voltage relationship of GABA 10 μM alone and with betaine 0.1 mM, from −120 mV to + 20 mV, shows the transport current reduction at all voltages. C The total charge dislocation and voltage relationship of GABA 10 μM alone and with betaine 0.1 mM, from −120 mV to + 20 mV shows more charge dislocation happening in the presence of betaine. D The total decay time constant and voltage relationship of GABA 10 μM alone and with betaine 0.1 mM, from −120 mV to  + 20 mV shows slowing down of the transport cycle in the presence of betaine. E The relationships of unidirectional rate constants outrate (α) and inrate (β, shown as dashed line) with voltage for GABA 10 μM alone and with betaine 0.1 mM, from −120 mV to + 20 mV. β in the presence of betaine does not decrease, but α decreases significantly at positive membrane potentials. All current responses were collected by giving 0.8 s long squared pulse at −20 mV of voltage jump. All current values shown as mean ± SEM of 3/1 n/N. The p values were obtained by the two-tailed p test with statistical significance of p < 0.05

References

    1. Lever M, Slow S. The clinical significance of betaine, an osmolyte with a key role in methyl group metabolism. Clin Biochem. 2010;43(9):732–744. doi: 10.1016/j.clinbiochem.2010.03.009. - DOI - PubMed
    1. Craig SAS. Betaine in human nutrition. Am J Clin Nutr. 2004;80:539–549. doi: 10.1093/ajcn/80.3.539. - DOI - PubMed
    1. Arumugam MK, et al. Beneficial effects of betaine: a comprehensive review. Biology (Basel) 2021 doi: 10.3390/biology10060456. - DOI - PMC - PubMed
    1. Bhatt M, et al. Betaine—the Dark Knight of the brain. Basic Clin Pharmacol Toxicol. 2023 doi: 10.1111/bcpt.13839. - DOI - PubMed
    1. Chai GS, et al. Betaine attenuates Alzheimer-like pathological changes and memory deficits induced by homocysteine. J Neurochem. 2013;124(3):388–396. doi: 10.1111/jnc.12094. - DOI - PubMed

LinkOut - more resources