. 2024 Jun 17;147(1):101.
doi: 10.1007/s00401-024-02751-9.

Brain vasculature accumulates tau and is spatially related to tau tangle pathology in Alzheimer's disease

Affiliations

Brain vasculature accumulates tau and is spatially related to tau tangle pathology in Alzheimer's disease

Zachary Hoglund et al. Acta Neuropathol. .

Abstract

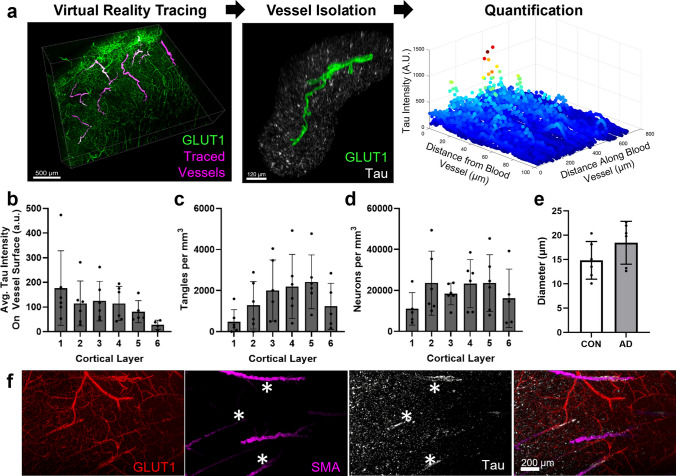
Insoluble pathogenic proteins accumulate along blood vessels in conditions of cerebral amyloid angiopathy (CAA), exerting a toxic effect on vascular cells and impacting cerebral homeostasis. In this work, we provide new evidence from three-dimensional human brain histology that tau protein, the main component of neurofibrillary tangles, can similarly accumulate along brain vascular segments. We quantitatively assessed n = 6 Alzheimer's disease (AD), and n = 6 normal aging control brains and saw that tau-positive blood vessel segments were present in all AD cases. Tau-positive vessels are enriched for tau at levels higher than the surrounding tissue and appear to affect arterioles across cortical layers (I-V). Further, vessels isolated from these AD tissues were enriched for N-terminal tau and tau phosphorylated at T181 and T217. Importantly, tau-positive vessels are associated with local areas of increased tau neurofibrillary tangles. This suggests that accumulation of tau around blood vessels may reflect a local clearance failure. In sum, these data indicate that tau, like amyloid beta, accumulates along blood vessels and may exert a significant influence on vasculature in the setting of AD.

Keywords: Alzheimer’s disease; Blood vessels; Cerebral amyloid angiopathy; Cerebral vasculature; Neurofibrillary tangles; Tau.


Conflict of interest statement

BTH has a family member who works at Novartis and owns stock in Novartis; he serves on the SAB of Dewpoint and owns stock. He serves on a scientific advisory board or is a consultant for AbbVie, Avrobio, Axon, Biogen, BMS Cell Signaling, Genentech, Ionis, Novartis, Seer, Takeda, the US Dept of Justice, Vigil, Voyager. His laboratory is supported by Sponsored research agreements with AbbVie, F Prime, and research grants from the Cure Alzheimer's Fund, Tau Consortium, and the JPB Foundation. REB works on the AbbVie-Hyman Collaboration. The other authors declare no competing interests.

Figures

Fig. 1
Fig. 1
Three-dimensional histology reveals the presence of vascular-associated tau. Confocal fluorescence microscopy images showing raw data from the inferior temporal gyrus of AD donors (ae) or a control (f, g). a Overview images of thick tissue immunolabeled for AT8 tau (white), vasculature (GLUT1, green) and neurons (HuD, magenta). be Examples of vascular tau accumulation (white) around blood vessels (green) from four different AD donors. f Overview images of thick tissue from a control donor immunolabeled as in panel A. Note the absence of tau labeling. g Example image of a comparable tau-negative blood vessel (green) from a control donor. Images from C–E and F show 40 µm thick z-slices
Fig. 2
Fig. 2
Examination of tau along individual blood vessels throughout the cortex. a An overall schema of the method used to quantify vascular tau. Blood vessels are first traced in virtual reality (magenta) and are shown overlying the original GLUT1-positive blood vessel imaging data (green). Tracing allows for the isolation of individual blood vessels and their surround, including tau pathology (white) ≤ 100 µm from the blood vessel surface (example is from AD 5 vessel 5). Subsequently, quantification of tau intensity along and away from the blood vessel surface was conducted. b Measures of the average tau intensity at the vessel surface (within 3 microns) per donor and cortical layer. Each dot represents the average of several measures along the length of individual vessels per donor (see Fig. 4B). c The average AT8-positive tangle density and (d) HuD-positive neuron density per cubic mm were also measured for each cortical layer. e The average diameter of vessels measured per donor. Dots represent individuals, bars represent means ± SEM. f Separate tissue labeled with antibodies to GLUT1, SMA, and tau show areas of tau accumulation on blood vessels that are also SMA-positive (indicated by asterisks)
Fig. 3
Fig. 3
CAA pathology and tau accumulation. a Tissue from donor AD 6 shows areas with leptomeningeal CAA pathology. An additional view of the area in the dashed box is shown in Supplementary Movie 1. b Tissue from donor AD 5 shows a rare CAA-positive vessel. Closeup of the dashed box shown in panel d. c Frequent CAA-positive vessels were observed in donor AD 1. A closeup of the region in the dashed box is shown in panel. e A region of a CAA-positive vessel with tau accumulation is indicated by the red arrow
Fig. 4
Fig. 4
Mapping tau accumulation on blood vessels. a Heatmaps showing log normalized tau intensity within 3 microns from the surface of each segmented blood vessel (n = 107 AD, n = 127 control). Rows are individual vessels and columns are tau intensity measures along the vessel length. Red asterisks highlight example vessels shown in panels C–H. b Data are binned every 10 microns along the blood vessel’s surface and shows the mean intensity of each bin, normalized to the mean tau intensity of the whole image. c, d, e Example of isolated blood vessel (green) and tau labeling (white). f, g, h Corresponding maps of tau intensity along the vessel surface. Color corresponds to percentiles (deciles)
Fig. 5
Fig. 5
Tau intensity is related to distance from the blood vessel surface. Blood vessel segments (10-micron bins, as shown in Fig. 4b) were grouped according to surface tau intensity by percentiles (deciles). The relative change in tau immunolabeling near these vessel segments was plotted as a function of distance from blood vessel surface. To allow comparison between donor samples, the values for each donor (colored coded) are normalized to the average tau intensity value in the whole image (background) such that a 0% change (gray dashed line) means the vascular tau labeling intensity is no different than the average intensity of tau in the whole image. Vessel segments in the top decile (90–100%) show greater than background tau intensity near the vessel surface whereas other deciles reduced or no difference in intensity near the vessel surface. Each point represents a measure at 1-micron intervals. Gray vertical bars indicate SEM
Fig. 6
Fig. 6
Post-translationally modified tau is enriched in AD blood vessels. a Isolation of blood vessels from the inf. temp. gyrus of n = 3 control and n = 5 AD brains shows that tau is enriched in vasculature and can be visualized with multiple antibodies including total tau = DAKO rabbit polyclonal. Quantification of total signal per lane for (b) total tau, (c) Tau13 n-terminal antibody, (d) Tau46 c-terminal antibody, (e) phospho-T181 tau, (f) phospho-S202 tau, (g) phospho-T217 tau and (h) phospho-T231 tau. The AD donor that is Braak III is labeled in red. All values normalized to the average of controls. One-tailed t-test *p < 0.05, **p < 0.01. Error bars = means ± SEM
Fig. 7
Fig. 7
NFT and neuron density analysis. Examples of blood vessels showing NFT accumulation near the blood vessel surface in samples (a) AD 2, (b) AD 1, (c) AD 6, and (d) control 3. e Isolated blood vessel with surrounding tau pathology (AT8, white) and surrounding neurons (HuD, magenta). f NFTs and neurons were identified and segmented using Ilastik. A visualization of segmentation masks was generated using Imaris and with a value of 1 μm to smooth the surfaces. g A custom MATLAB script was developed to calculate the distance of each segmented tangle and neuron from the surface of each blood vessel. Plots show the blood vessel (blue), its calculated centerline for object distance calculations (red), and objects colored according to their distance along the blood vessel. h Plot shows the percent of neurons with NFT in regions near (0–30 microns) blood vessels with varying amounts of surface tau. Repeated measures ANOVA p = 0.037, R2 = 0.47. Dots represent individuals, bars represent means ± SEM

Update of

References

    1. Arnold SE, Hyman BT, Flory J, Damasio AR, Van Hoesen GW. The topographical and neuroanatomical distribution of neurofibrillary tangles and neuritic plaques in the cerebral cortex of patients with Alzheimer's disease. Cereb Cortex. 1991;1:103–116. doi: 10.1093/cercor/1.1.103. - DOI - PubMed
    1. Arriagada PV, Growdon JH, Hedley-Whyte ET, Hyman BT. Neurofibrillary tangles but not senile plaques parallel duration and severity of Alzheimer's disease. Neurology. 1992;42:631–639. doi: 10.1212/wnl.42.3.631. - DOI - PubMed
    1. Bankhead P, Loughrey MB, Fernandez JA, Dombrowski Y, McArt DG, Dunne PD, et al. QuPath: open source software for digital pathology image analysis. Sci Rep. 2017;7:16878. doi: 10.1038/s41598-017-17204-5. - DOI - PMC - PubMed
    1. Barthelemy NR, Saef B, Li Y, Gordon BA, He Y, Horie K, et al. CSF tau phosphorylation occupancies at T217 and T205 represent improved biomarkers of amyloid and tau pathology in Alzheimer's disease. Nat Aging. 2023;3:391–401. doi: 10.1038/s43587-023-00380-7. - DOI - PMC - PubMed
    1. Bennett RE, Hu M, Fernandes A, Perez-Rando M, Robbins A, Kamath T, et al. Tau reduction in aged mice does not impact microangiopathy. Acta Neuropathol Commun. 2020;8:137. doi: 10.1186/s40478-020-01014-4. - DOI - PMC - PubMed

Publication types