. 2024 Jun;132(6):67004.
doi: 10.1289/EHP13947. Epub 2024 Jun 17.

Association of Residential Greenness Exposure with Depression Incidence in Adults 50 Years of Age and Older: Findings from the Cohort Study on Global AGEing and Adult Health (SAGE) in China

Affiliations

Association of Residential Greenness Exposure with Depression Incidence in Adults 50 Years of Age and Older: Findings from the Cohort Study on Global AGEing and Adult Health (SAGE) in China

Zhiqing Chen et al. Environ Health Perspect. 2024 Jun.

Abstract

Background: Depression is a social and public health problem of great concern globally. Identifying and managing the factors influencing depression are crucial for preventing and decreasing the burden of depression.

Objectives: Our objectives are to explore the association between residential greenness and the incidence of depression in an older Chinese population and to calculate the disease burden of depression prevented by greenness exposure.

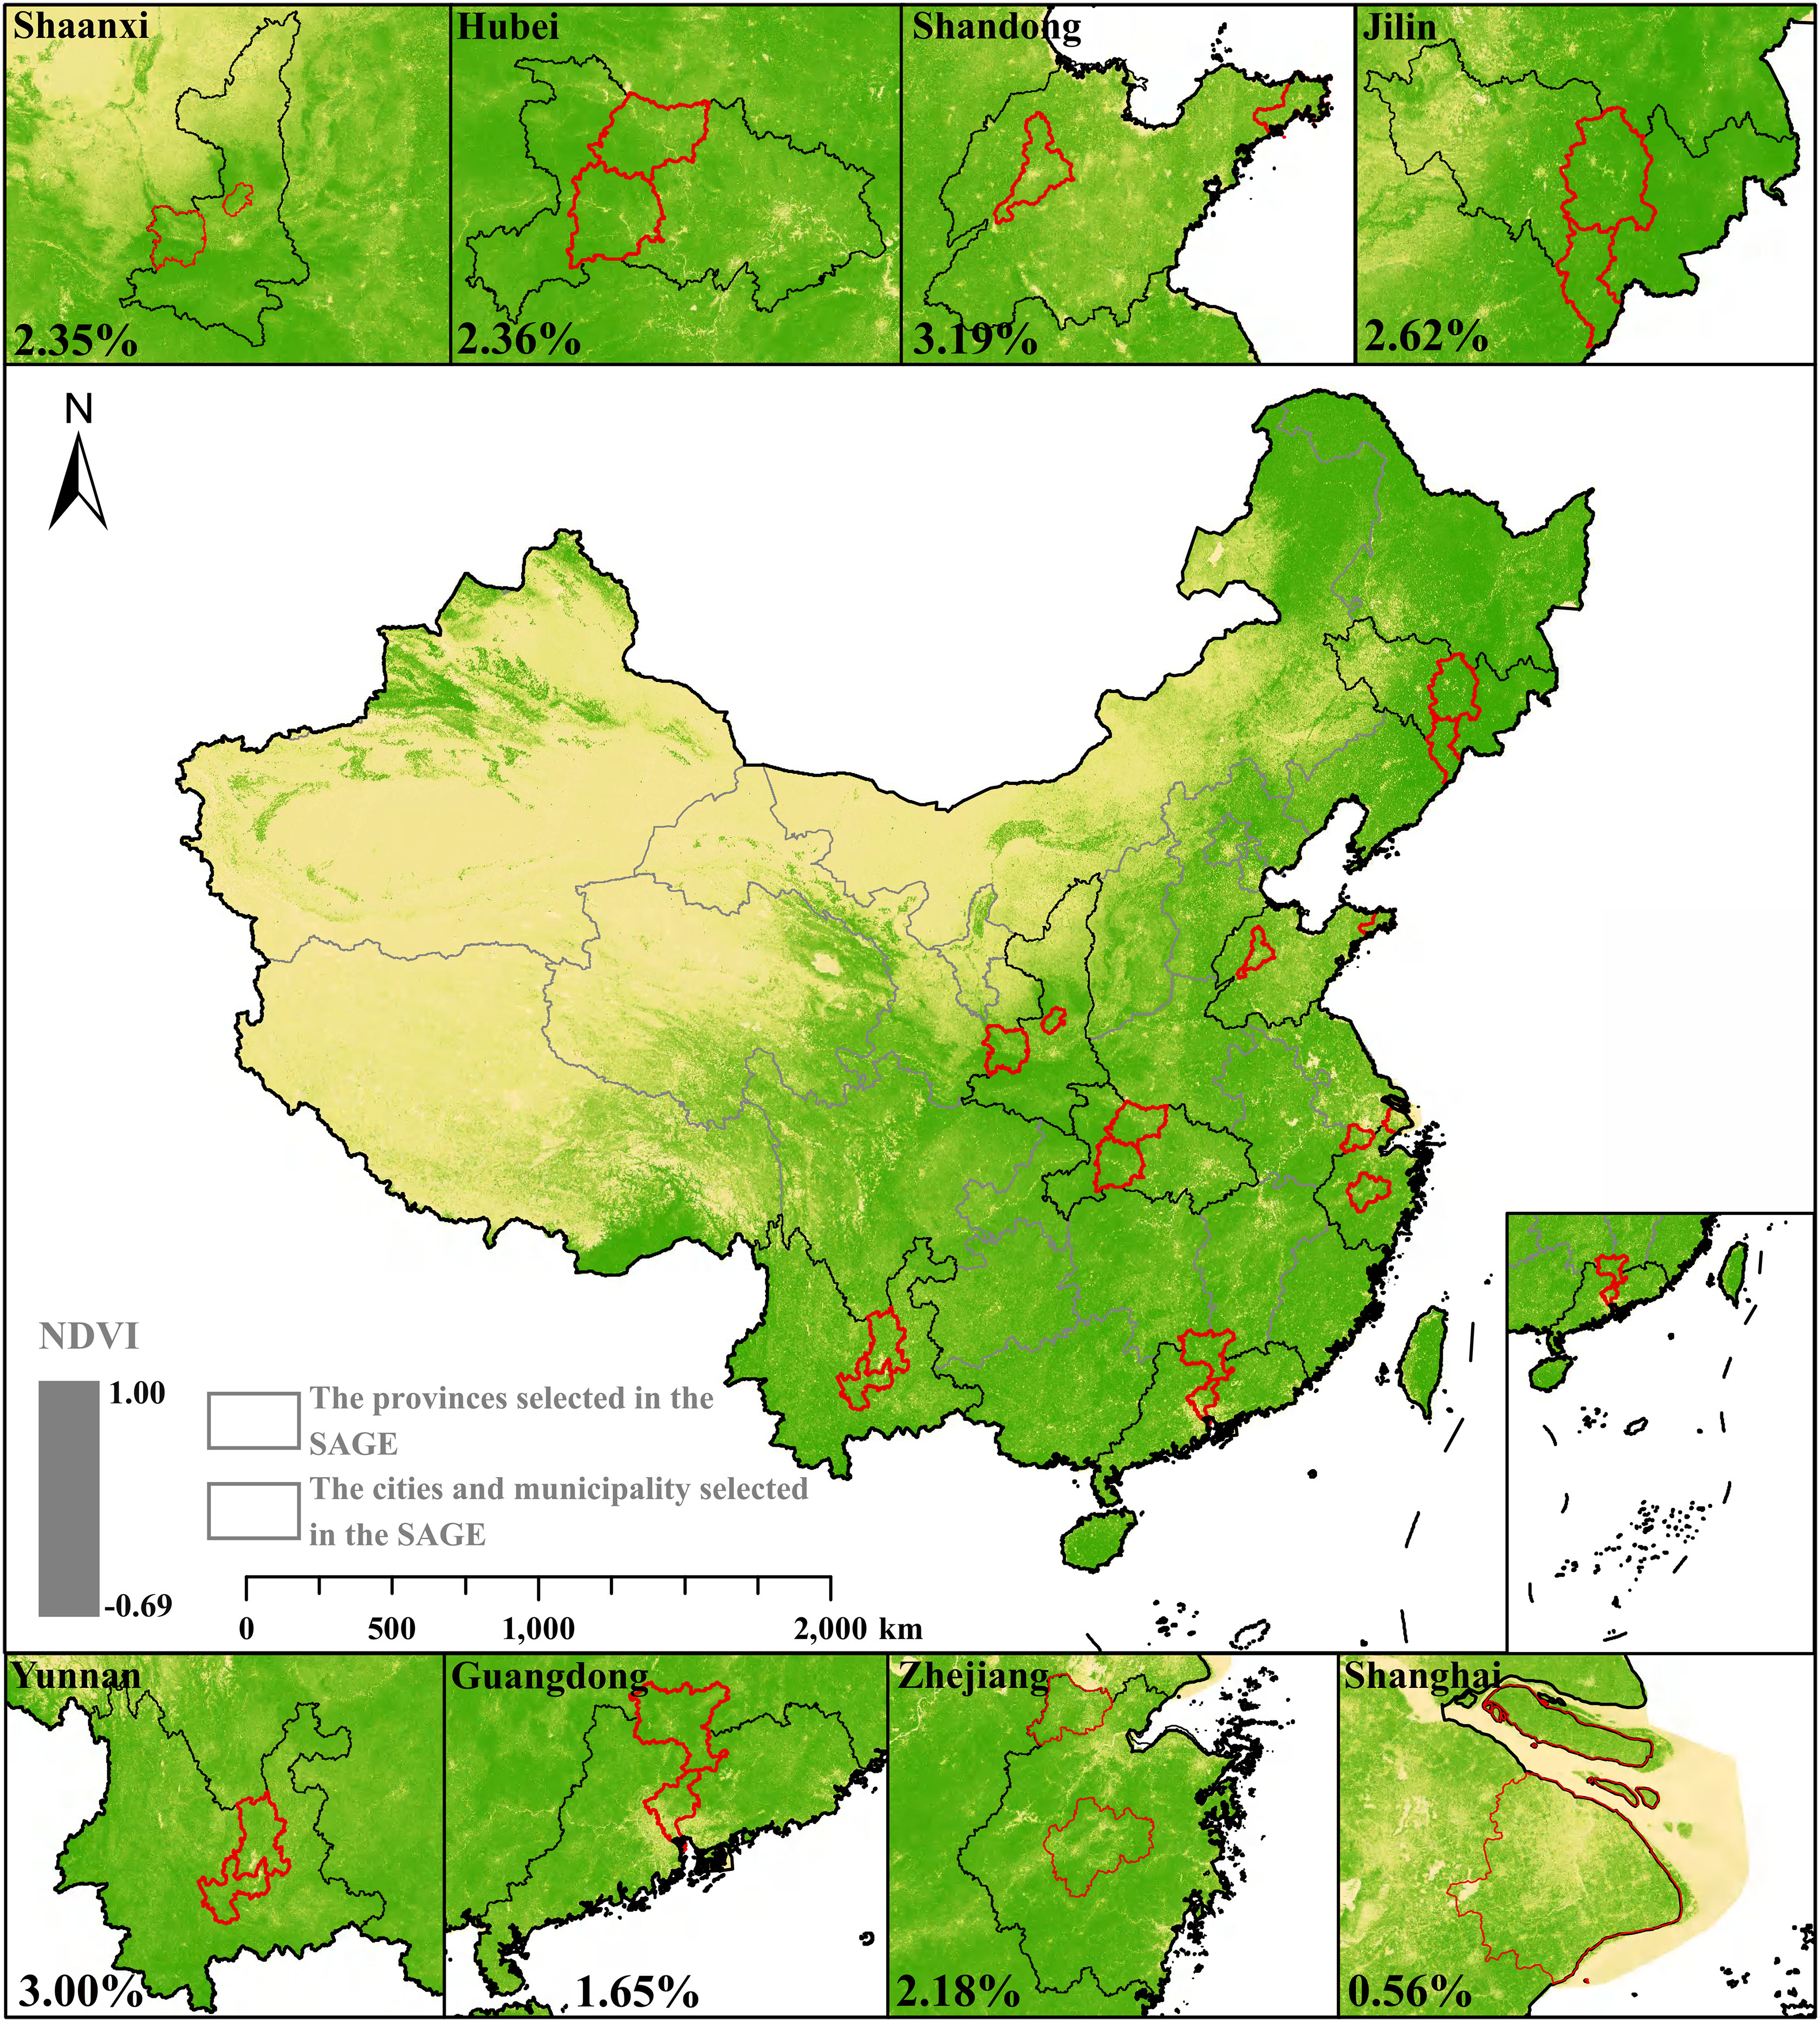
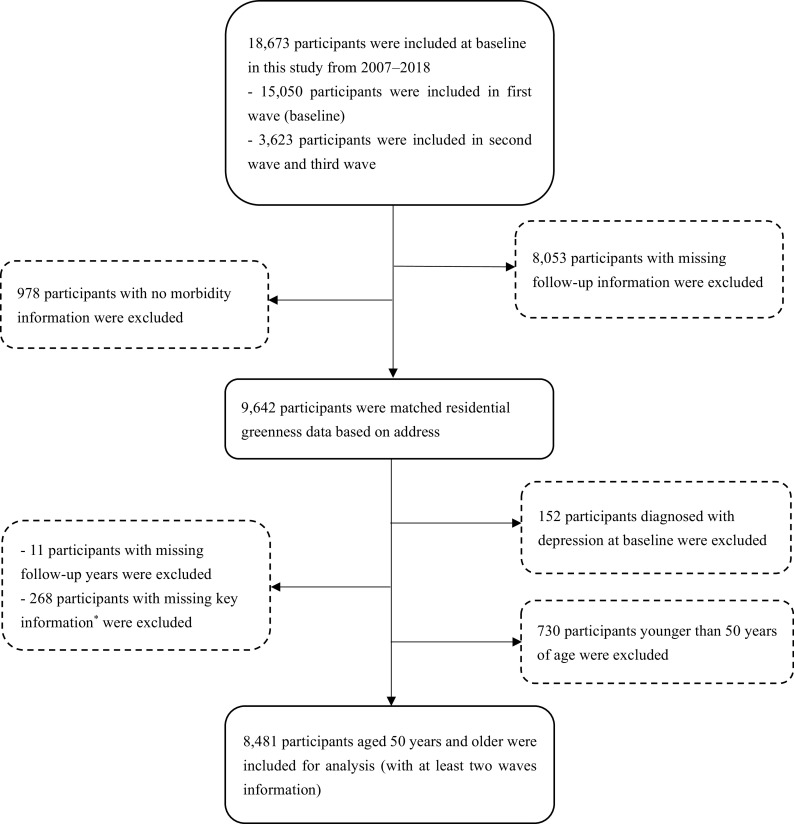
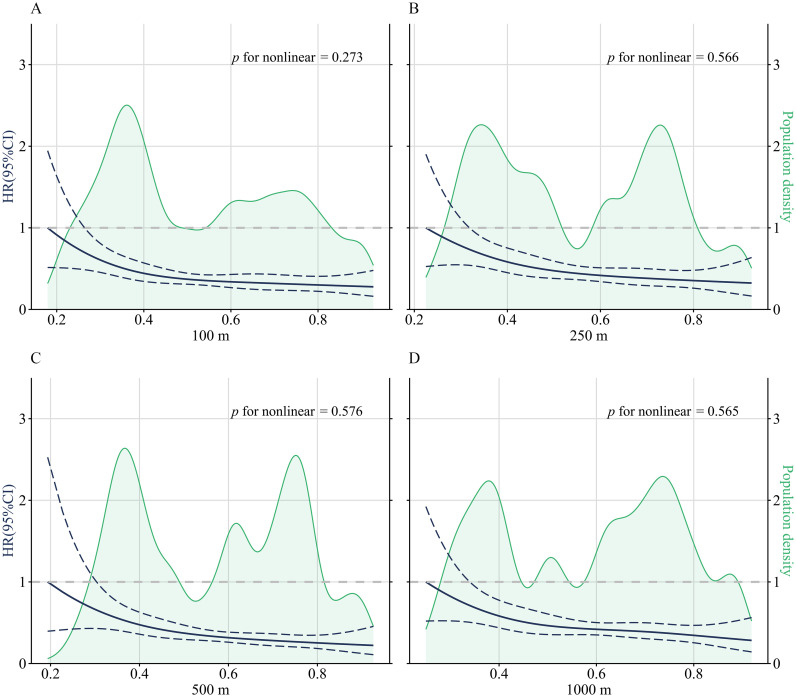
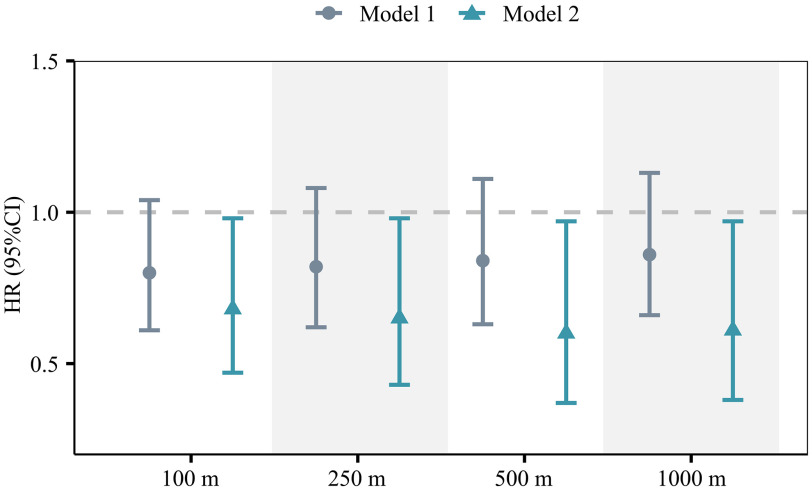
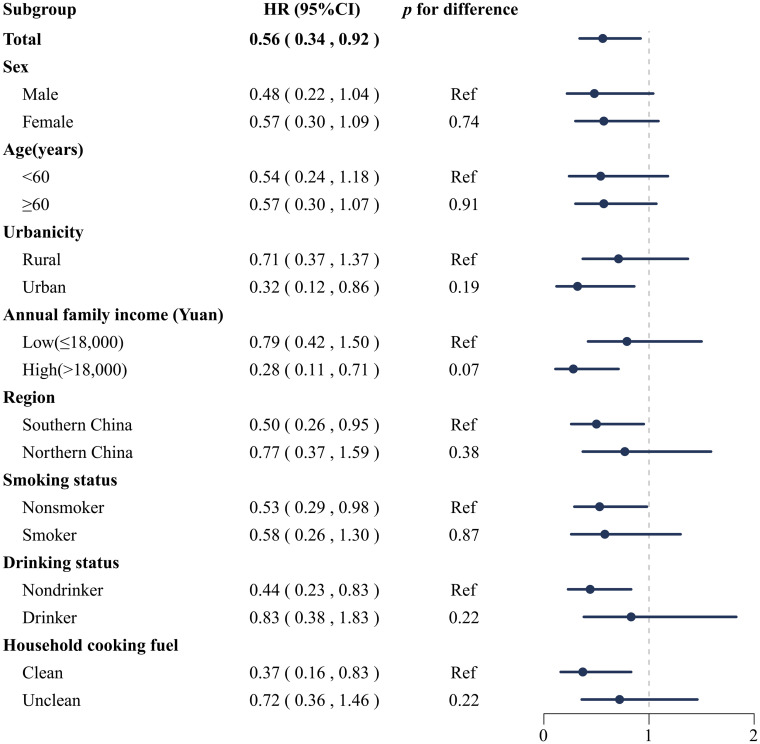
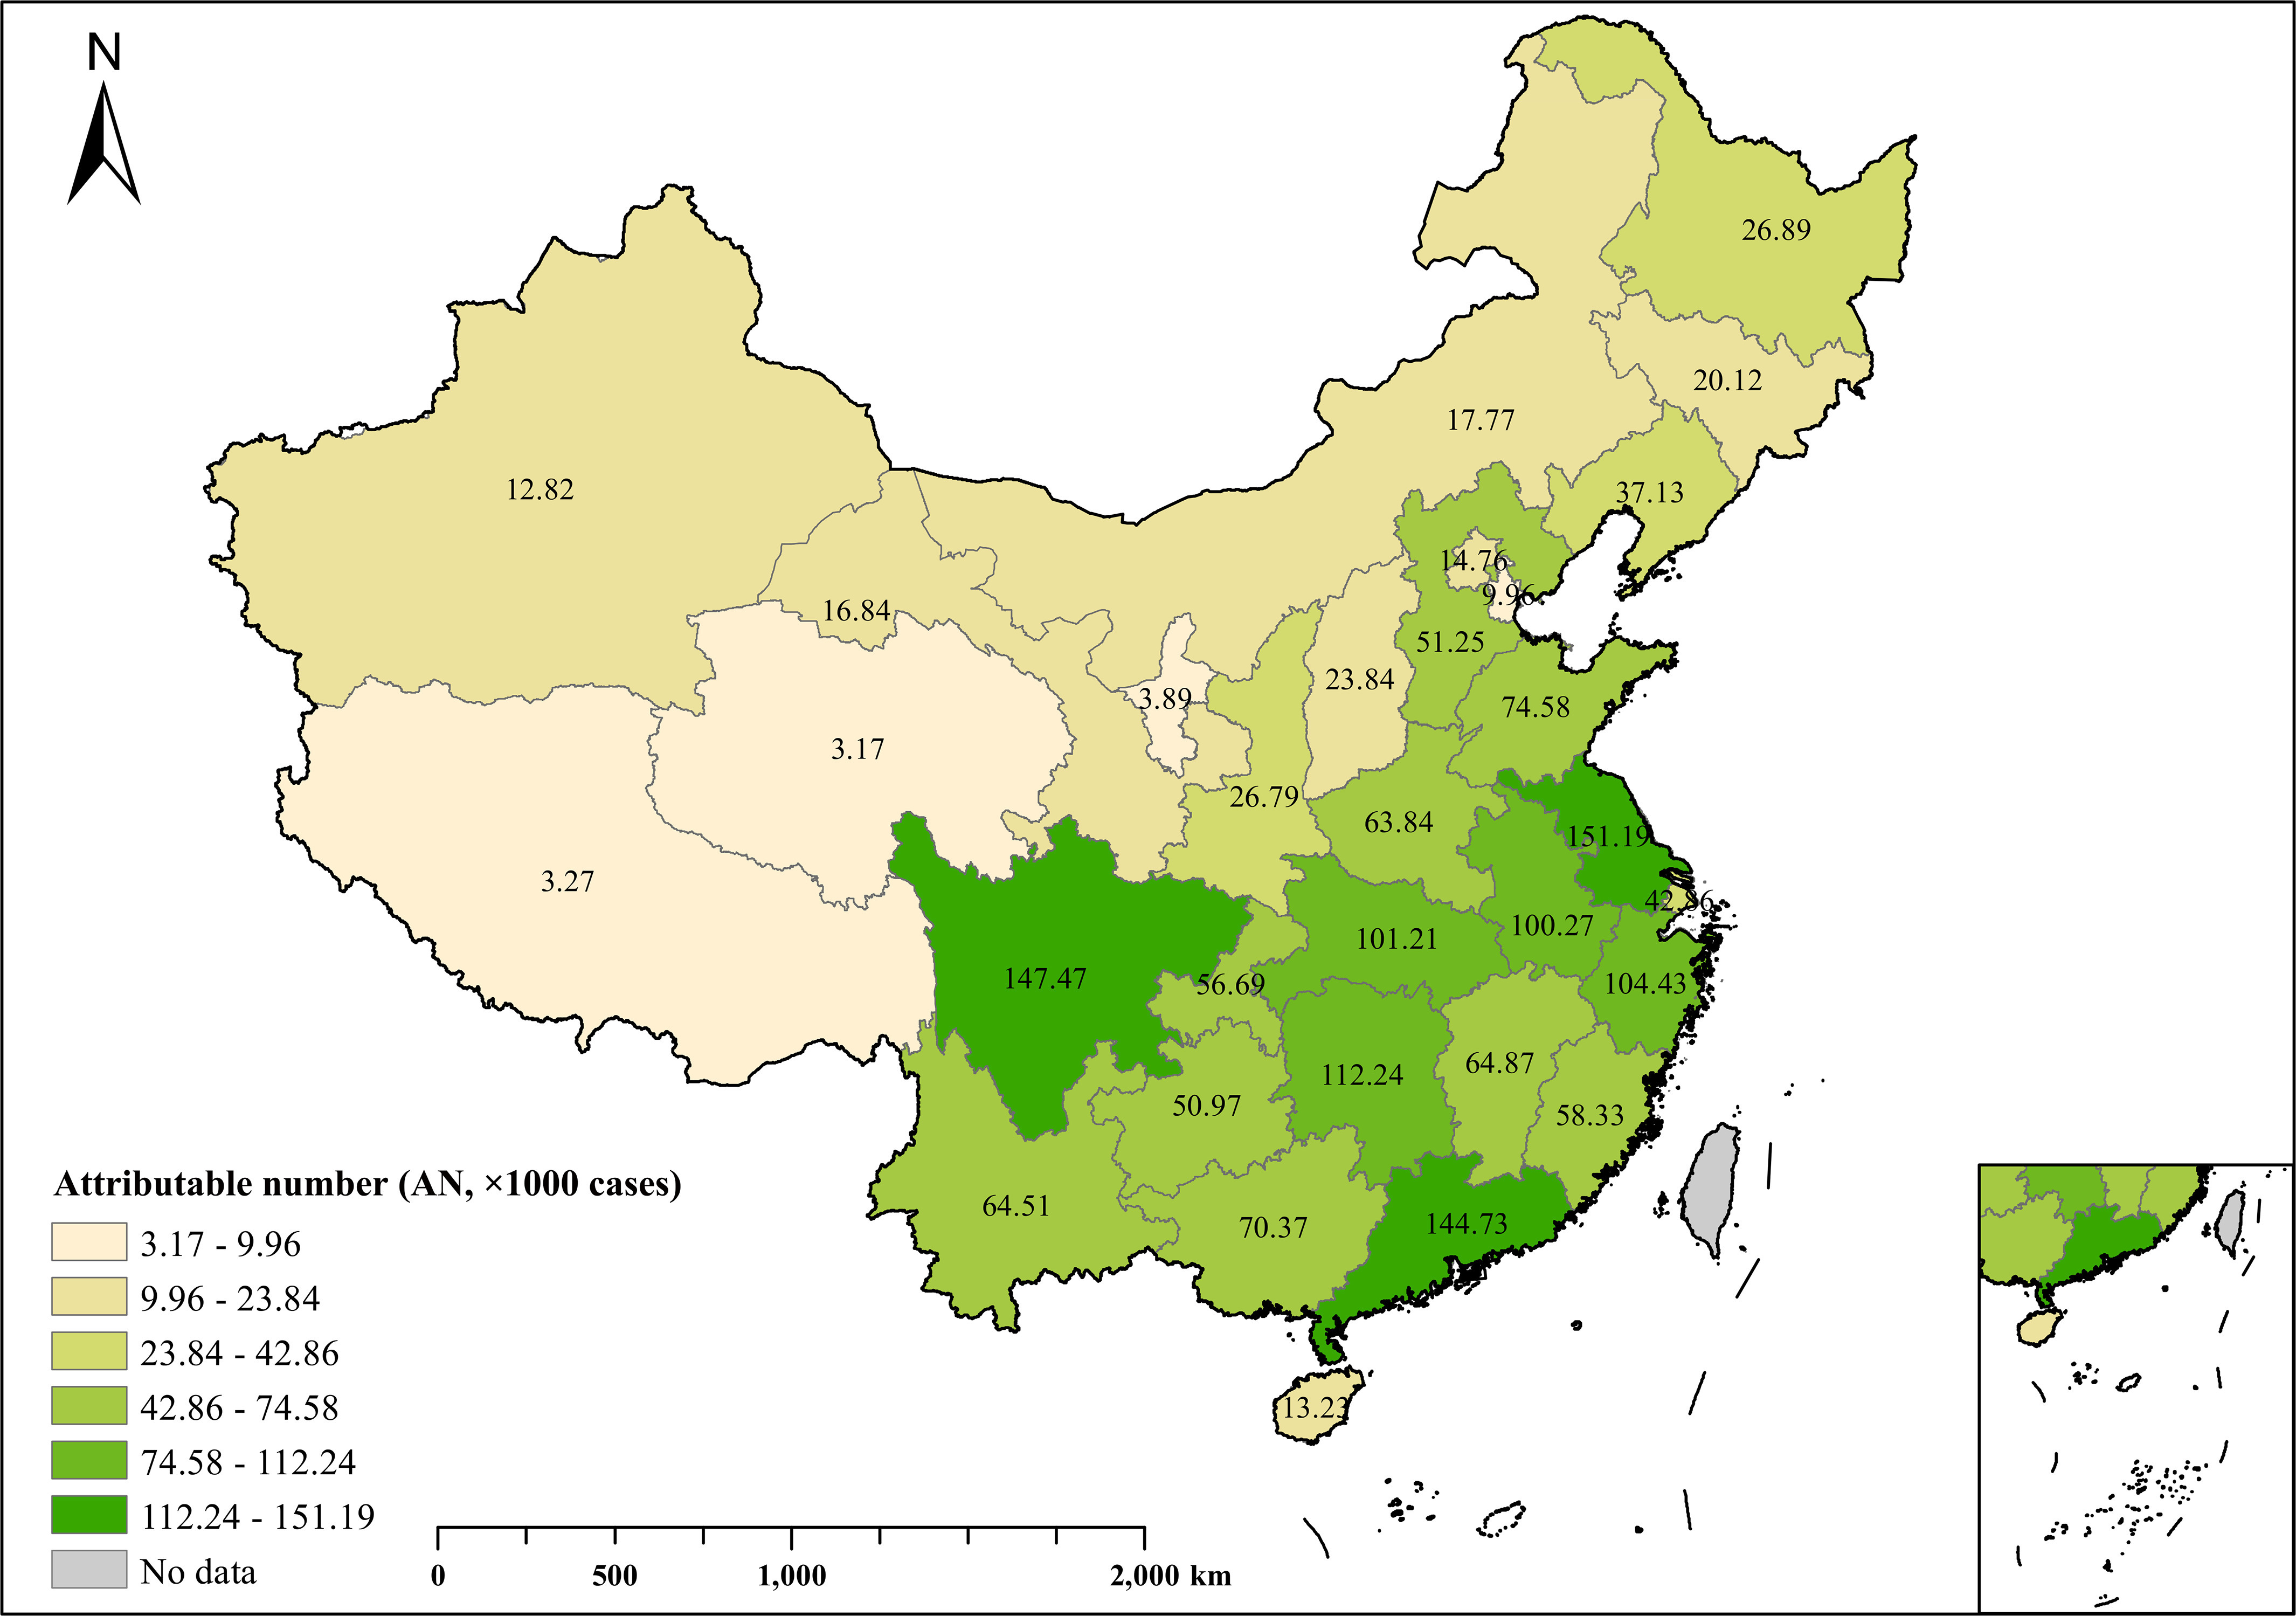
Methods: This study was the Chinese part of the World Health Organization Study on Global AGEing and Adult Health (WHO SAGE). We collected the data of 8,481 residents 50 years of age in China for the period 2007-2018. Average follow-up duration was 7.00 (±2.51) years. Each participant was matched to the yearly maximum normalized difference vegetation index (NDVI) at their residential address. Incidence of depression was assessed using the Composite International Diagnostic Interview (CIDI), self-reports of depression, and/or taking depression medication. Association between greenness and depression was examined using the time-dependent Cox regression model with stratified analysis by sex, age, urbanicity, annual family income, region, smoking, drinking, and household cooking fuels. Furthermore, the prevented fraction (PF) and attributable number (AN) of depression prevented by exposure to greenness were estimated.

Results: Residential greenness was negatively associated with depression. Each interquartile range (IQR) increase in NDVI 500-m buffer was associated with a 40% decrease [hazard ratio (HR)=0.60; 95% confidence interval (CI): 0.37, 0.97] in the risk of depression incidence among the total participants. Subgroup analyses showed negative associations in urban residents (HR=0.32; 95% CI: 0.12, 0.86) vs. rural residents, in high-income residents (HR=0.28; 95% CI: 0.11, 0.71) vs. low-income residents, and in southern China (HR=0.50; 95% CI: 0.26, 0.95) vs. northern China. Over 8.0% (PF=8.69%; 95% CI: 1.38%, 15.40%) and 1,955,199 (95% CI: 310,492; 3,464,909) new cases of depression may be avoided by increasing greenness exposures annually across China.

Discussion: The findings suggest protective effects of residential greenness exposure on depression incidence in the older population, particularly among urban residents, high-income residents, and participants living in southern China. The construction of residential greenness should be included in community planning. https://doi.org/10.1289/EHP13947.


Figures

Figure 1 is a map of China. At the center, the map depicts the annual average maximum normalized difference vegetation index during the Study on Global Ageing and Adult Health study period, including provinces where the study was conducted and cities and municipalities where the study was conducted. A scale depicts maximum normalized difference vegetation index ranges from negative 0.69 to 1.00 in increments of 1.31. A scale depicts the kilometer ranges from 0 to 1,000 in increments of 500 and 1,000 to 2,000 in increments of 1,000. On the top and bottom, there are four maps that display the percentage of each chosen province or municipality that represents the incidence rate of depression throughout the research period. The provinces are: Shaanxi with 2.35 percent, Hubei with 2.36 percent, Shandong with 3.19 percent, Jilin with 2.62 percent, Yunnan with 3.00 percent, Guangdong with 1.65 percent, Zhejiang with 2.18 percent, and Shanghai with 0.56 percent.
Figure 1.
Annual average maximum NDVI across China during the SAGE study period (2007–2018). In the figure, the color shades of yellow and green represent the NDVI, the black ranges represent the provinces where the study was conducted, and the red ranges represent the cities and municipality where the study was conducted. The percentage in each selected province/municipality indicates the incidence rate of depression during the study period. The figure was produced using R software based on the background map (https://www.resdc.cn), NDVI data (http://www.nesdc.org.cn), and results from the study. Note: NDVI, normalized difference vegetation index; SAGE, Study on Global Ageing and Adult Health.
Figure 2 is a flowchart with two steps. Step 1: 18,673 participants were included at baseline in this study from 2007 to 2018, including 15,050 participants in the first wave (the baseline) and 3,623 participants in the second wave and third wave. Out of 18,673 participants, 8,053 participants with missing follow-up information were excluded, and 978 participants with no morbidity information were excluded. There are 9,642 participants who were matched with residential greenness data based on address. Step 2: Out of 9642 participants, matched residential greenness data based on address: 152 participants diagnosed with depression at baseline were excluded; 11 participants with missing follow-up years were excluded; 268 participants with missing key information were excluded; and 730 participants younger than 50 years of age were excluded. There are 8,481 participants aged 50 years and older included for analysis (with at least two waves of information).
Figure 2.
The selection process of SAGE study participants in China. Missing key information includes drinking status (n=190), body mass index (n=47), household cooking fuel (n=20), annual family income (n=7), smoking status (n=3), and marital status (n=1). Note: SAGE, Study on Global Ageing and Adult Health.
Figures 3A to 3D are area plus line graphs, plotting hazard ratio (95 percent confidence interval), ranging from 0 to 3 in unit increments (left y-axis) and Population density, ranging from 0 to 3 in unit increments (right y-axis) across exposure–response curve of normalized difference vegetation index, ranging from 0.2 to 0.8 in increments of 0.2; 0.2 to 0.8 in increments of 0.2; 0.2 to 0.8 in increments of 0.2; and 0.4 to 0.8 in increments of 0.2 (x-axis) for nonlinear relationship, respectively.
Figure 3.
Exposure–response curve of NDVI with depression incidence among SAGE participants in China (n=8,481). Adjustment for sex, age, marital status, urbanicity, education, annual family income, and region. A time-dependent Cox proportional hazards regression model with natural spline function (df=3) was used to analyze the nonlinear relationship. Likelihood ratio test was used to test the nonlinearity. The solid line is the HR, the dashed lines are the 95% CI of the HR, and the green shaded area represents the population density. (A) NDVI in 100-m buffer. (B) NDVI in 250-m buffer. (C) NDVI in 500-m buffer. (D) NDVI in 1,000-m buffer. Note: CI, confidence interval; df, degrees of freedom; HR, Hazard ratio; NDVI, normalized difference vegetation index; SAGE, Study on Global Ageing and Adult Health.
Figure 4 is an error bar graph, plotting hazard ratio (95 percent confidence interval), ranging from 0.5 to 1.5 in increments of 0.5 (y-axis) across meters, ranging from 100 to 250 in increments of 150, 250 to 500 in increments of 250, and 500 to 1,000 in increments of 500 (x-axis) for model 1 and model 2.
Figure 4.
Hazard ratios (HRs) and 95% confidence intervals (CIs) for the effect of residential greenness at different buffers on depression incidence (per IQR increase) among SAGE participants in China (n=8,481). Model 1 included crude models without controlling for any covariates. Model 2 included models adjusted for the covariates from the DAG, including sex, age, marital status, urbanicity, education, annual family income, and region. A time-dependent Cox proportional hazards regression model was used to analyze the linear relationship. The error bars in the figure are the 95% CI and the dots and triangles are the HR. Table S7 corresponds to this figure. Note: CI, confidence interval; DAG, directed acyclic graph; HR, hazard ratio; IQR, interquartile range; SAGE, Study on Global Ageing and Adult Health.
Figure 5 is a forest plot, plotting subgroup with hazard ratio (95 percent confidence interval) and difference, ranging as (bottom to top), Household cooking fuel, including clean with 0.37 (0.16, 0.83) and reference group and unclean with 0.72 (0.36, 1.46) and 0.22; drinking status, including nondrinker with 0.44 (0.23, 0.83) and reference group and drinker with 0.83 (0.38, 1.83) and 0.22; smoking status, including nonsmoker with 0.53 (0.29, 0.98) and reference group and smoker with 0.58 (0.26, 1.30) and 0.87; Region, including Southern China with 0.50 (0.26, 0.95) and reference group and Northern China with 0.77 (0.37, 1.59) and 0.38; Annual family income (Yuan), including low (less than or equal to 18,000) with 0.79 (0.42, 1.50) and reference group and high (greater than 18,000) with 0.28 (0.11, 0.71) and 0.07; Urbanicity, including Rural with 0.71 (0.37, 1.37) and reference group and Urban with 0.32 (0.12, 0.86) and 0.19; Age (years), including less than 60 with 0.54 (0.24, 1.18) and reference group and greater than or equal to 60 with 0.57 (0.30, 1.07) and 0.91; Sex, including male with 0.48 (0.22, 1.04) and reference group and female with 0.57 (0.30, 1.09) and 0.74; and total with 0.56 (0.34, 0.92) (y-axis) across depression incidence for residential greenness, ranging from 0 to 2 in unit increments (x-axis).
Figure 5.
The HRs and 95% CIs of depression incidence for residential greenness (each IQR increment in NDVI 500-m buffer) among SAGE participants in China (n=8,481). Adjustment for sex, age, marital status, urbanicity, education, annual family income, region, smoking status, drinking status, and household cooking fuel. In subgroup analyses, other confounders except for the subgroup category variable, analyzed as an independent variable, were adjusted for. A time-dependent Cox proportional hazards regression model was used. p For difference values were calculated by Z-tests. The error bars in the figure are its 95% CI, the dots are the HR. Note: CI, confidence interval; HR, hazard ratio; IQR, interquartile range; NDVI, normalized difference vegetation index; Ref, Reference group; SAGE, Study on Global Ageing and Adult Health.
Figure 6 is a map of China, depicting the number of new cases of depression averted by residential greenness exposure. The legend titled attributable number (A N, times 1,000 cases) is divided into seven parts: 3.17 to 9.96, 9.96 to 23.84, 23.84 to 42.86, 42.86 to 74.58, 74.58 to 112.24, 112.24 to 151.19, and no data. A scale depicts kilometer ranges from 0 to 1,000 in increments of 500 and 1,000 to 2,000 in increments of 1,000.
Figure 6.
New depression cases prevented by residential greenness exposure at the provincial level in China in 2020. In the figure, the numbers on the map represent AN. Unit: in thousands. The figure was produced using R software based on the background map (https://www.resdc.cn) and results from the study. Table S10 corresponds to this table. Hong Kong, Macau, and Taiwan were not in this analysis. Note: AN, attributable number.

Similar articles

Cited by

References

    1. Thapar A, Eyre O, Patel V, Brent D. 2022. Depression in young people. Lancet 400(10352):617–631, PMID: 35940184, 10.1016/S0140-6736(22)01012-1. - DOI - PubMed
    1. Smith MV, Mazure CM. 2021. Mental health and wealth: depression, gender, poverty, and parenting. Annu Rev Clin Psychol 17:181–205, PMID: 33962537, 10.1146/annurev-clinpsy-071219-022710. - DOI - PubMed
    1. COVID-19 Mental Disorders Collaborators. 2021. Global prevalence and burden of depressive and anxiety disorders in 204 countries and territories in 2020 due to the COVID-19 pandemic. Lancet 398(10312):1700–1712, PMID: 34634250, 10.1016/S0140-6736(21)02143-7. - DOI - PMC - PubMed
    1. Lu J, Xu X, Huang Y, Li T, Ma C, Xu G, et al. . 2021. Prevalence of depressive disorders and treatment in China: a cross-sectional epidemiological study. Lancet Psychiatry 8(11):981–990, PMID: 34559991, 10.1016/S2215-0366(21)00251-0. - DOI - PubMed
    1. Braw Y, Aviram S, Bloch Y, Levkovitz Y. 2011. The effect of age on frontal lobe related cognitive functions of unmedicated depressed patients. J Affect Disord 129(1–3):342–347, PMID: 20817307, 10.1016/j.jad.2010.07.032. - DOI - PubMed