Comparison of DeNovix, NanoDrop and Qubit for DNA quantification and impurity detection of bacterial DNA extracts
- PMID: 38885212
- PMCID: PMC11182499
- DOI: 10.1371/journal.pone.0305650
Comparison of DeNovix, NanoDrop and Qubit for DNA quantification and impurity detection of bacterial DNA extracts
Abstract
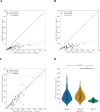
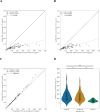
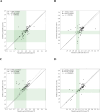
Accurate DNA quantification is key for downstream application including library preparations for whole genome sequencing (WGS) and the quantification of standards for quantitative PCR. Two commonly used technologies for nucleic acid quantification are based on spectrometry, such as NanoDrop, and fluorometry, such as Qubit. The DS-11+ Series spectrophotometer/fluorometer (DeNovix) is a UV spectrophotometry-based instrument and is a relatively new spectrophotometric method but has not yet been compared to established platforms. Here, we compared three DNA quantification platforms, including two UV spectrophotometry-based techniques (DeNovix and NanoDrop) and one fluorometry-based approach (Qubit). We used genomic prokaryotic DNA extracted from Streptococcus pneumoniae using a Roche DNA extraction kit. We also evaluated purity assessment and effect of a single freeze-thaw cycle. Spectrophotometry-based methods reported 3 to 4-fold higher mean DNA concentrations compared to Qubit, both before and after freezing. The ratio of DNA concentrations assessed by spectrophotometry on the one hand, and Qubit on the other hand, was function of the A260/280. In case DNA was pure (A260/280 between 1.7 and 2.0), the ratio DeNovix or Nanodrop vs. Qubit was close or equal to 2, while this ratio showed an incline for DNA with increasing A260/280 values > 2.0. The A260/280 and A260/230 purity ratios exhibited negligible variation across spectrophotometric methods and freezing conditions. The comparison of DNA concentrations from before and after freezing revealed no statistically significant disparities for each technique. DeNovix exhibited the highest Spearman correlation coefficient (0.999), followed by NanoDrop (0.81), and Qubit (0.77). In summary, there is no difference between DeNovix and NanoDrop in estimated gDNA concentrations of S. pneumoniae, and the spectrophotometry methods estimated close or equal to 2 times higher concentrations compared to Qubit for pure DNA.
Copyright: © 2024 Versmessen et al. This is an open access article distributed under the terms of the Creative Commons Attribution License, which permits unrestricted use, distribution, and reproduction in any medium, provided the original author and source are credited.
Conflict of interest statement
The authors have declared that no competing interests exist.
Figures


References
-
- Glasel JA. Validity of nucleic acid purities monitored by 260nm/280nm absorbance ratios. Biotechniques. 1995;18(1):62–3. - PubMed
-
- Hassan RMF, Husin AMMD, Sulong SP, Yusoff SP, Johan MFP, Yahaya BHP, et al.. Guidelines for nucleic acid detection and analysis in hematological disorders. The Malaysian Journal of Pathology. 2015;37(2):165–73. - PubMed
-
- Gallagher S. Quantitation of Nucleic Acids with Absorption Spectroscopy. Current protocols in protein science. 1998;13(1):A.4K.1–A.4K.3. - PubMed
Publication types
MeSH terms
Substances
LinkOut - more resources
Full Text Sources

