. 2024 Oct 15;84(20):3435-3446.
doi: 10.1158/0008-5472.CAN-23-4007.

Single-Stranded DNA Gap Accumulation Is a Functional Biomarker for USP1 Inhibitor Sensitivity

Affiliations

Single-Stranded DNA Gap Accumulation Is a Functional Biomarker for USP1 Inhibitor Sensitivity

Alexandre A da Costa et al. Cancer Res. .

Abstract

Recent studies suggest that PARP and POLQ inhibitors confer synthetic lethality in BRCA1-deficient tumors by accumulation of single-stranded DNA (ssDNA) gaps at replication forks. Loss of USP1, a deubiquitinating enzyme, is also synthetically lethal with BRCA1 deficiency, and USP1 inhibitors are now undergoing clinical development for these cancers. Herein, we show that USP1 inhibitors also promote the accumulation of ssDNA gaps during replication in BRCA1-deficient cells, and this phenotype correlates with drug sensitivity. USP1 inhibition increased monoubiquitinated proliferating cell nuclear antigen at replication forks, mediated by the ubiquitin ligase RAD18, and knockdown of RAD18 caused USP1 inhibitor resistance and suppression of ssDNA gaps. USP1 inhibition overcame PARP inhibitor resistance in a BRCA1-mutated xenograft model and induced ssDNA gaps. Furthermore, USP1 inhibition was synergistic with PARP and POLQ inhibition in BRCA1-mutant cells, with enhanced ssDNA gap accumulation. Finally, in patient-derived ovarian tumor organoids, sensitivity to USP1 inhibition alone or in combination correlated with the accumulation of ssDNA gaps. Assessment of ssDNA gaps in ovarian tumor organoids represents a rapid approach for predicting response to USP1 inhibition in ongoing clinical trials. Significance: USP1 inhibitors kill BRCA1-deficient cells and cause ssDNA gap accumulation, supporting the potential of using ssDNA gap detection as a functional biomarker for clinical trials on USP1 inhibitors.


Conflict of interest statement

J. Liu reports personal fees from AstraZeneca, Bristol Myers Squibb, Clovis Oncology, Daiichi Sankyo, Eisai, Genentech/Roche, GlaxoSmithKline, Regeneron Therapeutics, Revolution Medicine, Zentalis Pharmaceuticals, and Deciphera Pharmaceuticals outside the submitted work and institutional funding for clinical trials from 2X Oncology, Aravive, Arch Oncology, AstraZeneca, Bristol Myers Squibb, Clovis Oncology, GlaxoSmithKline, Impact Therapeutics, Regeneron, Seagen, Vigeo Therapeutics, and Zentalis Pharmaceuticals. G.I. Shapiro reports grants from Tango Therapeutics during the conduct of the study; grants and personal fees from Merck KGaA/EMD Serono; and grants from Bristol Myers Squibb, Merck & Co., Pfizer, Eli Lilly, Bicycle Therapeutics, Kymera Therapeutics, ImmunoMet, Concarlo Therapeutics, Janssen, and Xinthera outside the submitted work, as well as having a patent for Dosage regimen for sapacitabine and seliciclib, Cyclacel Therapeutics, and Compositions and methods for predicting response and resistance to CDK4/6 inhibition issued. L. Cornell has a patent for Dosage regimen for sapacitabine and seliciclib, Cyclacel Therapeutics, and Compositions and methods for predicting response and resistance to CDK4/6 inhibition issued. A.D. D’Andrea reports grants from Bristol Myers Squibb, EMD Serono, Moderna, and Tango Therapeutics; personal fees and other support from Impact Therapeutics, PrimeFour Therapeutics, and Covant Therapeutics; and personal fees from Servier Bio-Innovation LLC outside the submitted work. No disclosures were reported by the other authors.

Figures
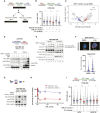
Figure 1.
Figure 1.
USP1 inhibitor treatment results in accumulation of ssDNA gaps in a RAD18-dependent manner. A and B, DNA fiber assays with or without S1 nuclease treatment for analysis of ssDNA gaps. A, Representative images of the DNA fibers showing presence or absence of ssDNA gaps after S1 nuclease treatment are shown. Top, schematics of nascent DNA labeling with two nucleotide analogs CldU and IdU in presence or absence of drugs (olaparib or I-138), followed by incubation with or without S1 nuclease. Reduction in IdU length after S1 nuclease treatment indicates presence of ssDNA gaps in UWB1.289 cells. B, Bottom, quantification of the IdU tract lengths evaluating the presence or absence of ssDNA gaps. Each dot indicates one fiber; at least 200 fibers were analyzed per condition. The horizontal bars indicate the median of the IdU tract lengths in each experimental condition. C, Volcano plot showing genes targeted by sgRNAs that differentially dropped out (blue) or became enriched (red) in USP1 inhibitor (TNG0869) versus DMSO-treated UWB1.289 cells in a CRISPR screen. D, aniPOND analysis of MDA-MB-436 cells after treatment with I-138 (1 µmol/L) or DMSO for 4 hours. Top, schematic of the drug treatment and nascent DNA labeling with EdU in MDA-MB-436 cells. Bottom, Western blots of input or captured proteins showing that RAD18, USP1, and Ub-PCNA proteins are enriched at the replication fork after treatment with I-138. E, Western blots of the soluble and chromatin fractions from MDA-MB-436 cells treated with USP1 inhibitor I-138 for 4 hours. F, Top, representative immunofluorescence images of the proximity ligation–based assay (PLA) foci in MDA-MB-436 cells depicting increased localization of RAD18 at the EdU-labeled nascent DNA after I-138 treatment. Bottom, quantification of proximity ligation–based assay foci per cell nucleus in DMSO- or I-138–treated cells. Between 100 and 300 cells were analyzed per condition. G, Top, schematic of PCNA regulation through ubiquitination by RAD18 and deubiquitination by USP1. Bottom, Western blots of the lysates from MDA-MB-436 cells after transfection with siCtrl or siRAD18, followed by treatment with the USP1 inhibitor I-138 for 24 hours. H, Clonogenic survival assays of siCtrl or siRAD18 transfected UWB1.289 cells in presence of a USP1 inhibitor I-138. Graphical quantitation of the proportion of colonies from cells treated with increasing concentrations of the USP1 inhibitor I-138 compared with control cells treated with DMSO is shown. UWB1.289 cells were transfected with siCtrl or siRAD18 and treated in six-well plates for 10 days with I-138. I, DNA fiber assays with or without S1 nuclease treatment for analysis of ssDNA gaps. Top, schematics of nascent DNA labeling with two nucleotide analogs CldU and IdU in presence or absence of I-138, followed by incubation with or without S1 nuclease in UWB1.289 cells after transfection with siCtrl or siRAD18. Bottom, quantification of the IdU tract lengths evaluating the presence or absence of ssDNA gaps. Each dot indicates one fiber; at least 200 fibers were analyzed per condition. The horizontal bars indicate the median of the lengths in each experimental condition as described on the bottom. P values were calculated using the Mann–Whitney test. *, P > 0.05; ***, P < 0.001.
Figure 2.
Figure 2.
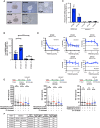
USP1 inhibition results in ssDNA gap accumulation and killing of BRCA1-deficient ovarian cancer patient-derived organoids. A, Representative images of the morphology of ovarian cancer patient-derived organoids. B, Quantitation of RAD51 foci and γH2AX foci in DF4104 (BRCA1-WT) and DF3888 (BRCA1-mutant) patient-derived organoids after IR treatment. C, USP1 mRNA levels in patient-derived organoids. The gene expression levels were normalized to the internal standard gene, GAPDH. The means and SE were determined from triplicate measurements in two biologic replicates. P values were calculated using the t test. Internal normalization for the baseline expression of USP1 mRNA was made with DF4732 (BRCA1/2 WT PDO) for comparison. D, Survival plots of BRCA1-WT and BRCA1-mutant patient-derived organoids exposed to a graded concentration of USP1 inhibitor TNG6132. Cells were plated to 96-well U-bottom ultralow attachment plates and incubated for 48 hours prior to drug treatment. Viability was assessed at 7 days using CellTiter-Glo 3D reagent. E, DNA fiber assays with and without S1 nuclease treatment in patient-derived organoids. Top, schematics of nascent DNA labeling with two nucleotide analogs CldU and IdU in presence or absence of drugs (niraparib or TNG6132), followed by treatment with or without S1 nuclease. Bottom, quantification of the IdU tract lengths of the fibers evaluating the presence or absence of ssDNA gaps. Each dot indicates one fiber; at least 100 fibers were analyzed per condition. The horizontal bars indicate the median of the lengths in each experimental condition as described at the bottom. P values were calculated using the Mann–Whitney test. F, A table summarizing the drug sensitivity and ssDNA gap assay results of BRCA1-WT and BRCA1-mutant patient-derived organoids. ***, P < 0.001; ****, P < 0.0001; ns, nonsignificant.
Figure 3.
Figure 3.
USP1 inhibition synergizes with ssDNA gap–inducing agents such as PARP inhibitors and POLQ inhibitors. A, Schematic of the model depicting accumulation of ssDNA gaps after inhibition of PARP, POLQ, or USP1. B and D, Synergy between the USP1 inhibitor I-138 and olaparib (B) or I-138 and novobiocin (D) in indicated cell lines. Left, Bliss synergy/antagonism levels on the experimental combination dose–response surface for cells treated with graded concentrations of I-138 and olaparib or I-138 and novobiocin. Bliss scores greater than zero (green/blue shading) indicate synergy. Cells were grown for 24 hours in triplicate before exposure to graded concentrations of I-138 and olaparib or I-138 and novobiocin. Viability was assessed at 7 days using CellTiter-Glo reagent. Right, IC50 plots for olaparib sensitivity (B) or novobiocin sensitivity (D) of the indicated cells in presence or absence of I-138. C and E, DNA fiber assays with or without S1 nuclease treatment for analysis of ssDNA gaps. Top, schematics of nascent DNA labeling with two nucleotide analogs CldU and IdU in presence or absence of drugs (olaparib, I-138, or novobiocin), followed by incubation with or without S1 nuclease in indicated cell lines. Bottom, quantification of the IdU tract lengths of the fibers evaluating the presence or absence of ssDNA gaps in indicated cell lines. Each dot indicates one fiber; at least 200 fibers were analyzed per condition. The horizontal bars indicate the median of the lengths in each experimental condition as described on the bottom. P values were calculated using the Mann–Whitney test. *, P > 0.05; ***, P < 0.001.
Figure 4.
Figure 4.
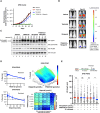
USP1 inhibition overcomes PARP inhibitor resistance in a PDX model of ovarian cancer. A and B, Tumor growth measured by BLI in mice bearing DF68 PDX tumors. Tumor growth plot is shown in A and representative images of the tumor-bearing mice are shown in B. NSG mice bearing luciferized PDX tumors were treated for 4 weeks (n = 7–8 mice per group) with vehicle, TNG6132 (200 mg/kg, daily), niraparib (45 mg/kg, daily), or the combination. Tumor growth was monitored by weekly BLI of the mice. Tumor measurements are represented as mean ± SE. P values were calculated using two-way ANOVA. P < 0.001 for vehicle control versus combination; P = 0.070 for TNG6132 versus niraparib; P < 0.001 for TNG6132 versus combination; P < 0.001 for niraparib versus combination. C, Pharmacodynamic markers in PDX tumors after treatment in mice. NSG mice bearing DF68 PDXs were treated for 5 days as described in A and were euthanized at 4 hours after the last dose of the drugs. Lysates from ascites-derived tumor cells were subjected to Western blotting with indicated antibodies. Data are from three individual mice in each group. D, Left, survival plots of DF68 PDXO exposed to olaparib or USP1 inhibitor TNG6132. Right, Bliss synergy/antagonism levels on the experimental combination–response surface (top) or in a matrix format (bottom) for the DF68 PDXO treated with graded concentrations of TNG6132 and olaparib. Bliss scores greater than zero (green/blue shading) indicate synergy. Cells were plated to 96-well U-bottom ultralow attachment plates and incubated for 48 hours prior to drug treatment. Viability was assessed at 7 days using CellTiter-Glo 3D reagent. E, DNA fiber assays with and without S1 nuclease treatment in DF68 PDXO. Top, schematics of nascent DNA labeling with two nucleotide analogs CldU and IdU in presence or absence of drugs (niraparib or TNG6132), followed by treatment with S1 nuclease. Bottom, quantification of the IdU tract lengths of the fibers evaluating the presence or absence of ssDNA gaps. Each dot indicates one fiber; at least 100 fibers were analyzed per condition. The horizontal bars indicate the median of the lengths in each experimental condition as described at the bottom. P values were calculated using the Mann–Whitney test. ***, P < 0.001; ns, nonsignificant.

References

    1. Ceccaldi R, Rondinelli B, D’Andrea AD. Repair pathway choices and consequences at the double-strand break. Trends Cell Biol 2016;26:52–64. - PMC - PubMed
    1. Farmer H, McCabe N, Lord CJ, Tutt ANJ, Johnson DA, Richardson TB, et al. . Targeting the DNA repair defect in BRCA mutant cells as a therapeutic strategy. Nature 2005;434:917–21. - PubMed
    1. Lord CJ, Ashworth A. PARP inhibitors: synthetic lethality in the clinic. Science 2017;355:1152–8. - PMC - PubMed
    1. Bryant HE, Schultz N, Thomas HD, Parker KM, Flower D, Lopez E, et al. . Specific killing of BRCA2-deficient tumours with inhibitors of poly(ADP-ribose) polymerase. Nature 2005;434:913–7. - PubMed
    1. Ledermann J, Harter P, Gourley C, Friedlander M, Vergote I, Rustin G, et al. . Olaparib maintenance therapy in platinum-sensitive relapsed ovarian cancer. N Engl J Med 2012;366:1382–92. - PubMed

MeSH terms