. 2024 Sep 16;84(18):2985-3003.
doi: 10.1158/0008-5472.CAN-23-3553.

Oncogenic Calreticulin Induces Immune Escape by Stimulating TGFβ Expression and Regulatory T-cell Expansion in the Bone Marrow Microenvironment

Affiliations

Oncogenic Calreticulin Induces Immune Escape by Stimulating TGFβ Expression and Regulatory T-cell Expansion in the Bone Marrow Microenvironment

Dominik Schmidt et al. Cancer Res. .

Abstract

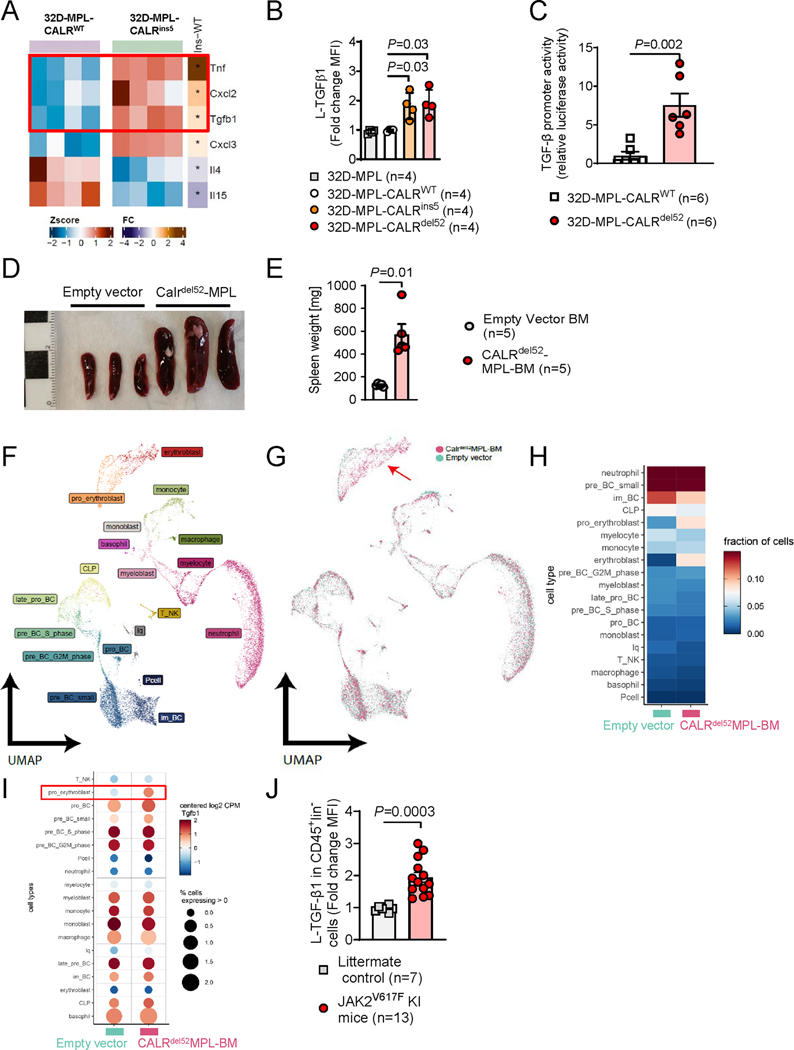
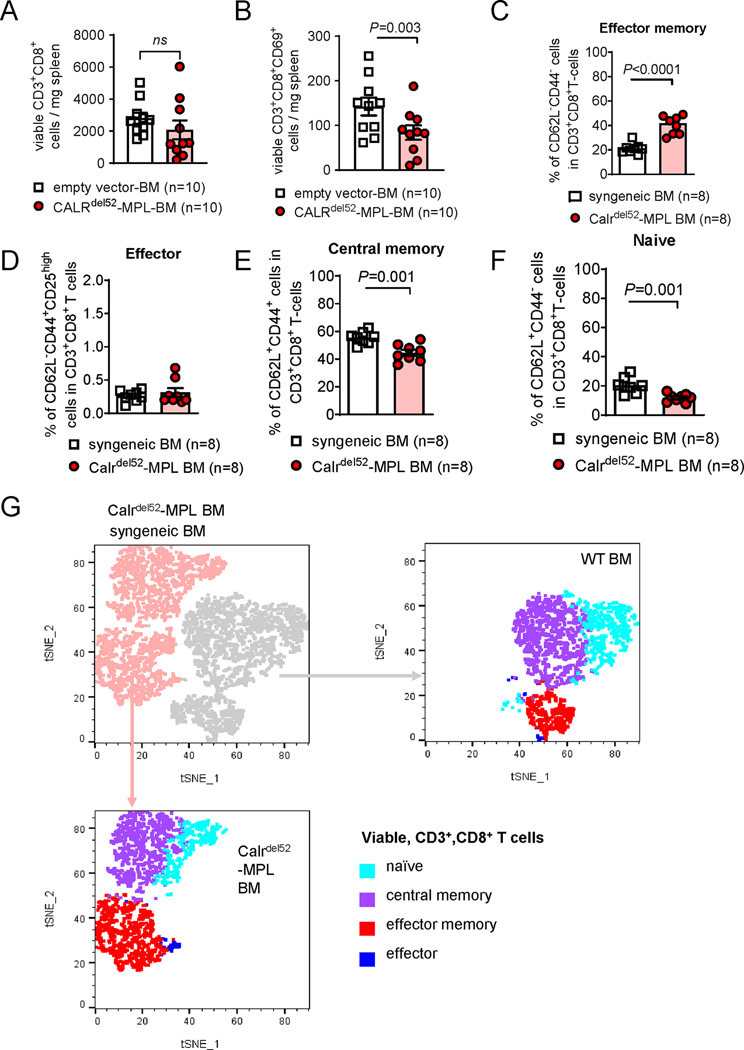
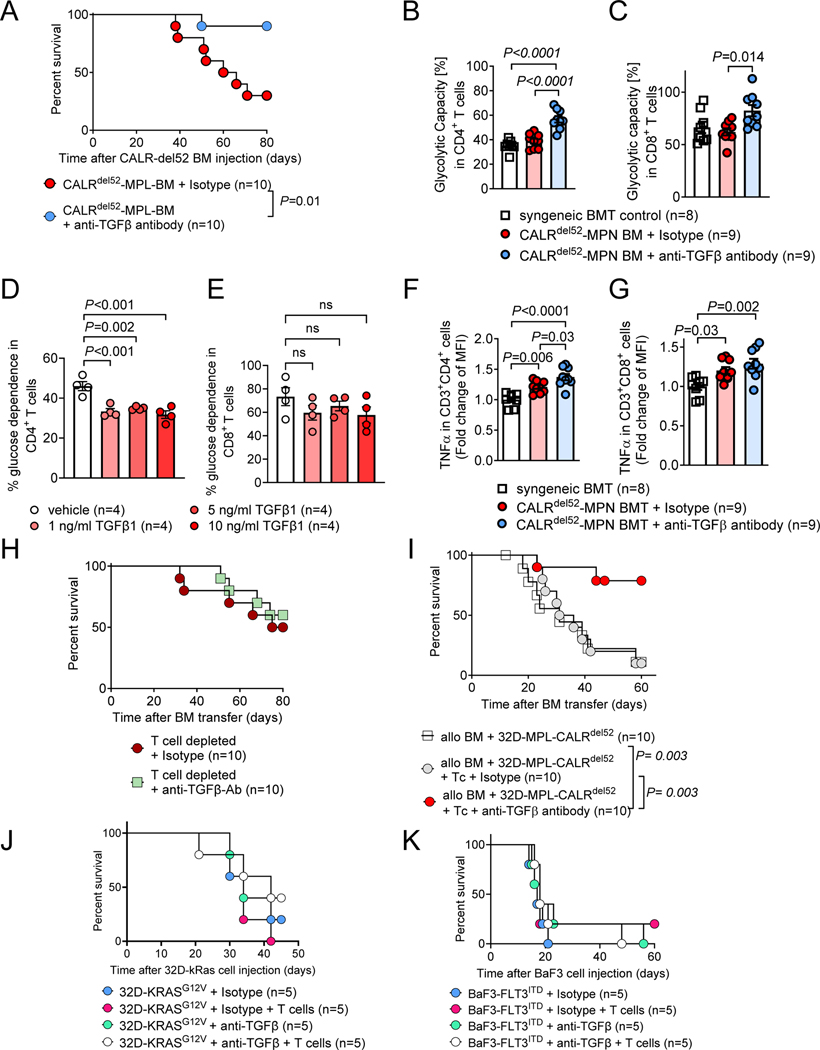
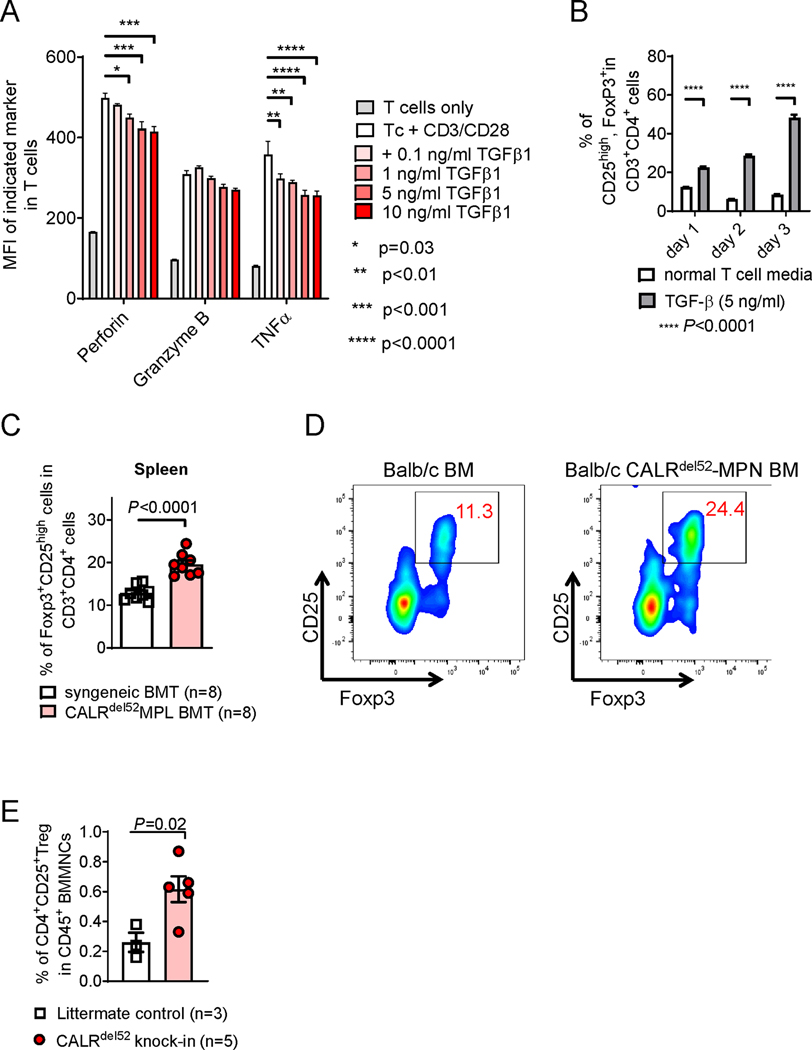
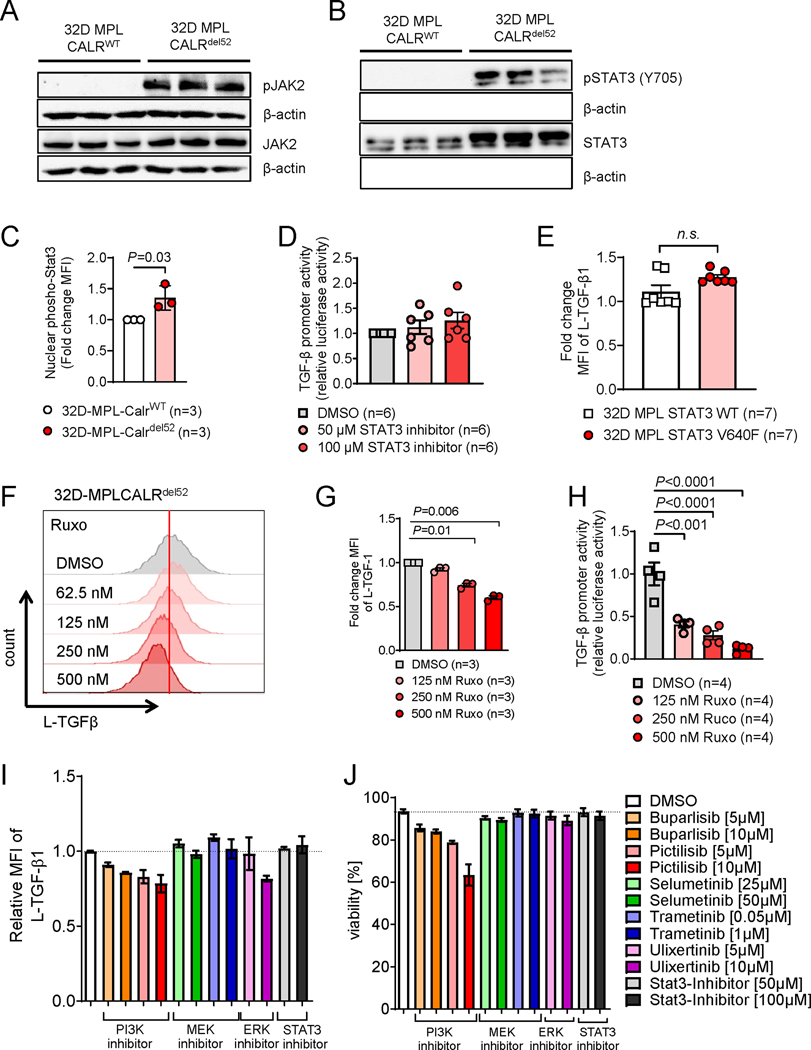
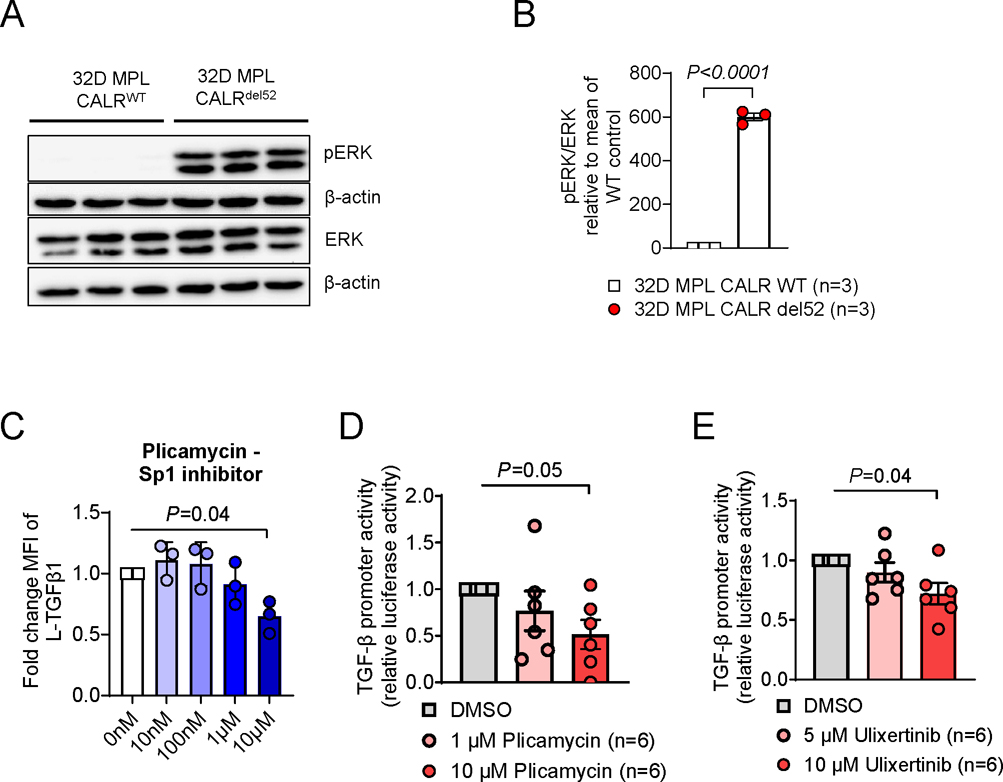
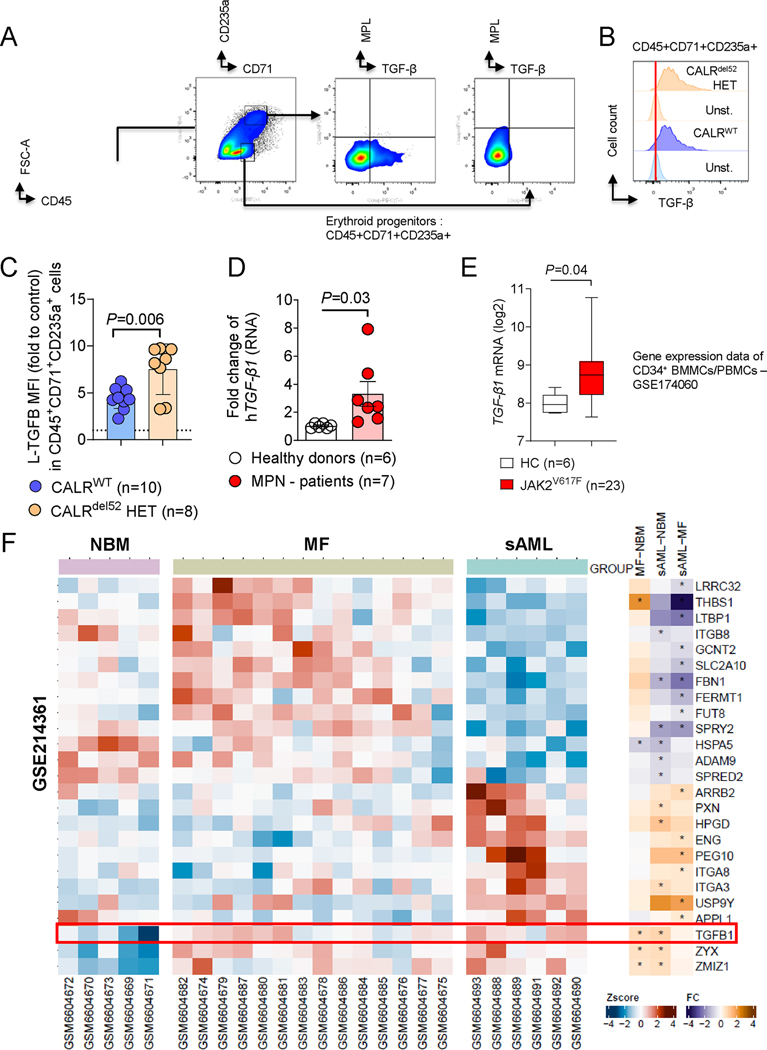
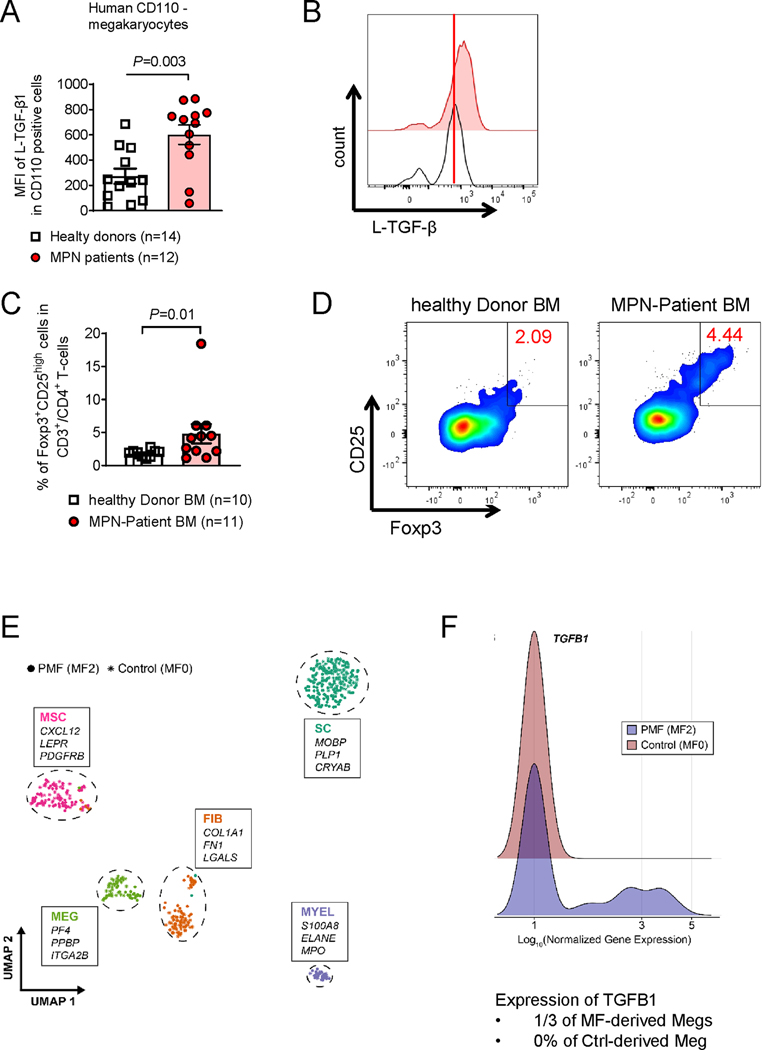
Increasing evidence supports the interplay between oncogenic mutations and immune escape mechanisms. Strategies to counteract the immune escape mediated by oncogenic signaling could provide improved therapeutic options for patients with various malignancies. As mutant calreticulin (CALR) is a common driver of myeloproliferative neoplasms (MPN), we analyzed the impact of oncogenic CALRdel52 on the bone marrow (BM) microenvironment in MPN. Single-cell RNA sequencing revealed that CALRdel52 led to the expansion of TGFβ1-producing erythroid progenitor cells and promoted the expansion of FoxP3+ regulatory T cells (Treg) in a murine MPN model. Treatment with an anti-TGFβ antibody improved mouse survival and increased the glycolytic activity in CD4+ and CD8+ T cells in vivo, whereas T-cell depletion abrogated the protective effects conferred by neutralizing TGFβ. TGFβ1 reduced perforin and TNFα production by T cells in vitro. TGFβ1 production by CALRdel52 cells was dependent on JAK1/2, PI3K, and ERK activity, which activated the transcription factor Sp1 to induce TGFβ1 expression. In four independent patient cohorts, TGFβ1 expression was increased in the BM of patients with MPN compared with healthy individuals, and the BM of patients with MPN contained a higher frequency of Treg compared with healthy individuals. Together, this study identified an ERK/Sp1/TGFβ1 axis in CALRdel52 MPNs as a mechanism of immunosuppression that can be targeted to elicit T-cell-mediated cytotoxicity. Significance: Targeting the mutant calreticulin/TGFβ1 axis increases T-cell activity and glycolytic capacity, providing the rationale for conducting clinical trials on TGFβ antagonists as an immunotherapeutic strategy in patients with myeloproliferative neoplasms.


Conflict of interest statement

Conflict-of-interest: The authors declare that they have no conflict of interest with this study.

Figures

Figure 1:
Figure 1:. Mutant CALR induces TGF-β production
(A) Heat map showing expression profile of MPL-CALRins5 transduced 32D cells versus MPL-CALRWT. Relative expression of selective immune regulatory cytokines is plotted. Colour codes represents the Z-score log2 intensity. RNA was harvested from four independent IL3-starved cell cultures. Differential gene expression analysis was performed with the linear model-based approach (limma R package). (B) Scatter plot showing fold change of MFI from L-TGF-β1 expressed on MPL-CALR-/WT/del52 transduced 32D cells after IL-3 withdrawal. Four independent experiments were performed and the results were pooled. P-values were calculated using one-way ANOVA. (C) Scatter plot showing TGF-β promoter activity (luciferase activity relative to mean of WT control) of 32D-MPL-CalrWT or 32D-MPL-Calrdel52 cells. Cells transfected with the pGL3-TGFβ1 promotor vector. Pooled data from six independent experiments. P values were calculated using Mann-Whitney test. (D, E) Spleens of mice isolated 21 days after injection of either Empty vector (EV) or CALRdel52-MPL transduced Bone Marrow (BM). Exemplary picture (scale in cm) (D) and scatter plot (E) showing quantification of weight of spleens of mice 21 days after injection of either EV- or CALRdel52-MPL transduced BM. (F-I) Single-cell RNA Sequencing (sc-RNA-Seq) of bone marrow from mice 21 days after injection of either EV- (n=2) or CALRdel52-MPL (n=2) transduced BM. UMAP depicting clustering into different cell populations (F), UMAP of EV- and CALRdel52-MPL condition merged (G), heat-map depicting fraction of cells in each cluster (H) and bubble plot depicting TGF-β1 expression in different clusters combining fraction cells expressing TGF-β1 (% -relative expression to mean >0) and expression within clusters relative to mean expression level over all clusters (I). The red arrow indicates the erythroblast population in bone marrow of mice that received CALRdel52-MPL BMC. (J) Scatter plot showing TGF-β protein expression (fold change of MFI) of CD45+ lineage marker negative cells isolated from JAK2V617F knock-in mice or littermate controls as indicated. Each data point is a biological replicate (individual mouse). P values were calculated using an unpaired Student’s t-test (E, J).
Figure 2:
Figure 2:. T cell phenotype in mice with CALRdel52-MPL or control BM
(A, B) Scatter plot showing absolute counts of total CD3+CD8+ T cells (A) and CD3+CD8+CD69+ activated T cells (B) isolated from the spleens of mice injected with BM cells expressing CALRdel52-MPL or control BM. Pooled data from two individual experiments. P values were calculated using unpaired Student’s t-test. (C-F) Scatter plot showing frequencies of effector memory (CD62L- CD44-) T cells (C), effector (CD62L- CD44+) T cells (D), central memory (CD62L+ CD44+) T cells (E) and naïve (CD62L+ CD44-) T cells (F) in total CD3+CD8+ viable T cells isolated from the spleens of mice injected with BM cells expressing CALRdel52-MPL or control BM. Pooled data from two individual experiments. P values were calculated using unpaired Student’s t-test. (G) Representative dot plot showing t-distributed stochastic neighbour embedding (t-SNE) of viable CD3+CD8+ T cells derived from the spleens of mice injected with BM cells expressing CALRdel52-MPL or control BM. For visualization, previously gated T cell subsets (C-F) are superimposed as indicated.
Figure 3:
Figure 3:. In vivo TGF-β neutralization improves survival of CALRdel52 driven MPN
(A) Kaplan-Meyer curve showing percent survival of mice injected with BM cells expressing CALRdel52-MPL. Mice were treated with anti-TGFβ1,2,3 neutralizing antibody or respective isotype controls on day 12, 16 and 20 post bone marrow transplantation. Pooled data from two individual experiments. (B, C) Scatter plot showing glycolytic capacity of CD4+ (B) and CD8+ (C) T cells isolated from spleen of mice injected with syngeneic BM or syngeneic BM cells expressing CALRdel52-MPL. Mice were treated with anti-TGFβ1,2,3 neutralizing antibody or respective isotype controls on day 12, 16 and 20 post bone marrow transplantation. Pooled data from two individual experiments. (D, E) Scatter plot showing glucose dependence (%) in CD4+ (D) and CD8+ (E) T cells activated using CD3/CD28 activator beads and treated with indicated concentrations of TGF-β for 24h. Pooled data from four individual experiments. (F, G) Scatter plot showing fold change of TNF-α MFI in CD3+CD4+ (F) and CD3+CD8+ (G) T cells isolated from spleen of mice injected with syngeneic BM or syngeneic BM cells expressing CALRdel52-MPL. Mice were treated with anti-TGFβ1,2,3 neutralizing antibody or respective isotype control on day 12, 16 and 20 post bone marrow transplantation. Pooled data from two individual experiments. (H) Kaplan-Meyer curve showing percent survival of mice injected with BM cells expressing CALRdel52-MPL. Mice received weekly T cell depleting therapy (anti-CD4 and anti-CD8 antibody) and were treated with anti-TGFβ1,2,3 neutralizing antibody or respective isotype control on day 12, 16 and 20 post bone marrow transplantation. Pooled data from two individual experiments. (I) Kaplan-Meyer curve showing percent survival of mice injected with allogeneic BM and 32D-MPL-CALRdel52 cells. Mice received 2×10⁵ allogeneic T cells (Tc) on day 2 post allo-HCT and were treated with anti-TGFβ1,2,3 neutralizing antibody or respective isotype control on day 12, 16 and 20 post allo-HCT, as indicated. Pooled data from two individual experiments. (J) Kaplan-Meyer curve showing percent survival of mice injected with 32D-KRASG12V cells and allogeneic BM. Mice received 2×10⁵ allogeneic T cells (Tc) on day 2 post allo-HCT and were treated with anti-TGFβ1,2,3 neutralizing antibody or respective isotype control on day 12, 16 and 20 post allo-HCT, as indicated. Data from one experiment is shown. (K) Kaplan-Meyer curve showing percent survival of mice injected with BaF3-FLT3ITD cells and allogeneic BM. Mice received 200.000 allogeneic T cells (Tc) on day 2 post allo-HCT and were treated with anti-TGFβ1,2,3 neutralizing antibody or respective isotype control on day 12, 16 and 20 post allo-HCT, as indicated. Data from one experiment is shown. P values were calculated using Mantel-Cox Test (A, H-K) or ordinary one-way ANOVA (B-G). Bar plots show mean at SEM.
Figure 4:
Figure 4:. TGF-β induces regulatory T cells while reducing cytotoxic molecules in T cells
(A) Bar plot showing mean fluorescence intensity (MFI) of Perforin, Granzyme B and TNF-α in T cells after 24h of incubation with CD3/CD28 activation beads and indicated concentration of soluble TGFβ1. Experiment was repeated three times, technical triplicates of one exemplary repeat is depicted. P values were calculated using 2way ANOVA with multiple comparison. (B) Bar plot showing percentage of CD25highFoxp3+ Tregs in CD3+CD4+ T cells treated with 5 ng/ml of soluble TGF-β or normal T cell media and activated with CD3/CD28 activation beads, for the indicated time. Experiment was repeated three times, technical triplicates of one exemplary repeat is depicted. P values were calculated using 2way ANOVA with multiple comparison. (C, D) Scatter plot (C) and exemplary flow cytometry plot (D) showing percentage of CD25highFoxp3+ Tregs in CD3+CD4+ T cells in the spleen of mice injected with BM cells expressing CALRdel52-MPL or control BM, day 21 post BM transplantation. Pooled data from two individual experiments. P values were calculated using unpaired Student’s t-test. (E) Scatter plot showing fraction of CD4+CD25+ Treg cells within total CD45+ BM mononuclear cells (BMMNCs) derived from mice homozygous for CALRdel52 knock-in allele or litter mate control mice. P values were calculated using unpaired Student’s t test. Bar plots show mean with SEM.
Figure 5:
Figure 5:. TGF-β expression is regulated by a PI3K/ERK dependent pathway
(A, B) Western blot showing phospho-JAK2 / total JAK2 (A) and phospho-STAT3 (Y705) /total STAT3 (B) with β-actin as loading control. Protein was isolated from 32D cells transfected with MPL and CALRWT or CALRdel52 after overnight IL3 starvation, three individual harvest for each condition. (C) Scatter dot plot showing fold change of nuclear phospho-STAT3 signal detected by immunohistochemistry in 32D-MPL-CALRdel52 cells compared to 32D-MPL-CALRWT cells after overnight IL3 starvation. Pooled data from three independent experiments. (D) Scatter plot showing luciferase activity in 32D-MPL-Calrdel52 cells, transfected with pGL3-TGFβ1 promotor vector, treated overnight with indicated concentrations of STAT3 inhibitor after IL-3 withdrawal. Pooled data from two independent experiments. P values were calculated using repeated-measures (RM) one-way ANOVA. (E) Scatter plot showing fold change MFI of L-TGF-β1 on 32D-STAT3WT or STAT3V640F. Pooled data from two independent experiments. P values were calculated using Mann-Whitney test. (F, G) Representative histogram (F) and scatter dot plot (G) showing L-TGF-β1 expression on 32D-MPL-CALRdel52 cells treated with indicated concentration of ruxolitinib (JAK1/2-inhibitor). Pooled data from three independent experiments. (H) Scatter dot plot showing relative luciferase activity in 32D-MPL-Calrdel52, transfected with pGL3-TGFβ1 promotor vector and treated with indicated concentration of ruxolitinib overnight after IL-3 withdrawal. Pooled data from two independent experiments with two technical replicates for each condition. P values were calculated using ordinary one-way ANOVA. (I, J) Relative expression of L-TGF-β1 (I) and cell viability (J) of 32D-MPL-CALRdel52 cells treated with either PI3K inhibitors (Buparlisib, Pictilisib), MEK inhibitors (Selumetinib, Trametinib), ERK inhibitor (Ulixertinib) or STAT3-inhibitor for 24h. Pooled data from three independent experiments.
Figure 6:
Figure 6:. TGF-β expression is regulated by an ERK/Sp1 dependent pathway
(A, B) Representative western blot (A) and relative quantification of phosph-ERK / total-ERK (B). Protein was isolated from 32D-MPL-CALRWT or -CALRdel52 after overnight IL3 starvation Pooled data from three independent experiments. P-values were calculated using unpaired Student’s t test. (C) Scatter plot showing expression of L-TGFβ1 on 32D-MPL-Calrdel52 cells after overnight treatment with the Sp1 specific inhibitor (Plicamycin) and IL-3 withdrawal. P values were calculated using ordinary one-way ANOVA. (D) Scatter plot showing luciferase activity in 32D-MPL-Calrdel52 cells, transfected with pGL3-TGFβ1 promotor vector, treated overnight with indicated concentrations of Sp1 inhibitor (Plicamycin) after IL-3 withdrawal. Pooled data from two independent experiments. P values were calculated using RM one-way ANOVA. (E) Scatter plot showing luciferase activity in 32D-MPL-Calrdel52 cells, transfected with pGL3-TGFβ1 promotor vector, treated overnight with indicated concentrations of ERK inhibitor (Ulixertinib) after IL-3 withdrawal. Pooled data from two independent experiments. P values were calculated using RM one-way ANOVA. Bar plots show mean with SEM.
Figure 7:
Figure 7:. TGF-β1 expression is increased in patient derived MPN samples
(A) Gating strategy for TGF-β and MPL quantification on CALRdel52 or CALRWT iPSC-derived erythroid progenitor cells CD45+CD71+CD235a+/−. (B) Representative histogram plot showing TGF-β expression on the surface of CALRdel52 or CALRWT iPSC-derived CD45+CD71+CD235+ erythroid progenitors with respective unstained control. (C) Scatter plot showing relative MFI of L-TGF-β surface expression on CALRWT or CALRDEL52 iPSC-derived CD45+CD71+CD235a+ erythroid progenitor cells, fold change to MFI of unstained control. CALRDEL52 iPSC and CRISPR repaired CALRWT control were generated from one CALRdel52 MPN patient. Each dot represents individual experiment. The P-value was calculated using unpaired Studentś t test. (D) Scatter plot showing fold change RNA expression of human TGF-β1 in total mononuclear BM cells from MPN patients or healthy donors from the Freiburg MPN cohort. (E) Box plot showing TGF-β1 RNA expression (log2) in CD34+BMMCs/PBMCs from publicly available data set (GSE174060 - (42)). (F) Heat map showing expression profiling by GeneChipHuman Gene 2.0 ST Arrays (Affymetrix) of Lin-CD34+ PBMCs of normal bone marrow donors (NBM), patients with primary myelofibrosis (MF) and secondary AML (sAML). Data were obtained and re-analyzed from Gene Expression Omnibus (GEO) Database - GSE214361 (43). A set of genes involved in TGF-β1 regulation and activation was selected. Z score for separate patients is shown on the left and fold change comparing each group is shown on the right (* indicates significant changes).
Figure 8:
Figure 8:. Cell types expressing TGF-β1 and Tregs frequencies in patient derived MPN samples
(A-B) Scatter plot (A) and representative histogram (B) showing expression of L-TGF-β1 on CD45+CD110+ BMMNCs of healthy donors or MPN patients (Freiburg MPN cohort). P-values were calculated using unpaired Student’s t-test (C, D) Scatter plot (C) and representative flow cytometry plots (D) showing percentage of CD25highFoxp3+ Treg cells in CD3+CD4+ BMMNCs of healthy donors or MPN patients (Freiburg MPN cohort). P-values were calculated using unpaired Student’s t-test. (E, F) UMAP (E) of publicly available dataset (GSE156644). Niche-derived single-cell transcriptomes of 1 JAK2V617F-positive PMF-patient (MF 2–3) and two control patients (MF 0). Differential expression of marker genes between clusters was used to verify cellular identity. Top 3 leading marker genes based on cluster-wise average expression and biological function are highlighted. Ridgeline plot (F) depicting the distribution of log-normalized gene expression for TGFB1 within the megakaryocyte cluster (MEG) after subsetting. Probability density is shown comparing cells derived from myelofibrotic (blue) and non-fibrotic BM (red).

References

    1. Prestipino A, Zeiser R. Clinical implications of tumor-intrinsic mechanisms regulating PD-L1. Science translational medicine 2019;11(478):eaav4810. - PubMed
    1. Klampfl T, Gisslinger H, Harutyunyan AS, Nivarthi H, Rumi E, Milosevic JD, et al. Somatic mutations of calreticulin in myeloproliferative neoplasms. New England Journal of Medicine 2013;369(25):2379–90. - PubMed
    1. Zeiser R, Blazar BR. Acute Graft-versus-host disease - Biologic process, prevention, and therapy. N Eng J Med 2017;377:2167–79. - PMC - PubMed
    1. Nangalia J, Massie CE, Baxter EJ, Nice FL, Gundem G, Wedge DC, et al. Somatic CALR mutations in myeloproliferative neoplasms with nonmutated JAK2. New England Journal of Medicine 2013;369(25):2391–405. - PMC - PubMed
    1. Prestipino A, Emhardt AJ, Aumann K, O’Sullivan D, Gorantla SP, Duquesne S, et al. Oncogenic JAK2V617F causes PD-L1 expression, mediating immune escape in myeloproliferative neoplasms. Science translational medicine 2018;10(429):eaam7729. - PMC - PubMed

MeSH terms