. 2024 Jun 17;134(15):e171136.
doi: 10.1172/JCI171136.

Triptolide and its prodrug Minnelide target high-risk MYC-amplified medulloblastoma in preclinical models

Affiliations

Triptolide and its prodrug Minnelide target high-risk MYC-amplified medulloblastoma in preclinical models

Jezabel Rodriguez-Blanco et al. J Clin Invest. .

Abstract

Most children with medulloblastoma (MB) achieve remission, but some face very aggressive metastatic tumors. Their dismal outcome highlights the critical need to advance therapeutic approaches that benefit such high-risk patients. Minnelide, a clinically relevant analog of the natural product triptolide, has oncostatic activity in both preclinical and early clinical settings. Despite its efficacy and tolerable toxicity, this compound has not been evaluated in MB. Utilizing a bioinformatic data set that integrates cellular drug response data with gene expression, we predicted that Group 3 (G3) MB, which has a poor 5-year survival, would be sensitive to triptolide/Minnelide. We subsequently showed that both triptolide and Minnelide attenuate the viability of G3 MB cells ex vivo. Transcriptomic analyses identified MYC signaling, a pathologically relevant driver of G3 MB, as a downstream target of this class of drugs. We validated this MYC dependency in G3 MB cells and showed that triptolide exerts its efficacy by reducing both MYC transcription and MYC protein stability. Importantly, Minnelide acted on MYC to reduce tumor growth and leptomeningeal spread, which resulted in improved survival of G3 MB animal models. Moreover, Minnelide improved the efficacy of adjuvant chemotherapy, further highlighting its potential for the treatment of MYC-driven G3 MB.

Keywords: Brain cancer; Oncology.


Conflict of interest statement

Conflict of interest: The authors have declared that no conflict of interest exists.

Figures

Figure 1
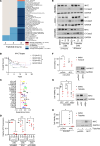
Figure 1. Bioinformatic analysis predicts that G3 MB will respond to triptolide.
(A) Normalized expression of the 55 genes included within the NIH LINCS L1000 transcriptional consensus response signature for triptolide that overlap with MB subgroup–differentiating signatures is shown. The arrow highlights MYC within the downregulated genes in this signature. (B) Spearman’s correlation between the triptolide response gene signature was calculated against SHH, WNT, G3, and G4 disease signatures obtained through analysis of transcriptomic data included in the Robinson et al. 2012 data set. (C) Heatmap representing the expression of the top 55 triptolide response genes per MB subgroup. The arrow highlights MYC expression among MB subgroups.
Figure 2
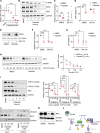
Figure 2. G3 MB cultures have an enhanced response to triptolide.
(A) The Cavalli et al. 2017 data set was used to compare the expression of MYC in G3 MB patients versus the other MB subgroups. Expression data were analyzed using an unpaired, 1-tailed Student’s t test. (B) MYC levels were assessed by immunoblotting in 3 G3 and 3 SHH MB cultures. (C) G3 and SHH MB cells were incubated with increasing concentrations of triptolide for 48 hours before assaying cell viability using an MTT reduction assay. EC50 values were calculated using nonlinear regression analyses (G3 MB n = 4, SHH MB n = 3). (D) G3 and SHH MB cultures were exposed to the indicated concentrations of triptolide for 16 hours. Cell proliferation and apoptosis were assayed by EdU incorporation and cleaved Casp3 (C-Casp3) staining, respectively. Representative images (scale bars: 50 μm) are shown. (E) Quantification of the number of EdU-positive cells per field in similarly treated cultures (n = 3). (F) The number of C-Casp3–positive cells per field in similarly treated cultures was quantified (n = 3). Data presented as mean ± SEM. Data in E and F were normalized to DMSO and analyzed using 1-way ANOVA followed by Dunnett’s post hoc test. *P < 0.05; **P < 0.01; ***P < 0.001; ****P < 0.0001.
Figure 3
Figure 3. Triptolide acts on MYC to attenuate G3 MB growth.
(A) HD:MB03 cells were treated with 10 nM triptolide, followed by RNA-seq and gene set enrichment analyses (n = 3). Heatmap displays triptolide-regulated gene expression hallmarks, with an arrow indicating MYC targets. (B) The Cavalli et al. 2017 data set was analyzed to correlate MYC targets hallmark expression with G3 MB patient survival using log-rank (Mantel-Cox) tests. (C) DepMap gene dependency analyses predicted G3 MB cell dependency of genes downregulated by triptolide in the L1000 triptolide transcriptional response signature in Figure 1A. Arrow highlights MYC. (D) G3 MB cells were treated with triptolide for 24 hours, and MYC expression was quantified by RT-qPCR (n = 3). Values were analyzed using 1-way ANOVA followed by Dunnett’s post hoc test. (E) Lysates of G3 MB cultures exposed to triptolide were immunoblotted for the indicated proteins. (F) mG3-2929 cells were electroporated with HA-MYC 72 hours prior to 50 nM triptolide treatment. Cell viability was assessed by MTT reduction 48 hours later, while MYC levels were measured by immunoblotting 72 hours after electroporation (n = 3). (G) mG3-2929 cells were transfected for 48 hours with MYC-targeting siRNA, scramble siRNA (siSC), or GFP control, and then treated with 50 nM triptolide. Cell viability was assessed by MTT reduction 48 hours later, and MYC levels were measured by immunoblotting 72 hours after transfection (n = 3). (H) SHH-MB47 cells received MYC vector via electroporation 72 hours prior to exposure to 50 nM triptolide. Cell viability was measured using CellTiter-Glo assay 48 hours later. MYC levels were assessed in similarly electroporated cells exposed to 100 nM triptolide for 16 hours (n = 3). Images of representative immunoblots are shown. Unless otherwise indicated, all results are presented as mean ± SEM of data normalized to DMSO, where statistical significance was assessed using 1-way ANOVA followed by Newman-Keuls post hoc test. *P < 0.05; **P < 0.01; ***P < 0.001; ****P < 0.0001.
Figure 4
Figure 4. Triptolide decreases MYC levels through transcriptional and posttranslational mechanisms.
(A) MYC expression in HD:MB03 cells treated with 50 nM triptolide was measured by RT-qPCR (n = 3) and analyzed by 1-way ANOVA followed by Dunnett’s post hoc test. (B) Lysates from HD:MB03 cells treated with 50 nM triptolide were immunoblotted for indicated proteins. (C) HD:MB03 cells were treated with BS-181 (10 μM) alone or with 50 nM triptolide for 6 hours, before determining MYC expression by RT-qPCR (n = 4). Data were analyzed using unpaired, 1-tailed Student’s t test. (D) HD:MB03 cells were treated similarly for 48 hours. Cell viability was assessed by MTT reduction (n = 4), and analyzed using an unpaired, 1-tailed Student’s t test. (E) HD:MB03 cells were treated with MG-132 (10 μM) for 1 hour before adding 50 nM triptolide. RPB1 levels were immunoblotted 4 hours later. (F) HD:MB03 cultures were similarly treated and MYC expression was determined by RT-qPCR 4 hours later (n = 3). (G) Cell viability was assessed by MTT reduction 48 hours after similar treatment (n = 3). (H) HD:MB03 cells were exposed to 50 nM triptolide for 2 hours before adding 25 μM CHX. MYC half-life was calculated using nonlinear regression analyses (n = 3). (I) HD:MB03 cells were treated with 50 nM triptolide. Levels of MYC and its phosphorylated forms were determined by immunoblotting (n = 3), and analyzed by 1-way ANOVA followed by Dunnett’s post hoc test. (J) HD:MB03 cells were exposed to triptolide for 4 hours before immunoprecipitating MYC. Immunoprecipitates and their input extract were immunoblotted for the indicated proteins. (K) HD:MB03 cells were treated with 10 μM MG-132 for 1 hour before adding 50 nM triptolide. MYC levels were immunoblotted 4 hours later. (L) Schematic suggesting triptolide’s mechanism of action on G3 MB. Representative immunoblots are shown. Unless otherwise indicated, statistical significance was assessed by 1-way ANOVA followed by Newman-Keuls post hoc test. *P < 0.05; **P < 0.01; ***P < 0.001; ****P < 0.0001.
Figure 5
Figure 5. Triptolide reduces tumor growth in G3 MB mouse models.
(A) mG3-2929 cells were implanted into mice 15 days before starting vehicle or triptolide (0.4 mg/kg, i.p., daily) dosing for 5 days. Tumor area was measured in ×2.5-magnified H&E-stained tissues (n = 5), and representative images of whole and H&E-stained (scale bars: 400 μm) brains are shown. (B) mG3-2929 cells were allowed to form tumors for 4 days prior to starting similar triptolide dosing. Tumor size was determined 12 days later by IVIS imaging (n = 5). (C) Similar cells were orthotopically implanted 15 days before starting vehicle or triptolide dosing (0.4 mg/kg, i.p., daily) for 5 days. Brain tumors were harvested and their lysates immunoblotted for MYC (n = 4). (D) Brain tumor tissues from mice similarly treated for 5 days were harvested and immunostained for the indicated proteins. Number of positive cells per field was quantified (MYC n = 3, Ki67/C-Casp3 n = 4). Representative images (scale bars: 50 μm) are shown. (E) mG3-2929 cells were orthotopically implanted 3 days before dosing mice with vehicle or triptolide (0.4 mg/kg, i.p., daily) for 21 days. Symptom-free survival was analyzed using log-rank (Mantel-Cox) tests (n = 10). (F) Displayed are whole and H&E-stained (scale bars: 400 μm) brains from a symptomatic mouse in the vehicle cohort, along with 2 representative animals that remained asymptomatic 20 days after the last vehicle-treated mouse was euthanatized. RFP signal and arrows indicate tumor presence. In all cases, brains were harvested 6 hours after the last injection. Unless otherwise indicated, all results are presented as mean ± SEM of data normalized to 1 vehicle-treated animal. Statistical significance, unless otherwise specified, was assessed using an unpaired, 1-tailed Student’s t test. *P < 0.05; **P < 0.01; ****P < 0.0001.
Figure 6
Figure 6. Triptolide attenuates G3 MB metastatic dissemination.
(A) MYC levels were determined in D425 (primary) and D458 (metastatic) tumor cells treated with triptolide for 16 hours. Representative immunoblots are shown. (B) Similar cells were exposed to triptolide for 48 hours and cell viability was determined by MTT reduction. Nonlinear regression analyses on the mean ± SEM of data normalized to DMSO were performed (n = 3). (C) Wound healing assays were performed in HD:MB03 cultures treated with 10 nM triptolide. A wound healing ratio was calculated relative to initial measurement. Mean ± SEM of the wound ratio per day (n = 3) and representative images (scale bars: 400 μm) are shown. (D) mG3-2929 sphere cultures exposed to 10 nM triptolide were plated on poly-D-lysine–coated wells for 24 hours. The ratio of viable attached cells, as determined by MTT reduction, to total viable cells was calculated. Mean ± SEM of data normalized to DMSO was plotted (n = 3). Representative images (scale bars: 50 μm) are shown. (E) mG3-2929 cells were implanted into mice 15 days before starting vehicle or triptolide (0.4 mg/kg, i.p., daily) dosing for 5 days. Metastatic lesions outside of the posterior fossa were quantified in ×2.5-magnified H&E-stained brains (vehicle n = 4, triptolide n = 5). Detail of metastatic lesions in representative images is shown. Arrows indicate tumor presence. (F) Mice harboring mG3-2929 tumors were similarly treated with vehicle or triptolide for 5 days, before quantifying numbers of positive cells in metastatic regions by IHC analyses (MYC n = 4, Ki67/C-Casp3 n = 3). Representative images (scale bars: 50 μm) are shown. In all cases, brains were harvested 6 hours after the last injection. Unless otherwise indicated, all results are presented as mean ± SEM of data normalized to 1 vehicle-treated animal. Statistical significance was assessed using an unpaired, 1-tailed Student’s t test. *P < 0.05; **P < 0.01; ***P < 0.001.
Figure 7
Figure 7. The triptolide prodrug, Minnelide, attenuates G3 MB growth.
(A) Schematic showing Minnelide hydrolyzation into active triptolide. (B) Mice were implanted with HD:MB03 cells 15 days before being treated with either vehicle or Minnelide (0.4 mg/kg, i.p., daily) for 4 days (n = 4). (C) HD:MB03 cells were allowed to form orthotopic tumors for 3 days before similarly dosing mice for 7 days. Tumor size was quantified by IVIS imaging (vehicle n = 9, Minnelide n = 10). (D) HD:MB03 cells were allowed to form orthotopic tumors for 15 days before similarly dosing mice for 4 days. MYC expression in harvested brains was determined by RT-qPCR (vehicle n = 4, Minnelide n = 5). (E) Immunostaining for indicated proteins in brain tumors from similar mice (n = 3). (F) Measurement of metastatic lesions located outside of the posterior fossa of similar mice (vehicle n = 4, Minnelide n = 5). (G) Tumors located in the spinal cord of mice similarly dosed for 21 days were measured (n = 5). (H) mG3-2929 cells were implanted 3 days before similar dosing, and symptom-free survival was determined using log-rank (Mantel-Cox) tests (vehicle n = 9, Minnelide n = 10). (I) Symptom-free survival was determined using log-rank (Mantel-Cox) tests in similarly dosed mice but harboring HD:MB03 tumors (vehicle n = 8, Minnelide n = 15). (J) Mice were similarly treated for 21 days before examining cerebellar tissues (n = 5). (K) Displayed are body weights of 2-week-old wild-type mice similarly dosed for 10 days (vehicle n = 5, Minnelide n = 6). All tumor area measurements were performed in ×2.5-magnified H&E-stained slides. All images are representative. Arrows indicate tumor presence. All tissues were harvested 6 hours after the last injection. Results are presented as mean ± SEM of data normalized to 1 vehicle-treated animal. Scale bars: 400 μm (B, F, G, and J) and 50 μm (E). Statistical significance was assessed using unpaired, 1-tailed Student’s t test. *P < 0.05; **P < 0.01; ***P < 0.001.
Figure 8
Figure 8. Minnelide shows translational potential.
(A) RCMB28 PDOX cells were implanted into mice 3 weeks before vehicle or Minnelide (0.4 mg/kg, i.p., daily) dosing. Five days later, tumor areas in their brains were measured (vehicle n = 4, Minnelide n = 5). (B) Numbers of Ki67- and C-Casp3–positive cells in brains from similarly treated mice were quantified by IHC analyses (vehicle n = 4, Minnelide n = 5). (C) Metastatic lesions of mice harboring RCMB28-derived tumors and similarly dosed were measured (vehicle n = 4, Minnelide n = 5). (D) RCMB28 were orthotopically implanted 3 days before starting similar vehicle or Minnelide dosing. Symptom-free survival was determined and analyzed using log-rank (Mantel-Cox) tests (n = 10). (E) mG3-2929 cultures were exposed to triptolide alone or in combination with indicated compounds. Cell viability was determined by MTT reduction, and SynergyFinder was used to generate 3D surface plots and obtain synergy scores (cisplatin n = 4, lomustine n = 3, cyclophosphamide n = 5). An HSA score of greater than 10 indicates synergy. (F) Mice were implanted with mG3-2929 cells 8 days before daily dosing with cyclophosphamide (65 mg/kg, i.p.), alone or with Minnelide (0.4 mg/kg, i.p.). Tumor burden was determined by IVIS imaging 8 days later (vehicle/Minnelide n = 5, cyclophosphamide/combination n = 4), and analyzed using 1-way ANOVA followed by Newman-Keuls post hoc test. (G) mG3-2929 were allowed to form tumors for 8 days before starting similar dosing. Symptom-free survival data were analyzed using a log-rank (Mantel-Cox) test (vehicle/cyclophosphamide/combination n = 9, Minnelide n = 10). All tumor area measurements were performed in ×2.5-magnified H&E-stained slides. All images are representative. Arrows indicate tumor presence. All tissues were harvested 6 hours after the last injection. Results are presented as mean ± SEM of data normalized to 1 vehicle-treated animal. Scale bars: 400 μm (A and C) and 50 μm (B). Statistical significance was assessed using unpaired, 1-tailed Student’s t test. *P < 0.05; **P < 0.01; ***P < 0.001; ****P < 0.0001.

References

    1. Curtin SC, et al. Declines in cancer death rates among children and adolescents in the United States, 1999–2014. NCHS Data Brief. 2016;(257):1–8. - PubMed
    1. Louis DN, et al. The 2016 World Health Organization Classification of Tumors of the Central Nervous System: a summary. Acta Neuropathol. 2016;131(6):803–820. doi: 10.1007/s00401-016-1545-1. - DOI - PubMed
    1. Northcott PA, et al. Medulloblastoma comprises four distinct molecular variants. J Clin Oncol. 2011;29(11):1408–1414. doi: 10.1200/JCO.2009.27.4324. - DOI - PMC - PubMed
    1. Cavalli FMG, et al. Intertumoral heterogeneity within medulloblastoma subgroups. Cancer Cell. 2017;31(6):737–754. doi: 10.1016/j.ccell.2017.05.005. - DOI - PMC - PubMed
    1. Taylor MD, et al. Molecular subgroups of medulloblastoma: the current consensus. Acta Neuropathol. 2012;123(4):465–472. doi: 10.1007/s00401-011-0922-z. - DOI - PMC - PubMed

MeSH terms