. 2024 Jun 17;134(15):e170369.
doi: 10.1172/JCI170369.

The IFITM5 mutation in osteogenesis imperfecta type V is associated with an ERK/SOX9-dependent osteoprogenitor differentiation defect

Affiliations

The IFITM5 mutation in osteogenesis imperfecta type V is associated with an ERK/SOX9-dependent osteoprogenitor differentiation defect

Ronit Marom et al. J Clin Invest. .

Abstract

Osteogenesis imperfecta (OI) type V is the second most common form of OI, distinguished by hyperplastic callus formation and calcification of the interosseous membranes, in addition to the bone fragility. It is caused by a recurrent, dominant pathogenic variant (c.-14C>T) in interferon-induced transmembrane protein 5 (IFITM5). Here, we generated a conditional Rosa26-knockin mouse model to study the mechanistic consequences of the recurrent mutation. Expression of the mutant Ifitm5 in osteo-chondroprogenitor or chondrogenic cells resulted in low bone mass and growth retardation. Mutant limbs showed impaired endochondral ossification, cartilage overgrowth, and abnormal growth plate architecture. The cartilage phenotype correlates with the pathology reported in patients with OI type V. Surprisingly, expression of mutant Ifitm5 in mature osteoblasts caused no obvious skeletal abnormalities. In contrast, earlier expression in osteo-chondroprogenitors was associated with an increase in the skeletal progenitor cell population within the periosteum. Lineage tracing showed that chondrogenic cells expressing the mutant Ifitm5 had decreased differentiation into osteoblastic cells in diaphyseal bone. Moreover, mutant IFITM5 disrupted early skeletal homeostasis in part by activating ERK signaling and downstream SOX9 protein, and inhibition of these pathways partially rescued the phenotype in mutant animals. These data identify the contribution of a signaling defect altering osteo-chondroprogenitor differentiation as a driver in the pathogenesis of OI type V.

Keywords: Bone biology; Bone development; Bone disease; Cartilage; Genetics.


Conflict of interest statement

Conflict of interest: The authors have declared that no conflict of interest exists.

Figures

Figure 1
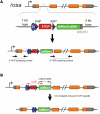
Figure 1. Conditional Rosa26 knockin mIfitm5 mouse model.
The mutant mouse Ifitm5 cDNA was cloned into the Rosa26-DEST vector downstream of a loxP-polyA-loxP stop cassette. The schematic representation also indicates the approximate location of the PCR screening primers in ES cells (A) and genotyping primers in mice (B).
Figure 2
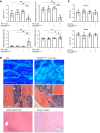
Figure 2. Conditional expression of the mutant Ifitm5 allele results in low bone mass in Rosa26mIfitm5/+ Prx1-Cre mice.
(A) Micro CT analysis in femurs showed a significant decrease in bone architectural parameters in Rosa26mIfitm5/+ Prx1-Cre/– mutant mice, including the BV/TV and trabecular number. Consistently, trabecular spacing was increased. Cortical thickness was not significantly altered. Analysis was performed in 2-month-old male mice (**P < 0.001, by 1-way ANOVA with Tukey’s post hoc tests; n = 7 per group; all comparisons were with the mutant group). (B) Histological sections show immature mesh-like bone matrix in Rosa26mIfitm5/+ Prx1-Cre/– mice, as seen in individuals with OI type V. Images show toluidine blue and H&E staining of bone sections from Rosa26mIfitm5/+ Prx1-Cre/– mice and littermate controls (upper and middle panels). Bottom panel shows a human OI type V bone section for comparison. Scale bars: 200 μm. Original magnification, ×20 (insets). See supplemental Figure 10 for staining control (secondary antibody). (C) Micro CT analysis of femur and spine BV/TV shows no significant difference in Rosa26mIfitm5/+ Oc-Cre/– mice. Analysis was performed in 2-month-old male mice (1-way ANOVA with Tukey’s post hoc tests resulted in no significant differences; n = 5–7 per group; all comparisons were with the mutant group).
Figure 3
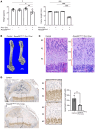
Figure 3. Conditional expression of the mutant Ifitm5 allele results in growth restriction and abnormal growth plate architecture in Rosa26mIfitm5/+ Prx1-Cre mice.
(A) Body weight and femur length were reduced by 10%–15% and 40%–50%, respectively, in Rosa26mIfitm5/+ Prx1-Cre/– mutant mice (a summary of measurements in 2-month-old male mice, 1-way ANOVA with Tukey’s post hoc tests; n = 7 per group, all were comparisons with mutant group. *P < 0.05, **P < 0.001, and ***P < 0.0001). (B) Representative micro CT image of a control (left) and mutant (right) mouse femur. (C) Representative H&E-stained histology images of the proximal tibia from control (left panel) and mutant (Rosa26mIfitm5/+ Prx1-Cre/–, right panel) mice at 2 weeks of age. Images show that staggering of the proliferating chondrocyte was disrupted and the hypertrophic zone was shorter in the mutant mice. (D) IHC for type X collagen highlights the reduced hypertrophic zone (HZ) in mutant mice (Rosa26mIfitm5/+ Prx1-Cre/–, bottom) at 2 weeks of age (right panel: insert magnified), and a summary of the hypertrophic zone length measurements (*P = 0.016, by 2-tailed Student’s t test; n = 3 per group). HZ, hypertrophic zone; PZ, proliferative zone; RZ, resting zone. Scale bars: 200 μm. Original magnification, ×20 (insets).
Figure 4
Figure 4. Conditional expression of the mutant Ifitm5 allele results in increased periosteal skeletal progenitor populations in Rosa26mIfitm5/+ Prx1-Cre mice.
(A) Flow cytometric analysis of skeletal progenitor markers in cells isolated from the periosteum. (B) A significant increase in the CD105+CD140a+ cell population in Rosa26mIfitm5 Prx1-Cre–mutant mice was detected in the periosteum but not in the bone marrow (*P = 0.015, by 2-tailed Student’s t test; n = 6 per group for periosteal cells; n = 4–6 per group for bone marrow cells).
Figure 5
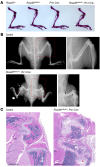
Figure 5. Conditional expression of the mutant Ifitm5 allele in Rosa26mIfitm5/+ Prx1-Cre mice leads to progressive cartilage overgrowth and abnormal development of the ossification centers.
(A) Skeletal preparations of 3-week-old Rosa26mIfitm5/+ Prx1-Cre/– mutant and littermate controls showing skeletal deformities including shortening and bowing of the femur and tibia, and partially mineralized cartilage overgrowth at the knee and ankle. (B) Skeletal radiographs at age 2 months demonstrating short and gracile long bones (red asterisk) with ossification around the knee and ankle (thin and thick white arrows, respectively). Magnified inserts on the right demonstrate sclerotic lines at the femur metaphysis (black arrows). (C) Representative H&E-stained histology images of the proximal tibia of control (left panel) and mutant (Rosa26mIfitm5/+ Prx1-Cre/–, right panel) mice at 2 months of age, showing cartilage overgrowth and disruption of the endochondral ossification (red asterisks). Scale bars: 2 mm.
Figure 6
Figure 6. Activation of ERK signaling contributes to the abnormal skeletal development in OI type V.
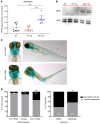
(A) RPPA results from the transgenic Ifitm5c.-14C > T mouse model. The ratio of pERK to total ERK (tERK) RPPA signal intensity was increased in calvaria protein extract from mice overexpressing mutant Ifitm5 (MUT Tg), as compared with mice overexpressing wild type Ifitm5 (WT Tg), and nontransgenic (NT) littermates (n = 8 per group, 1-way ANOVA with Tukey’s post hoc tests, all comparisons were with the MUT Tg group, **P < 0.001). (B) Western blot of representative RPPA samples for pERK and tERK in the transgenic Ifitm5c.-14C > T mouse model. (C) Representative image showing abnormal morphology (abnormal craniofacial development and tail kinking) of embryos injected with mutant IFITM5 mRNA (MUT IFITM5, lower panel) at 5 dpf, compared with normal development of control zebrafish larvae (WT IFITM5, upper panel). Surviving larvae were fixed at 5 dpf and stained with Alcian blue. (D) Left panel: The proportion of IFITM5 mutant zebrafish that demonstrated dysmorphology (34%) was significantly greater compared with wild type and mCherry controls (5%–10%) (**P < 0.001, by χ2 test, n = 113–116 per group). Right panel: Treatment with the ERK inhibitor PD325901 (0.2 μM) partially rescued the abnormal development in IFITM5 mutant zebrafish. The proportion of IFITM5 mutant zebrafish with typical development increased by 18% at 5 dpf (*P < 0.05, by χ2 test, n = 97 in treatment group and n = 87 in the vehicle-treated group).
Figure 7
Figure 7. Expression of the mutant Ifitm5 allele leads to altered spatiotemporal expression of SOX9.
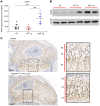
(A) RPPA in the transgenic Ifitm5c.-14C > T mouse model. SOX9 RPPA signal intensity was increased in calvaria protein extract from mice overexpressing mutant Ifitm5, as compared with mice overexpressing wild type Ifitm5, and nontransgenic littermates (n = 8 per group, **P < 0.001, by 1-way ANOVA with Tukey’s post hoc tests, all comparisons were with the mutant Ifitm5 [MUT Tg] group). (B) Western blot for SOX9 in representative RPPA samples. (C) Representative IHC images of proximal tibia of control (top) and mutant (Rosa26mIfitm5/+ Prx1-Cre/–, bottom) mice at 2 weeks of age, showing increased intensity and altered distribution of SOX9+ cells in the growth plate. In the mutant mice, SOX9+ cells are seen throughout the growth plate including the hypertrophic zone (which is reduced compared with littermate controls). Scale bar: 200 μm. Original magnification, ×20 (insets). See supplemental Figure 10 for the staining control (secondary antibody).
Figure 8
Figure 8. Abnormal skeletal development in Rosa26mIfitm5 Acan-Cre ERT2 mice is partially rescued by Sox9 deletion.
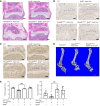
(AC) Histology sections of Rosa26mIfitm5/+ Acan-Cre ERT2 mice, showing disrupted growth plate architecture caused by postnatal activation of mutant Ifitm5 in chondrocytes (left panel, bottom), while Sox9 deletion (right panel, bottom) rescued the growth plate structure. H&E staining (A) and IHC analysis for SOX9 (B) and type X collagen (C). Scale bars: 200 μm. (D) Images show growth delay in Rosa26mIfitm5/+ Acan-Cre ERT2–mutant mice (middle) compared with wild type (left) and partial rescue by Sox9 deletion (right). (E) Micro CT analysis of femur length (left) and BV/TV (right) in Rosa26mIfitm5/+ Acan-Cre ERT2 mice, showing low bone mass in mutant mice and partial rescue by Sox9 deletion (###P = 0.0005, by 1-way ANOVA, n = 6–8 per group). For all experiments shown, Cre recombinase was activated by i.p. tamoxifen injections (10 mg/kg/dose) at P10–P15, and samples were collected from mice at 5 weeks of age.
Figure 9
Figure 9. Expression of the mutant Ifitm5 allele leads to altered skeletal stem cell differentiation and enhanced chondrogenesis.
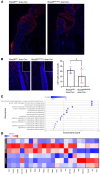
(AB) Lineage tracing of chondrocytes coexpressing mutant Ifitm5 and Ai9 reporter in Rosa26mIfitm5/Ai9 Acan-Cre ERT2 mice. Tamoxifen injection was performed at P10, and bones were collected after 3 weeks (at 5 weeks of age). Representative images of the proximal tibia (A) and the tibia diaphyseal area (B) Decreased fraction of Ai9+ cells migrated to the bone diaphysis in mutant animals compared with littermate controls (n = 3 per genotype; n = 2–3 fields counted per sample; *P = 0.03, by 2-tailed Student’s t test). Original magnification, ×20. (C) RNA-Seq of total femoral cDNA from Rosa26mIfitm5/+ Acan-Cre ERT2 mice (n = 3 per genotype) showed enrichment for chondrogenic gene expression in the mutant samples by GO term analysis. (D) Heatmap of focused differential gene expression analysis from RNA-Seq, showing upregulation of chondrogenic gene markers and decreased expression of osteogenic markers in the mutants compared with the control group.

References

    1. Marini JC, et al. Osteogenesis imperfecta. Nat Rev Dis Primers. 2017;3:17052. doi: 10.1038/nrdp.2017.52. - DOI - PubMed
    1. Marom R, et al. Osteogenesis imperfecta: an update on clinical features and therapies. Eur J Endocrinol. 2020;183(4):R95–R106. doi: 10.1530/EJE-20-0299. - DOI - PMC - PubMed
    1. Rossi V, et al. Osteogenesis imperfecta: advancements in genetics and treatment. Curr Opin Pediatr. 2019;31(6):708–715. doi: 10.1097/MOP.0000000000000813. - DOI - PMC - PubMed
    1. Jovanovic M, et al. Osteogenesis imperfecta: mechanisms and signaling pathways connecting classical and rare OI types. Endocr Rev. 2022;43(1):61–90. doi: 10.1210/endrev/bnab017. - DOI - PMC - PubMed
    1. Bardai G, et al. DNA sequence analysis in 598 individuals with a clinical diagnosis of osteogenesis imperfecta: diagnostic yield and mutation spectrum. Osteoporos Int. 2016;27(12):3607–3613. doi: 10.1007/s00198-016-3709-1. - DOI - PubMed

MeSH terms

Substances

Supplementary concepts