. 2024 Oct 4;14(10):1940-1963.
doi: 10.1158/2159-8290.CD-23-1379.

Iron-(Fe3+)-Dependent Reactivation of Telomerase Drives Colorectal Cancers

Affiliations

Iron-(Fe3+)-Dependent Reactivation of Telomerase Drives Colorectal Cancers

Raghuvaran Shanmugam et al. Cancer Discov. .

Abstract

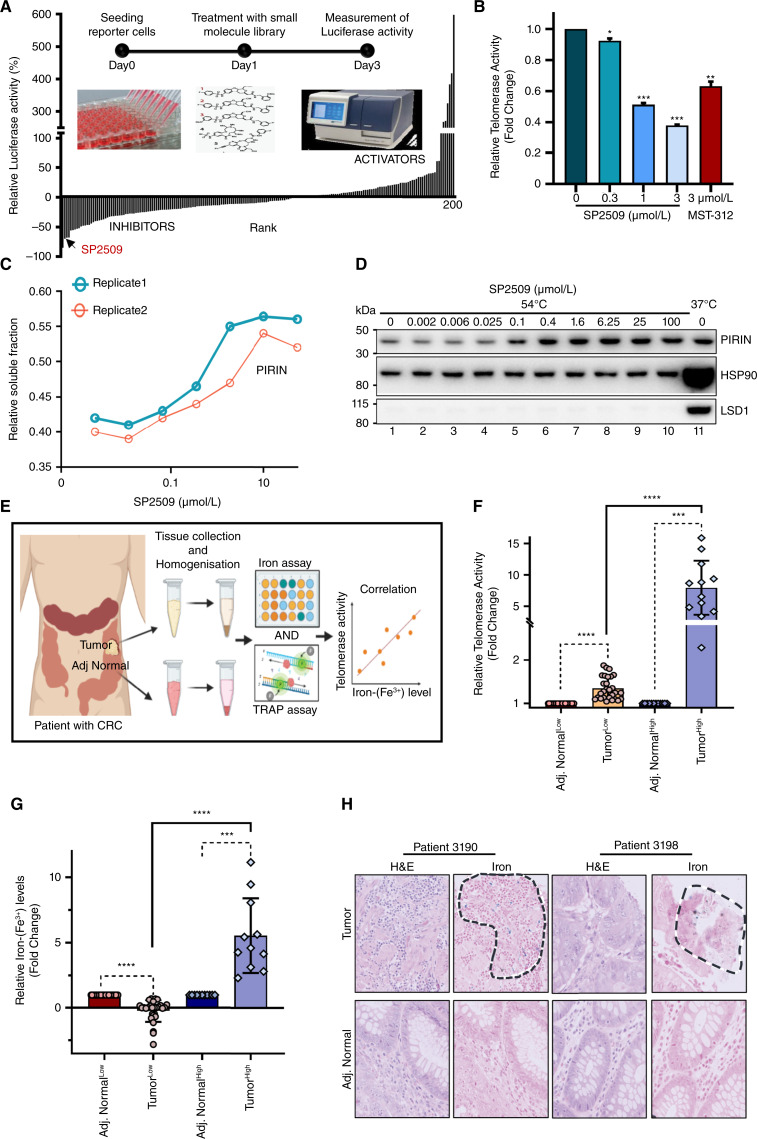
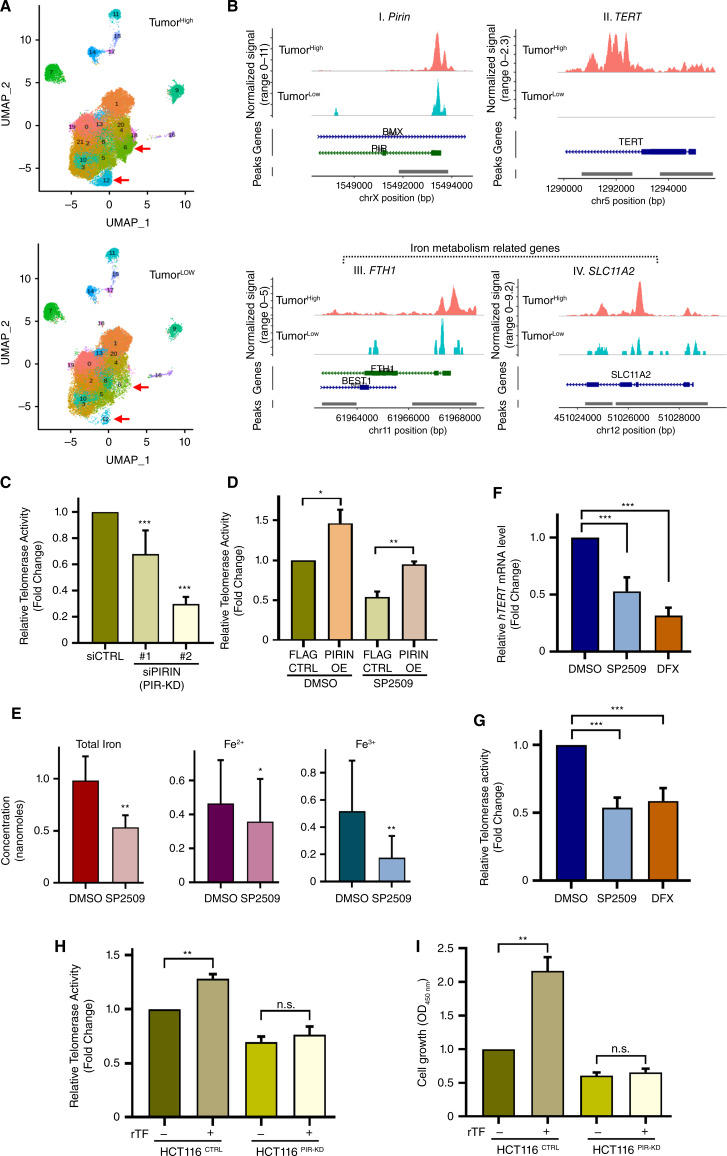
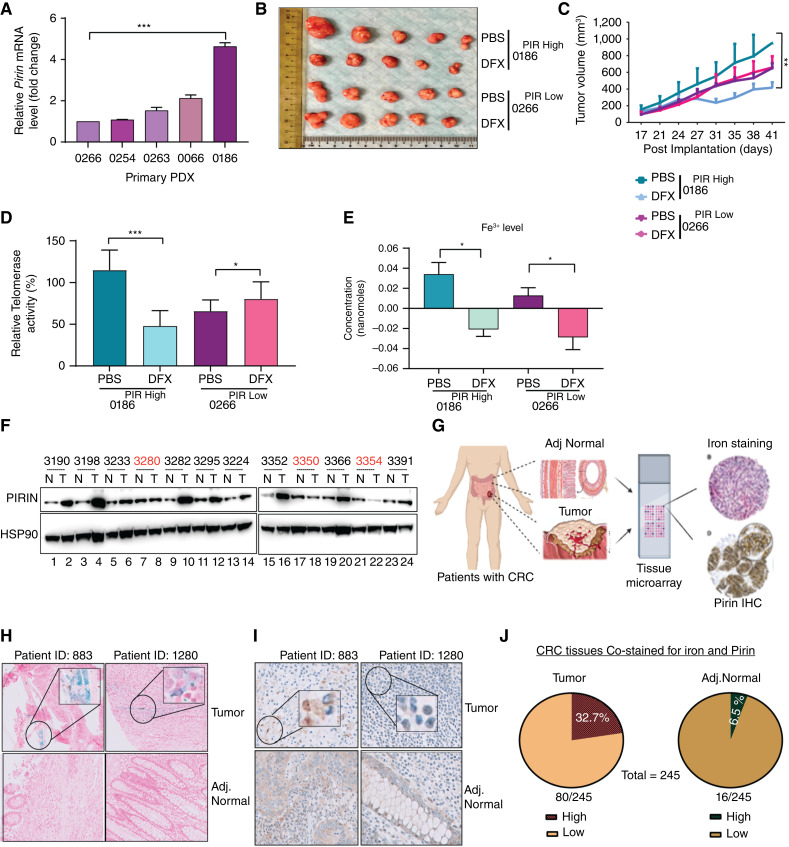
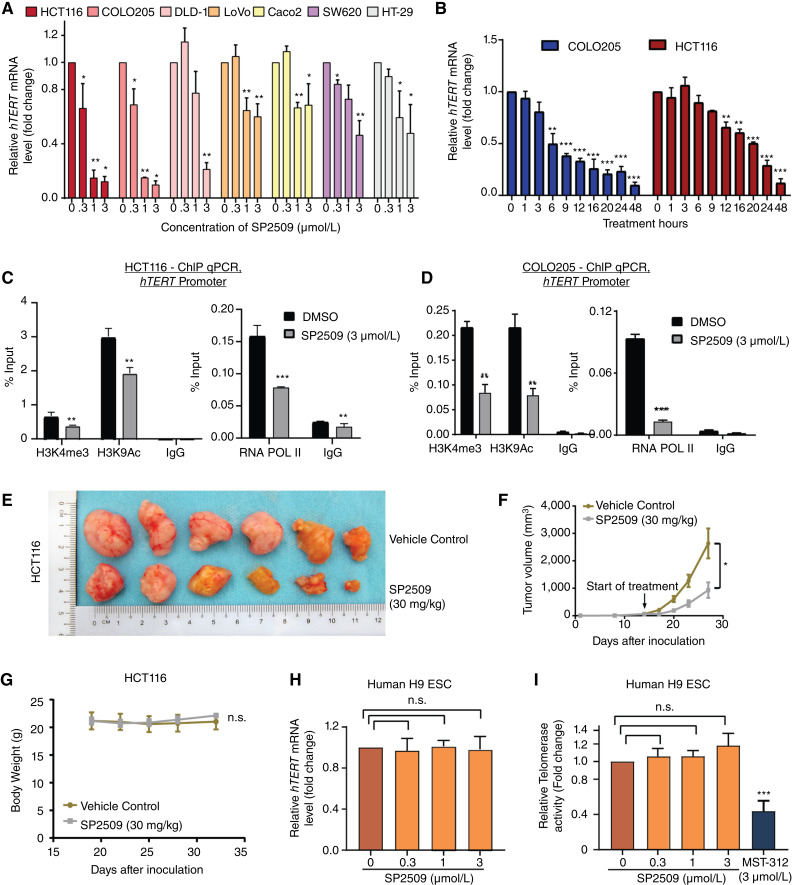
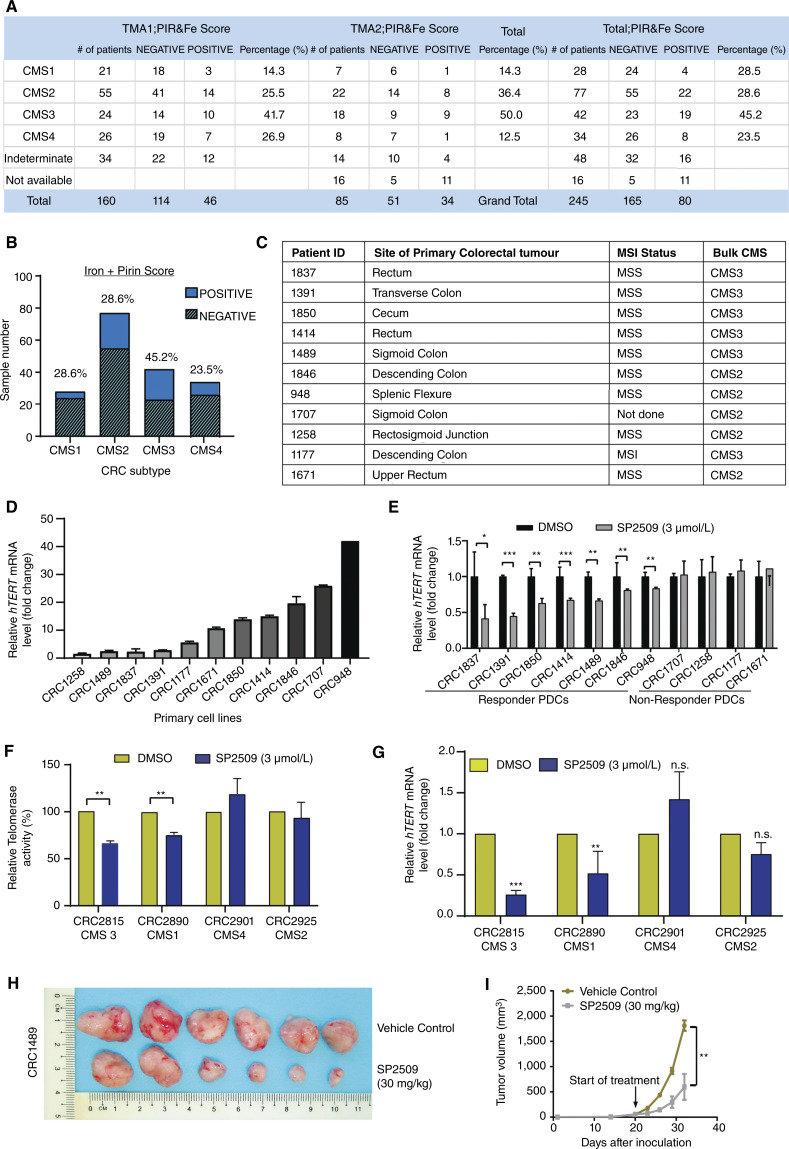
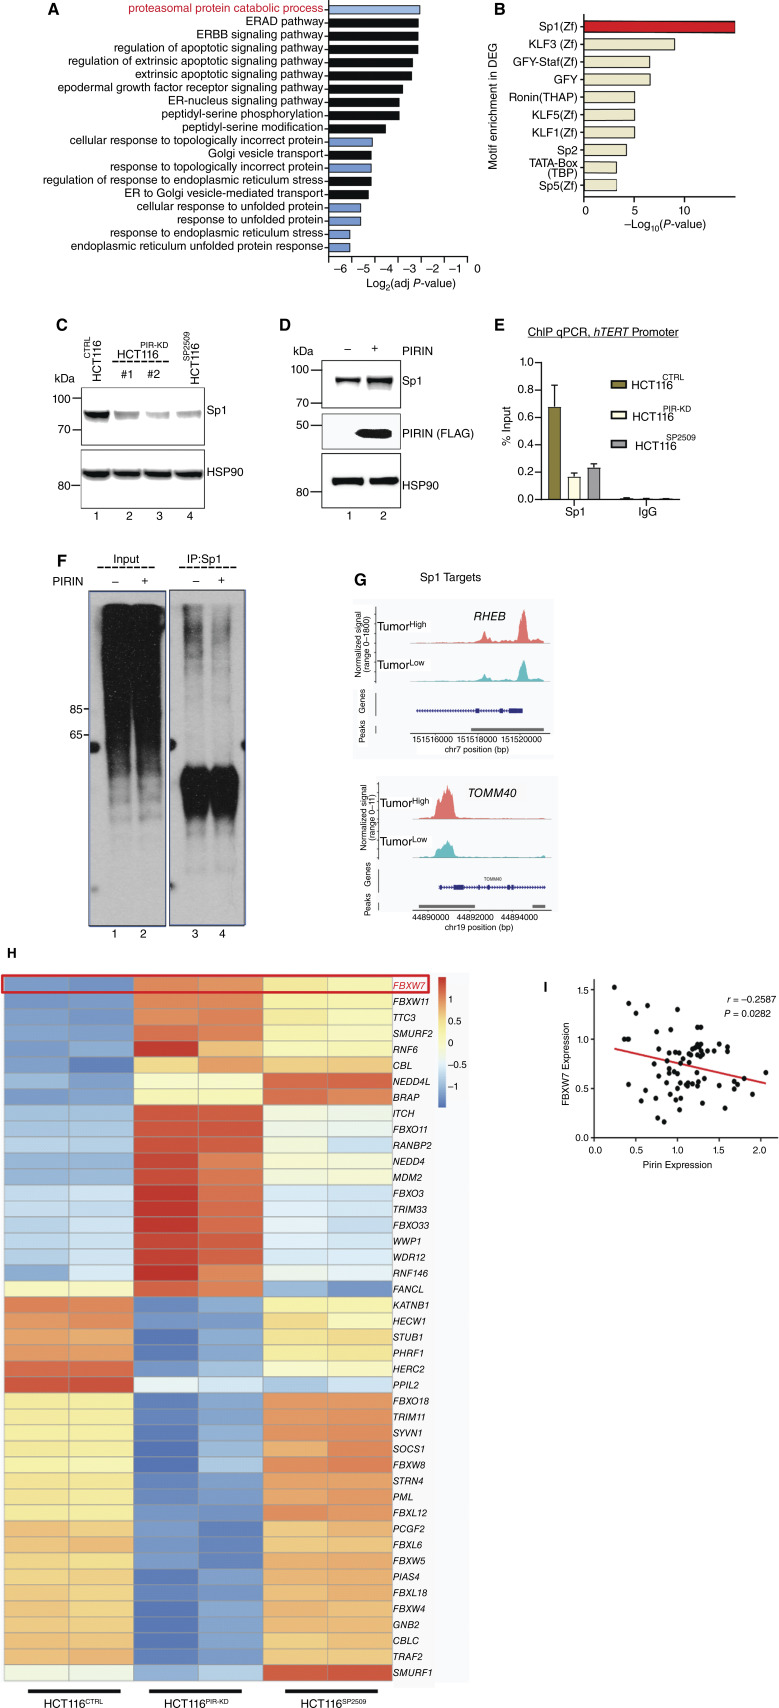
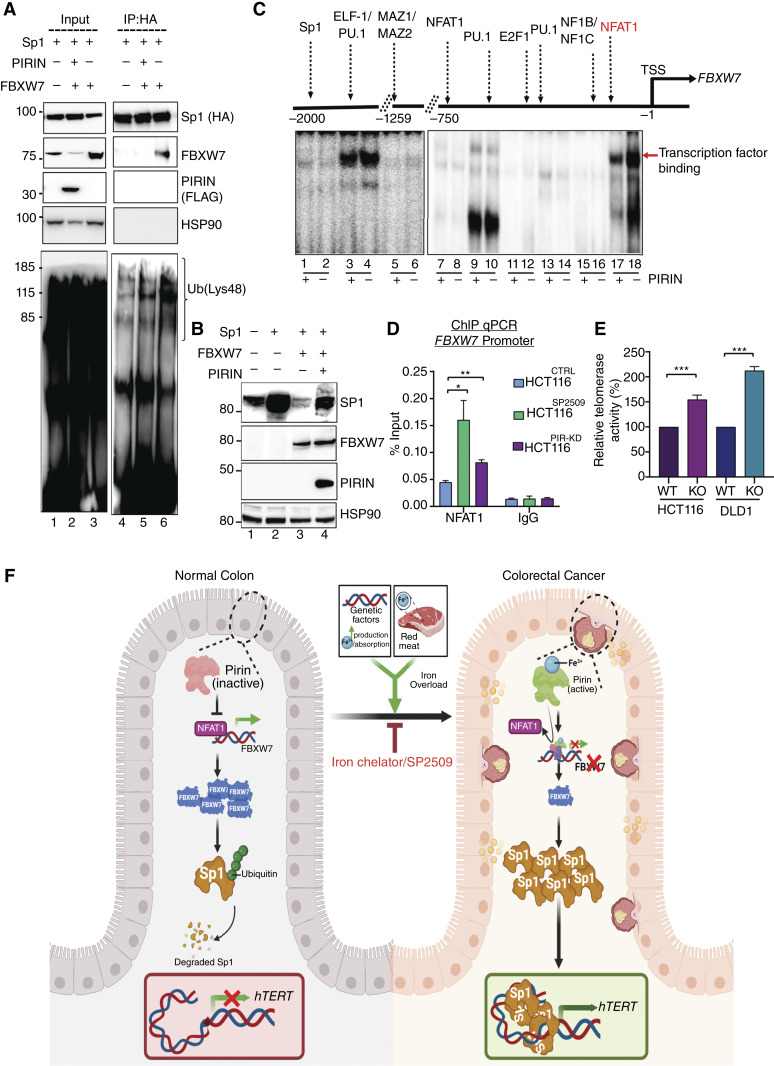
Over-consumption of iron-rich red meat and hereditary or genetic iron overload are associated with an increased risk of colorectal carcinogenesis, yet the mechanistic basis of how metal-mediated signaling leads to oncogenesis remains enigmatic. Using fresh colorectal cancer samples we identify Pirin, an iron sensor, that overcomes a rate-limiting step in oncogenesis, by reactivating the dormant human telomerase reverse transcriptase (hTERT) subunit of the telomerase holoenzyme in an iron-(Fe3+)-dependent manner and thereby drives colorectal cancers. Chemical genetic screens combined with isothermal dose-response fingerprinting and mass spectrometry identified a small molecule SP2509 that specifically inhibits Pirin-mediated hTERT reactivation in colorectal cancers by competing with iron-(Fe3+) binding. Our findings, first to document how metal ions reactivate telomerase, provide a molecular mechanism for the well-known association between red meat and increased incidence of colorectal cancers. Small molecules like SP2509 represent a novel modality to target telomerase that acts as a driver of 90% of human cancers and is yet to be targeted in clinic. Significance: We show how iron-(Fe3+) in collusion with genetic factors reactivates telomerase, providing a molecular mechanism for the association between iron overload and increased incidence of colorectal cancers. Although no enzymatic inhibitors of telomerase have entered the clinic, we identify SP2509, a small molecule that targets telomerase reactivation and function in colorectal cancers.


Conflict of interest statement

R. Shanmugam reports a patent for Specific inhibition of telomerase activity in colorectal cancer pending. J.-L. Low reports grants from National Research Foundation, Singapore, during the conduct of the study. I.B. Tan reports grants and personal fees from MSD and Roche, personal fees from BMS, AstraZeneca, and Merck Serano, and personal fees from Amgen outside the submitted work; in addition, I.B. Tan has a patent for related to current work pending. V. Tergaonkar reports grants from National Research Foundation (NRF) and National Medical Research Council (NMRC) during the conduct of the study. No disclosures were reported by the other authors.

Figures

Figure 1.
Figure 1.
Identification of SP2509 and its target Pirin as a regulator of hTERT in colorectal cancer. A, Drug-response screening plot showing activators and inhibitors obtained from a high-throughput screen using a small-molecule library targeting epigenetic modifiers. Luciferase activity was measured as a readout. The hit SP2509 was investigated further. The schematic within the screening plot describes the process of screening using a small-molecule library. B, Relative telomerase activity was measured by TRAP assay in HCT116 cells treated with various doses of SP2509 or MST312 (known telomerase inhibitor, 3 µmol/L) for 48 hours. C, Graph showing the proportion of Pirin bound and stabilized by SP2509 in the soluble fraction of cellular lysate, as measured by MS. Cell lysates were incubated with DMSO or SP2509 for 5 minutes before denaturation by heat (54°C) and sample preparation for LC/MS. D, Western blot showing Pirin levels and its stabilization at higher temperature (54°C) in a dose-dependent manner by SP2509 while using 37°C as control. E, Schematic showing steps involved in studying the correlation between telomerase activity and iron-(Fe3+) levels in colorectal cancer. Tumor and adjacent normal tissues were collected from patients with colorectal cancer and were homogenized and further used for TRAP assay and iron assay. F, Dot plot displaying telomerase activity of tumor and adjacent normal tissues as measured by TRAP assay (n = 40). Tumors were segregated into telomerase-low (indicated as TumorLow) and telomerase-high (indicated as TumorHigh) groups. Values were derived from a minimum of five replicates for each sample. *, P < 0.05; **, P < 0.005; ***, P < 0.0001. (G) Dot plot displaying fold change in iron-(Fe3+) levels for each tumor and adjacent normal tissue pairs measured using an iron assay kit (n = 40). Tumors were segregated into iron-(Fe3+) low (indicated as Tumor Low) and iron-(Fe3+) high (indicated as TumorHigh) groups. Values were derived from a minimum of three replicates for each sample. *P < 0.05, **P < 0.005, ***P < 0.0001. (H) Representative images showing hematotoxin and eosin (H&E) and iron (PB) staining of tumor and adjacent normal sections from two patients. Iron-stained regions of tumor sections are marked by black dotted lines. (A and E, created with BioRender.com.)
Figure 2.
Figure 2.
Pirin regulates hTERT activation in an iron-(Fe3+) dependent manner. A, The UMAP visualization of major cell types of patients with colorectal cancer based on scATAC-seq in two groups, TumorHigh and TumorLow. Proportion analysis of epithelial subclusters showed increased cell populations (clusters 6 and 12, marked by red arrows) in TumorHigh patient samples. B, Normalized scATAC-seq sequencing tracks for different genes as specified on top of each track. Comparison of clusters 6 and 12 between TumorHigh and TumorLow samples showed more open chromatin accessibility of PIRIN (I), TERT (II), and also of iron metabolism-related genes [FTH1 (III), SLC11A2 (IV)] in TumorHigh patient samples. C, Relative telomerase activity was measured by TRAP assay in HCT116 cells 48 hours after Pirin knockdown (KD) using two different siRNAs. D, Relative telomerase activity was measured by TRAP assay, 48 hours after treatment with or without SP2509 (3 µmol/L) in control (indicated as FLAG CTRL) and Pirin overexpressing HCT116 cells (indicated as PIRIN OE). E, Graph showing levels of iron in HCT116 cells after treatment with SP2509 or DMSO. Fe2+ is the reduced form of iron, Fe3+ is the oxidized form of iron, whereas total iron represents a combination of Fe2+ and Fe3+ levels together. Error bars show the standard deviation of three independent replicates. (F and G) qPCR-based relative mRNA expression of hTERT (F) and relative telomerase activity measured by TRAP assay (G) of HCT116 cells treated with SP2509 (3 µmol/L), deferasirox (DFX, 10 µmol/L), or DMSO for 48 hours. H and I, Measurements of telomerase activity by TRAP assay (H) and cell growth by CCK8 assay (I) of HCT116 control (HCT116CTRL) and Pirin knocked down HCT116 (HCT116PIR-KD) cells treated with PBS or recombinant transferrin (rTF) for 72 hours. *, P < 0.05; **, P < 0.01; ***, P < 0.005; n.s., nonsignificant.
Figure 3.
Figure 3.
Pirin levels correlate with iron-(Fe3+) levels and with hTERT activity in colorectal cancers. A, qPCR-based mRNA analysis of Pirin gene expression in PDXs, normalized to β-actin expression in each sample. B, Image of PDX tumors developed in NSG mice. PDXs with low (0266PIR Low) and high (0186PIR High) Pirin (PIR) expression in NSG mice were treated with the iron chelator DFX or PBS for 3 weeks (twice weekly). C, Graph showing tumor volume over a 3-week study period in NSG mice injected with DFX or PBS (twice weekly). D, Telomerase activity was measured by TRAP assay in NSG mice PDXs treated with DFX or PBS for 3 weeks. Tumors were harvested after study termination, and a TRAP assay was performed. Error bars indicate the standard deviation of five biological replicates for each group. E, Graph showing levels of iron-(Fe3+) in PDX tumors (0186PIR High, 0266PIR Low) developed in NSG mice treated with PBS or DFX for 3 weeks. Error bars indicate the standard deviation of five biological replicates for each group. F, Western blot showing levels of Pirin in normal (N) and tumor (T) samples from patients with colorectal cancer used for studying telomerase and iron-(Fe3+) correlation in Fig. 1B–E. HSP90 was used as a loading control. The samples marked red did not show any correlation between Pirin and telomerase. G, Schematic illustrating the construction of tissue microarray using tumor and adjacent normal tissues from patients with colorectal cancer and staining for iron (PB staining) and Pirin (IHC) staining) in 245 patients with colorectal cancer matched normal and tumor samples. H and I, Representative images of two patient samples (tumor and adjacent normal) stained for iron with PB (H) and for Pirin with IHC (I). Iron-stained regions in tumor sections are marked by black circles. J, Pie chart showing percentages of tumor (left) and adjacent normal (right) samples showing high and low iron-(Fe3+) and low Pirin levels by PB staining and IHC, respectively. *, P < 0.05; **, P < 0.005; ***, P < 0.0001; n.s., nonsignificant.
Figure 4.
Figure 4.
Effect of SP2509 and iron-(Fe3+) on various cell lines and xenografts. A, qPCR-based gene expression quantification of hTERT gene in various colorectal cancer cell lines treated with DMSO or SP2509 for 48 hours at indicated concentrations. *, P < 0.05; **, P < 0.01. B, qPCR-based gene expression quantification of hTERT gene in COLO205 and HCT116 cells after treatment with SP2509 (3 µmol/L) at different time points as indicated. *, P < 0.05; **, P < 0.01; ***, P < 0.005. C and D, ChIP-qPCR analysis of histone marks (H3K4me3 and H3K9Ac) and RNA POL II occupancy of hTERT proximal promoter from HCT116 cells (C) and COLO205 cells (D) treated with SP2509 (3 µmol/L) or DMSO for 24 hours. Samples were normalized to the input, and IgG was used as a control. E, Image of xenograft tumors developed in NSG mice. HCT116-derived xenografts in NSG mice were treated with SP2509 or DMSO for 3 weeks (twice weekly) at 30-mg/kg body weight. F, Graph showing tumor volume over a 3-week study period in NSG mice injected with SP2509 (30 mg/kg) or DMSO (twice weekly). G, Graph showing body weight of NSG mouse groups implanted with PDX tumors and injected with SP2509 (30 mg/kg) or DMSO (twice weekly over a study period of 3 weeks). The SP2509-treated samples were normalized with respect to DMSO treated control group. Error bars indicate the standard deviation of five biological replicates for each group. (H and I) qPCR-based analysis of hTERT gene expression (H) and Telomerase activity measured by TRAP (I) of human H9 embryonic stem cells treated with specified doses of SP2509 or DMSO for 48 hours. MST312 (3 µmol/L) was used as a positive control to measure telomerase inhibition. *, P < 0.05; **, P < 0.01; ***, P < 0.005; n.s., nonsignificant.
Figure 5.
Figure 5.
Iron-(Fe3+) regulates colorectal cancer development via hTERT activation. A, Table showing the distribution of CMS among the patient cohort segregated by iron-(Fe3+) and Pirin levels in their tumor and normal sections. B, Graph showing the percentage distribution of CMS types among the patient cohort with positive and negative staining for iron and Pirin. C, List of primary patient-derived cell lines indicating the patient ID, tumor site, genomic alterations (microsatellite stable: MSS/microsatellite instable: MSI), and CMS status. D, qPCR-based expression quantification of hTERT gene in various patient-derived (primary) cell lines. Expression was normalized to β-actin levels. E, qPCR-based mRNA quantification of hTERT in PDCs treated with SP2509 (3 µmol/L) or DMSO for 48 hours. F and G, Telomerase activity (F) measured by TRAP and qPCR-based mRNA quantification of hTERT (G) in PDO representing different CMS types. PDOs were treated with SP2509 or DMSO for 48 hours. Each organoid represents a different CMS. Error bars indicate the standard deviation of three biological replicates. *, P < 0.05; **, P < 0.005; ***, P < 0.0001. H, Image of PDX tumors after termination of treatment in NSG mouse groups injected with SP2509 or DMSO. I, Graph showing tumor volume over a 2-week study period in NSG mice groups injected with SP2509 (30 mg/kg) or DMSO (twice weekly). *, P < 0.05; **, P < 0.005; ***, P < 0.0001.
Figure 6.
Figure 6.
SP1 drives Pirin and iron-(Fe3) mediated activation of hTERT. A, GO analysis of common DEGs of HCT116SP2509 or HCT116PIR-KD cells. The top affected pathway is highlighted in red. B, TF motif analysis of downregulated DEGs in HCT116SP2509 or HCT116PIR-KD cells. C, Western blot image showing levels of Sp1 protein in HCT116SP2509 or HCT116PIR-KD cells (with two different siRNAs). D, Western blot of levels of Sp1 protein in HCT116 cells overexpressing Pirin. HSP90 was used as a loading control. E, ChIP-qPCR analysis of Sp1 occupancy on hTERT proximal promoter from HCT116SP2509 or HCT116PIR-KD cells. Samples were normalized to the input, and IgG was used as a control. **, P < 0.01. F, Western blot of the levels of Sp1 ubiquitination using K48 ubiquitin-specific antibody in HCT116 cells stably overexpressing Pirin. G, Normalized scATAC-seq sequencing tracks for Sp1 target genes as specified on top of each track showing more open chromatin accessibility of RHEB and TOMM40 gene promoters in TumorHigh patient samples as obtained from the sc-ATAC-seq analysis. H, Heat map showing differential expression of ubiquitin ligase genes, which highlighted FBXW7 (marked red) as a key change that could mediate effects on Sp1. Experiments involving Pirin knockdown were transient and used two different siRNAs. I, Correlation between iron-(Fe3+), Pirin, and FBXW7 in samples of patients with colorectal cancer. Analysis of 72 samples by board-certified pathologists using IHC (for Pirin, FBXW7) and PB staining (for iron) revealed that FBXW7 levels are negatively correlated with Pirin and iron-(Fe3+) levels (r = −0.2587; P = 0.0282). The correlation was derived by using Pearson’s test.
Figure 7.
Figure 7.
Pirin-mediated downregulation of FBXW7 drives Sp1 stability and hTERT activation. A, Co-immunoprecipitation experiment showing the effect of Pirin on the interaction between FBXW7 and Sp1 in HCT116 cells. HCT116 were transfected with FBXW7-plvx, Sp1-HA, and PIRIN-FLAG for FBXW7, Sp1, and Pirin, respectively. Sp1 could interact with FBXW7. However, introducing Pirin can decrease the K48 ubiquitination of Sp1 caused by FBXW7. Data are representative of multiple repeat experiments with similar results. B, Western blot showing the level of Sp1 in HCT116 cells with and without FBXW7 and Pirin overexpression. The level of Sp1 decreased upon FBXW7 overexpression and was rescued by Pirin overexpression. C, Phospho image showing binding of various TFs to FBXW7 promoter in HCT116 cells with (+) and without (−) Pirin overexpression using electrophoresis mobility shift assay. Overexpression of Pirin reduced the abundance of NFAT1 and PU1 on the proximal FBXW7 promoter. Data are representative of two repeat experiments with similar results. D, ChIP-qPCR analysis of NFAT1 occupancy of FBXW7 proximal promoter in HCT116 cells treated with SP2509 (HCT116SP2509) or with Pirin knockdown (HCT116PIR-KD) and compared with HCT116 control cells (HCT116CTRL). Samples were normalized to the input, and IgG was used as a control. *, P < 0.05; **, P < 0.01. E, Telomerase activity was measured by TRAP assay in FBXW7-knockout (KO) HCT116 and DLD1 cells. The FBXW7 KO cells were sorted and selected after CRISPR genome editing. ***, P-value < 0.0001. F, Model of colorectal cancer pathogenesis by iron-(Fe3+)-dependent Pirin and its therapeutic targeting. The transformation of normal colonic epithelium to colorectal cancer is mainly attributed to genetic events that include driver mutations contributing to the adenoma–carcinoma progression as well as nongenetic factors like high iron levels. Here, we show that Pirin binding with iron-(Fe3+) (from sources such as red meat or because of iron overload due to genetic conditions like hereditary hemochromatosis) leads to its ability as a transcription factor, and this complex reduces NFAT1 occupancy on the FBXW7 promoter. On the reduced synthesis of FBXW7 protein, ubiquitination of Sp1 decreases leading to increased steady-state levels of Sp1. Consequently, Sp1 multimers activate hTERT transcription, leading to the reconstitution and activation of telomerase activity in cancer cells, causing cellular immortalization. Further molecules like SP2509 or iron chelators (DFX) that can block this pathway could be developed for colorectal cancer and other iron-dependent cancers. (F, created with BioRender.com.)

References

    1. Cho YA, Lee J, Oh JH, Chang HJ, Sohn DK, Shin A, et al. . Genetic risk score, combined lifestyle factors and risk of colorectal cancer. Cancer Res Treat 2019;51:1033–40. - PMC - PubMed
    1. Keum N, Giovannucci E. Global burden of colorectal cancer: emerging trends, risk factors and prevention strategies. Nat Rev Gastroenterol Hepatol 2019;16:713–32. - PubMed
    1. Brink M, Weijenberg MP, de Goeij AF, Roemen GM, Lentjes MH, de Bruine AP, et al. . Meat consumption and K-ras mutations in sporadic colon and rectal cancer in The Netherlands Cohort Study. Br J Cancer 2005;92:1310–20. - PMC - PubMed
    1. Sato Y, Nakaya N, Kuriyama S, Nishino Y, Tsubono Y, Tsuji I. Meat consumption and risk of colorectal cancer in Japan: the Miyagi Cohort Study. Eur J Cancer Prev 2006;15:211–8. - PubMed
    1. Gurjao C, Zhong R, Haruki K, Li YY, Spurr LF, Lee-Six H, et al. . Discovery and features of an alkylating signature in colorectal cancer. Cancer Discov 2021;11:2446–55. - PMC - PubMed