. 2024 Aug;11(31):e2307695.
doi: 10.1002/advs.202307695. Epub 2024 Jun 17.

A Novel AMPK Inhibitor Sensitizes Pancreatic Cancer Cells to Ferroptosis Induction

Affiliations

A Novel AMPK Inhibitor Sensitizes Pancreatic Cancer Cells to Ferroptosis Induction

Carolin Schneider et al. Adv Sci (Weinh). 2024 Aug.

Abstract

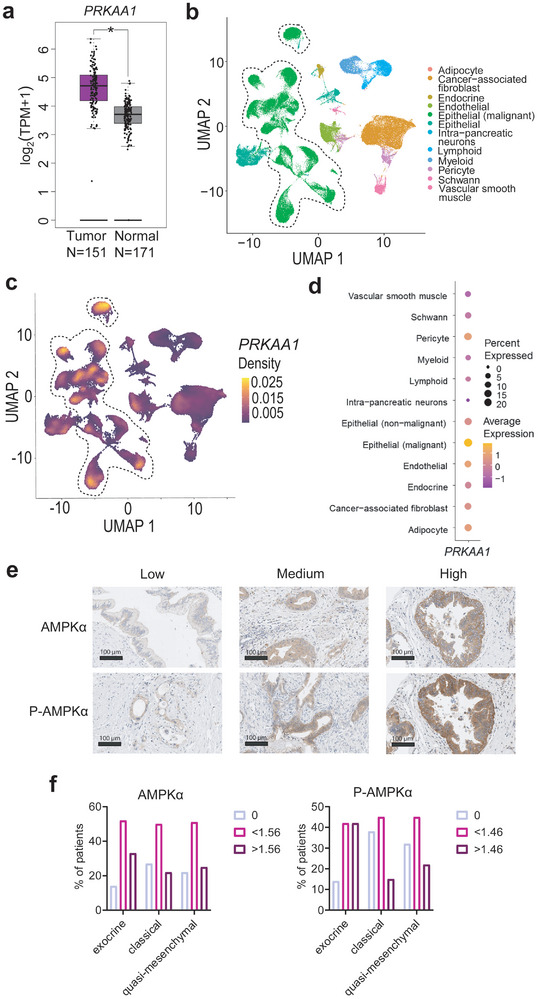
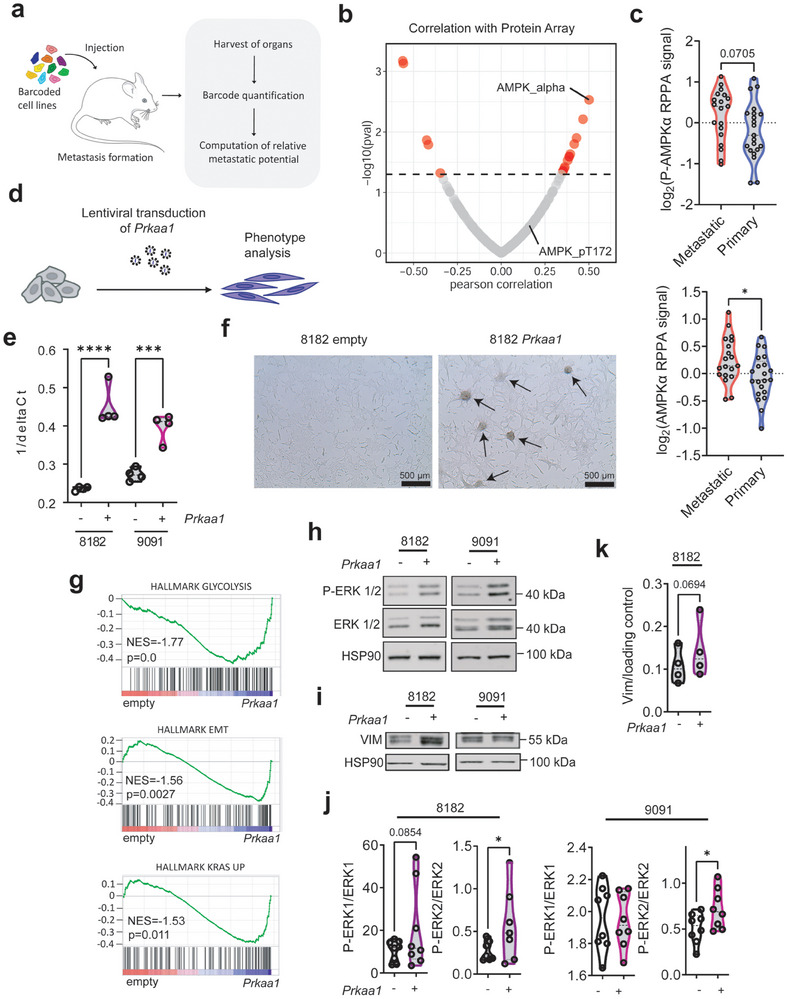
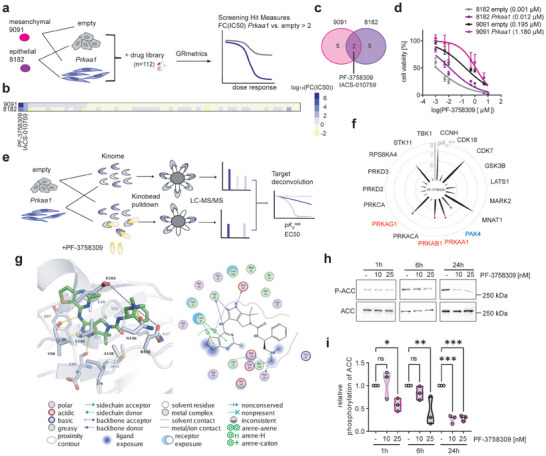
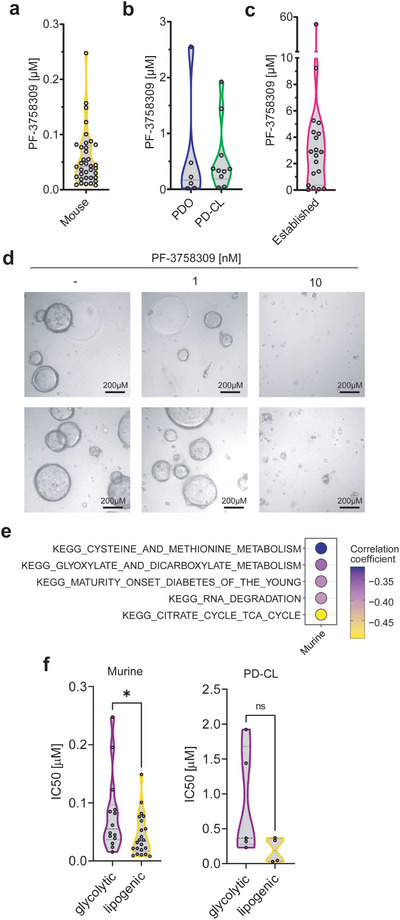
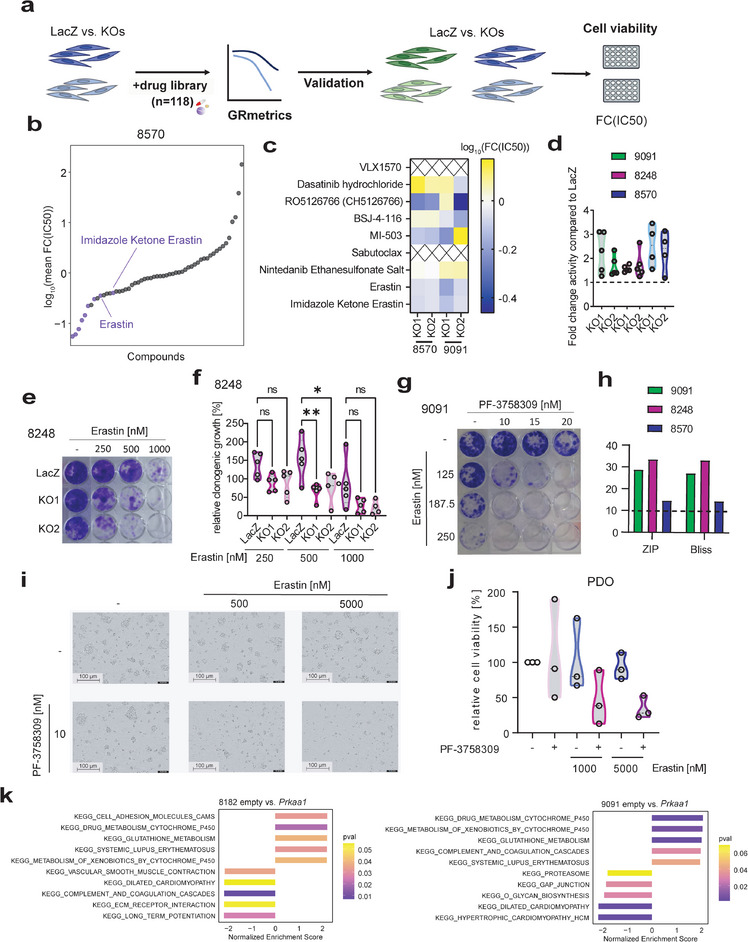
Cancer cells must develop strategies to adapt to the dynamically changing stresses caused by intrinsic or extrinsic processes, or therapeutic agents. Metabolic adaptability is crucial to mitigate such challenges. Considering metabolism as a central node of adaptability, it is focused on an energy sensor, the AMP-activated protein kinase (AMPK). In a subtype of pancreatic ductal adenocarcinoma (PDAC) elevated AMPK expression and phosphorylation is identified. Using drug repurposing that combined screening experiments and chemoproteomic affinity profiling, it is identified and characterized PF-3758309, initially developed as an inhibitor of PAK4, as an AMPK inhibitor. PF-3758309 shows activity in pre-clinical PDAC models, including primary patient-derived organoids. Genetic loss-of-function experiments showed that AMPK limits the induction of ferroptosis, and consequently, PF-3758309 treatment restores the sensitivity toward ferroptosis inducers. The work established a chemical scaffold for the development of specific AMPK-targeting compounds and deciphered the framework for the development of AMPK inhibitor-based combination therapies tailored for PDAC.

Keywords: AMPK; ferroptosis; pancreatic cancer.


Conflict of interest statement

The authors declare no conflict of interest.

Figures

Figure 1
Figure 1
Prkaa1 is upregulated in a PDAC subtype. a) The PAAD dataset with curated 151 samples was matched to 171 GTEx samples by a GEPIA analysis (http://gepia2.cancer‐pku.cn/). Tissues are color‐coded (purple: Tumor, grey: Normal). mRNA expression is shown in log2(TPM+1). Log2FC cutoff: 0.58, p‐value cutoff: 0.05. PAAD: Pancreatic adenocarcinoma, GTEx: Genotype‐Tissue Expression project. b) UMAP of scRNA‐Seq of 18 PDAC patients with color‐coded cell types. Epithelial (malignant) cells are highlighted by a dashed line. N (cells) = 108917. c) Density plot of PRKAA1 projected on UMAP of b. Density is color‐coded. d) Average expression of PRKAA1 in cell types. Cell types are shown in rows and PRKAA1 is shown in the column. The percentage (%) of cells expressing the gene is indicated by circle size. The maximum expression of the gene by cell type is color‐coded. e) Immunohistochemistry staining of P‐AMPKα and AMPKα in a cohort of 107 PDAC patients. Intensities of stained PDAC cells include low, medium, and high. f) Quantification of P‐AMPKα and AMPKα stained PDACs in exocrine (N = 21), classical (N = 44), and quasi‐mesenchymal (N = 31) subtypes. The percentage (%) of PDAC patients with specific subtypes and staining intensity is shown. Staining intensities are divided into three levels using a cut‐off finder (AMPKα: 0, <1.56, >1.56; P‐AMPKα: 0, <1.46, >1.46). Statistical analysis was performed by chi‐squared test.
Figure 2
Figure 2
Prkaa1 expression is correlated with de‐differentiation and metastasis. Data of a, b, and c, were accessed via https://depmap.org/. a) Scheme of in vivo barcoding strategy to determine the metastatic potential of human cancer cell lines in mouse xenografts. Cancer cell lines were barcoded, pooled, and injected into immunodeficient mice. After metastatic growth, organs were harvested, and DNA barcodes were quantified by next‐generation sequencing. The metastatic potential of each cell was quantified as barcode enrichment relative to the abundance in the pre‐injected population. b) Correlation of protein array data (N(Antibodies) = 214) with metastatic potential in human PDAC cell lines. On the x‐axis, the Pearson correlation coefficient is shown. On the y‐axis ‐log(pval) is shown. Cut‐off:1.3. c) log2(RPPA signal) of P‐AMPKα at Thr172 and AMPKα in primary and established pancreatic cancer cell lines derived from primary tumors or metastatic sites. Statistical analysis was performed by a two‐tailed unpaired t‐test. d) Scheme of generation of Prkaa1 overexpressing cell lines. Cells were generated by lentiviral transduction of a PGK‐Vector expressing Prkaa1. e) qPCR of Prkaa1 mRNA in empty vector control (−) and Prkaa1 vector (+) transduced cells. The quantity of Prkaa1 expression is shown on the x‐axis as 1/delta Ct. Statistical analysis was performed by one‐way ANOVA with Bonferroni correction. f) Microscopic pictures of 8182 PDAC cells transduced with empty vector control or the Prkaa1 vector. The scale bar is shown in the bottom left. Arrowhead: spheroid growth pattern. g) GSEA of RNA‐Seq data in 8182 empty versus 8182 Prkaa1 cells using the HALLMARK gene set database. Normalized enrichment scores (NES) and p‐values (p) are shown. Western Blots of ERK pathway h) and Vimentin i) in empty (−) and Prkaa1 (+) overexpressing cells. ERK pathway was investigated using P‐ERK1/2 and ERK1/2 antibodies. HSP90 was used as loading control. The same lysates were transferred to two membranes and subsequently, incubated with either pan or phospho‐antibodies and used to determine the relative phosphorylation level of protein of interest. j) Quantification of h. Statistical analysis was performed by a one‐tailed unpaired t‐test. k) Quantification of i. Statistical analysis was performed by a one‐tailed unpaired t‐test. EMT: Epithelial‐to‐mesenchymal transition, ERK: extracellular signal‐regulated kinase, GSEA: Gene set enrichment analysis, P‐: Phosphorylation, RPPA: Reverse phase protein array, *p < 0.05, **p < 0.01, ****p < 0.0001.
Figure 3
Figure 3
The drug screen identifies PF‐3758309 as AMPKi. a) Experimental setup of drug screen in empty vector control and Prkaa1 overexpressing PDAC cell lines. 9091 and 8182 empty and Prkaa1 cell lines were treated with a 7‐fold dilution of a drug library containing 112 compounds under clinical testing. After 72 h, cell viability was measured and dose‐response curves were generated by applying the GRmetrics package. Screening hits were defined as fold change (inhibitory concentration 50) (FC(IC50)) of Prkaa1 versus empty >2. b) Heatmap of log10(FC(IC50)) in 9091 and 8182 cells. c) Venn diagram of screening hits in 9091 and 8182 cells. d) Cell viability measurement of empty and Prkaa1 cells treated with PF‐3758309 in a seven‐fold dilution series for 72 h. The Y‐axis shows cell viability in percent [%] normalized to DMSO control. X‐axis shows concentration of PF‐3758309 as log2(PF‐3758309 [µm]). IC50 values are shown in brackets. Experiments were performed as three technical replicates with four biological replicates. e) Target deconvolution strategy using the kinobeads assay. The kinome of empty and Prkaa1 overexpressing cells was pulled down using kinobeads either in the presence of different concentrations of PF‐3758309 or without. Kinases were detected via LC‐MS/MS. Targets were ranked according to the apparent dissociation constant KD app and effective concentration 50 (EC50). f, Radar plot of identified targets of PF‐3758309 and their negative log10(KD app ) (pKD app ). Spike length indicates pKD app of the respective kinase. AMPK subunits are indicated in red. The intended target Pak4 is indicated in blue. g) Interaction of AMPKα (PDB ID 6C9F) with cocrystallized PF‐03758309. Right: 2D plot of kinase‐ligand interaction. Left: 3D representation of the binding of the inhibitor (colored green) to the ATP pocket. Hydrogen bonds are shown as yellow‐colored dashed lines. Salt bridges are shown as magenta‐colored dashed lines. Water molecules are displayed as red spheres. h) Western blot and i) quantification of AMPK signaling upon PF‐3758309 treatment. Cells were treated with 10 or 20 nM of PF‐3758309 or left as vehicle‐treated controls. Protein was harvested after 1, 6, and 24 h. AMPK inhibition was investigated by P‐ACC and ACC antibodies. P‐ACC was normalized to ACC. Hsp90 served as loading control. Experiments were performed as three biological replicates. ACC: Acetyl‐CoA carboxylase, Hsp90: Heat shock protein 90, P‐: Phosphorylation, ns: not significant, *p < 0.05, **p < 0.01, ***p < 0.005.
Figure 4
Figure 4
PF‐3758309 is effective across PDAC models. a) Half‐maximal Inhibitory concentration (IC50) of PF‐3758309 after 3 days of treatment in murine cell lines (N = 37) using CellTiter‐Glo. b) IC50 of PF‐3758309 in patient‐derived organoids (PDO) (N = 6), patient‐derived cell lines (PD‐CL) (N = 9) using CellTiter‐Glo. c) IC50 of PF‐3758309 in established human PDAC (N = 19) cell lines derived from CTD2 screen accessed via Depmap. d) Microscopic pictures of PDOs treated with different concentrations of PF‐3758309 after 7 days. The scale bar is shown in the bottom right. Two biological replicates are depicted. e) Pearson correlation coefficient of GSVA of KEGG gene sets and IC50 of PF‐3758309 in murine cell lines. f) IC50 of PF‐3758309 of murine and patient‐derived cell lines (PD‐CL) (N = 9) in glycolytic and lipogenic PDAC subtypes. Differential genes for clustering were selected based on adjusted p‐value < 0.05 and log2(fold change) >1.
Figure 5
Figure 5
Drug Screen to uncover Prkaa1‐dependent processes and associated vulnerabilities. a) Scheme of a drug screen and validation workflow. 8570 LacZ control cells (dark blue) and corresponding Prkaa1 KO1, and Prkaa1 KO2 cells (light blue) were screened with a drug library containing 118 compounds. Hits were defined based on FC(IC50) < 0.7 in both KOs. Potential hits were first validated in LacZ control cells and Prkaa1 KOs of 8570 and subsequently in LacZ control cells (dark green) and Prkaa1 KOs (light green) of 9091 cells. b) Dot plot of log10 (mean fold change inhibitory concentration 50 (FC(IC50))) in 8570 LacZ control cells versus Prkaa1 KOs. Drugs are ordered according to their mean FC(IC50). Highlighted are drugs with FC(IC50) < 0.7 in both KOs and the top hit Erastin as well as its analog Imidazole Ketone Erastin. c) Screening hits of b were validated in LacZ control versus Prkaa1 KO1 and Prkaa1 KO2 of 8570 and 9091 cells after 72 h of treatment by CellTiter‐Glo® assay (N = 3). Cell viability was normalized to DMSO control. X‐axis shows concentration of PF‐3758309 as log2(PF‐3758309[µM]). Experiments were performed as three technical replicates with three biological replicates. Log10(FC(IC50))) was calculated and color‐coded. X indicates false positive hits. d) Fold change activity of Erastin in Prkaa1 KOs compared to LacZ control cells. Relative clonogenic growth of LacZ control cells treated with Erastin was divided by relative clonogenic growth of Prkaa1 KO cells treated with Erastin. Resulting value is depicted as fold change activity. Experiments were performed at least as four biological replicates. e) Clonogenic assay of 8248 LacZ control cells and corresponding Prkaa1 KO1, and Prkaa1 KO2 treated with indicated concentrations of Erastin for 8 days. Experiments were performed as five biological replicates. f) Quantification of e. g) Clonogenic assay of 9091 LacZ control cells treated with indicated concentrations of Erastin and PF‐3758309 for 8 days. h) Synergy scores of combination treatment of Erastin and PF‐3758309 in 8570, 8248, and 9091 LacZ control cells. Zero interaction potency (ZIP) and Bliss scores for each cell line are shown. Experiments were performed as at least four biological replicates. i) Microscopic images of PDOs treated with indicated concentrations of PF‐3758309 and Erastin for 7 days. j) Cell viability of PDOs treated with indicated concentrations of PF‐3758309 and Erastin for 6 days. k) GSEA of RNA‐Seq data of empty versus Prkaa1 overexpressing cells using the KEGG gene set database. Depicted are the top 5 enriched and depleted KEGG gene sets. Normalized enrichment scores are shown on the x‐axis and p‐values (pval) are color‐coded.

References

    1. Vara‐Ciruelos D., Dandapani M., Hardie D. G., Annu. Rev. Cancer Biol. 2019, 4, 1.
    1. Steinberg G. R., Hardie D. G., Nat. Rev. Mol. Cell Bio. 2023, 24, 255. - PubMed
    1. Zhang C.‐S., Hawley S. A., Zong Y., Li M., Wang Z., Gray A., Ma T., Cui J., Feng J.‐W., Zhu M., Wu Y.‐Q., Li T. Y., Ye Z., Lin S.‐Y., Yin H., Piao H.‐L., Hardie D. G., Lin S.‐C., Nature 2017, 548, 112. - PMC - PubMed
    1. Li S., Z. Lavagnino , D. Lemacon , L. Kong , A. Ustione , Ng X., Zhang Y., Wang Y., Zheng B., Piwnica‐Worms H., Vindigni A., Piston D. W., You Z., Mol. Cell 2019, 74, 1123. - PMC - PubMed
    1. Vara‐Ciruelos D., Dandapani M., Gray A., Egbani E. O., Evans A. M., Hardie D. G., Mol. Cancer Res. 2018, 16, 345. - PubMed

MeSH terms

Substances

LinkOut - more resources