. 2024 Aug;632(8026):823-831.
doi: 10.1038/s41586-024-07682-9. Epub 2024 Jun 17.

Harnessing landrace diversity empowers wheat breeding

Shifeng Cheng #  1 Cong Feng #  2 Luzie U Wingen #  3 Hong Cheng  2 Andrew B Riche  4 Mei Jiang  2 Michelle Leverington-Waite  3 Zejian Huang  2 Sarah Collier  3 Simon Orford  3 Xiaoming Wang  3   5 Rajani Awal  3 Gary Barker  6 Tom O'Hara  3 Clare Lister  3 Ajay Siluveru  3 Jesús Quiroz-Chávez  3 Ricardo H Ramírez-González  3 Ruth Bryant  7 Simon Berry  8 Urmil Bansal  9 Harbans S Bariana  9   10 Malcolm J Bennett  11 Breno Bicego  12 Lorelei Bilham  3 James K M Brown  3 Amanda Burridge  6 Chris Burt  7 Milika Buurman  13 March Castle  4 Laetitia Chartrain  3 Baizhi Chen  2 Worku Denbel  14 Ahmed F Elkot  15 Paul Fenwick  16 David Feuerhelm  17 John Foulkes  11 Oorbessy Gaju  11 Adam Gauley  18   19 Kumar Gaurav  3 Amber N Hafeez  3 Ruirui Han  2   20 Richard Horler  3 Junliang Hou  2 Muhammad S Iqbal  2 Matthew Kerton  21 Ankica Kondic-Spica  22 Ania Kowalski  3 Jacob Lage  23 Xiaolong Li  24 Hongbing Liu  2 Shiyan Liu  2 Alison Lovegrove  4 Lingling Ma  2 Cathy Mumford  3 Saroj Parmar  4 Charlie Philp  3 Darryl Playford  3 Alexandra M Przewieslik-Allen  6 Zareen Sarfraz  2 David Schafer  7 Peter R Shewry  4 Yan Shi  2 Gustavo A Slafer  12   25 Baoxing Song  26 Bo Song  2 David Steele  4 Burkhard Steuernagel  3 Phillip Tailby  8 Simon Tyrrell  27 Abdul Waheed  2 Mercy N Wamalwa  28 Xingwei Wang  2 Yanping Wei  2 Mark Winfield  6 Shishi Wu  2 Yubing Wu  2   29 Brande B H Wulff  3   30 Wenfei Xian  2   31 Yawen Xu  2   29 Yunfeng Xu  2 Quan Yuan  2 Xin Zhang  2   29 Keith J Edwards  6 Laura Dixon  18 Paul Nicholson  3 Noam Chayut  3 Malcolm J Hawkesford  4 Cristobal Uauy  3 Dale Sanders  3 Sanwen Huang  2   32 Simon Griffiths  33
Affiliations

Harnessing landrace diversity empowers wheat breeding

Shifeng Cheng et al. Nature. 2024 Aug.

Abstract

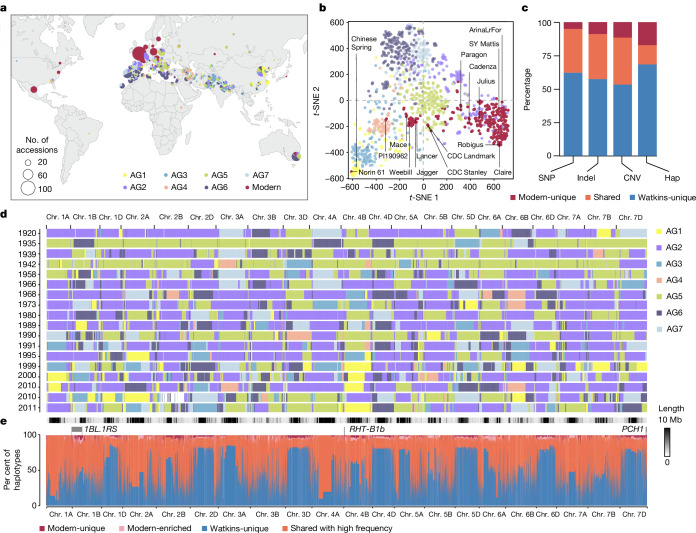
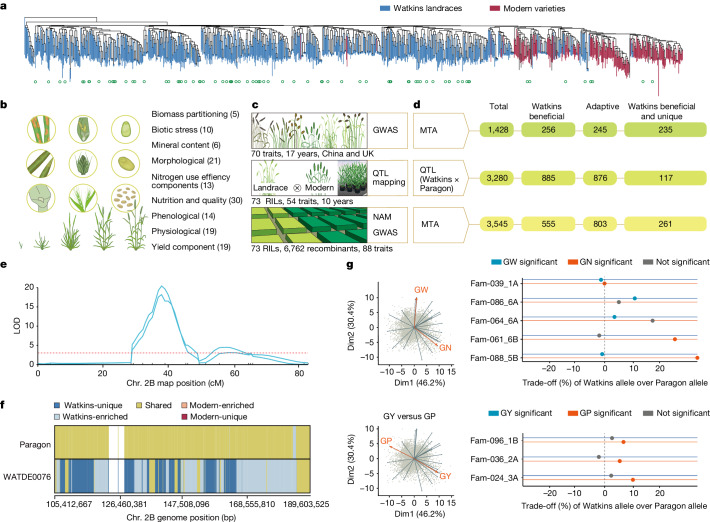
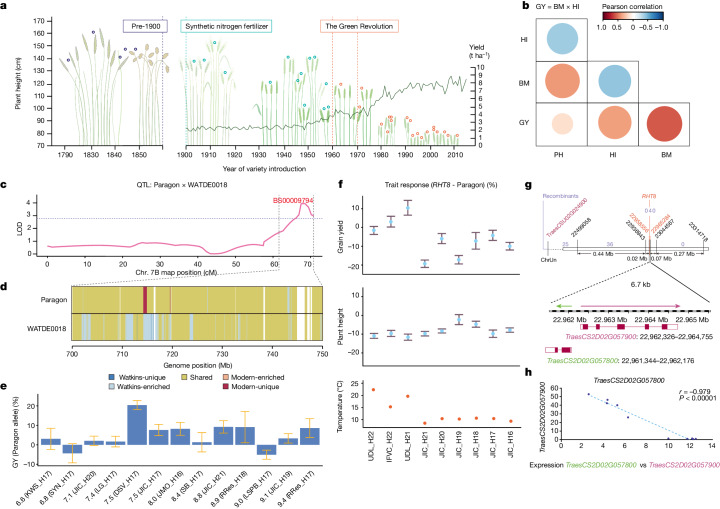
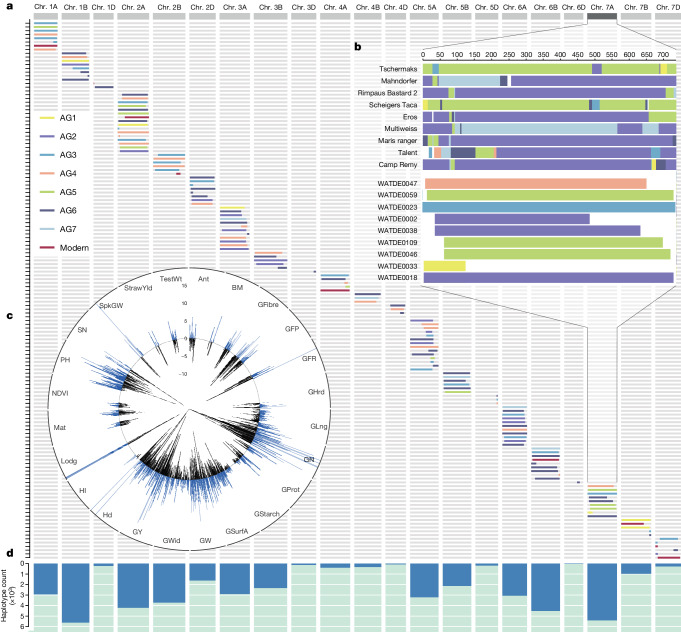
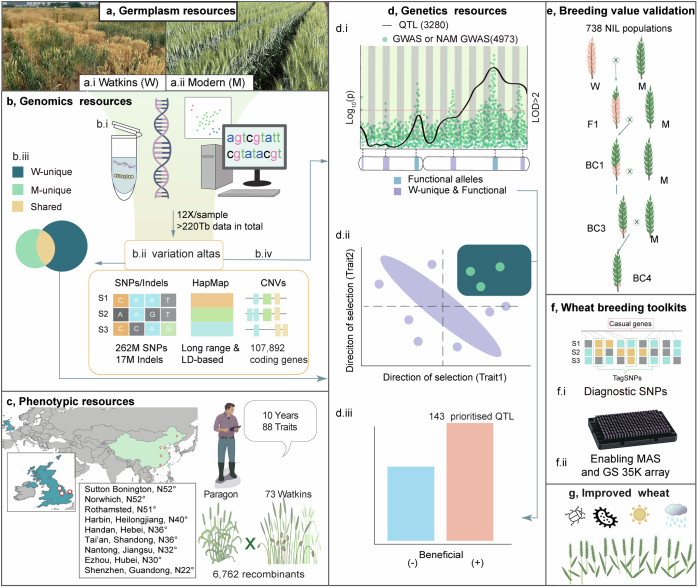
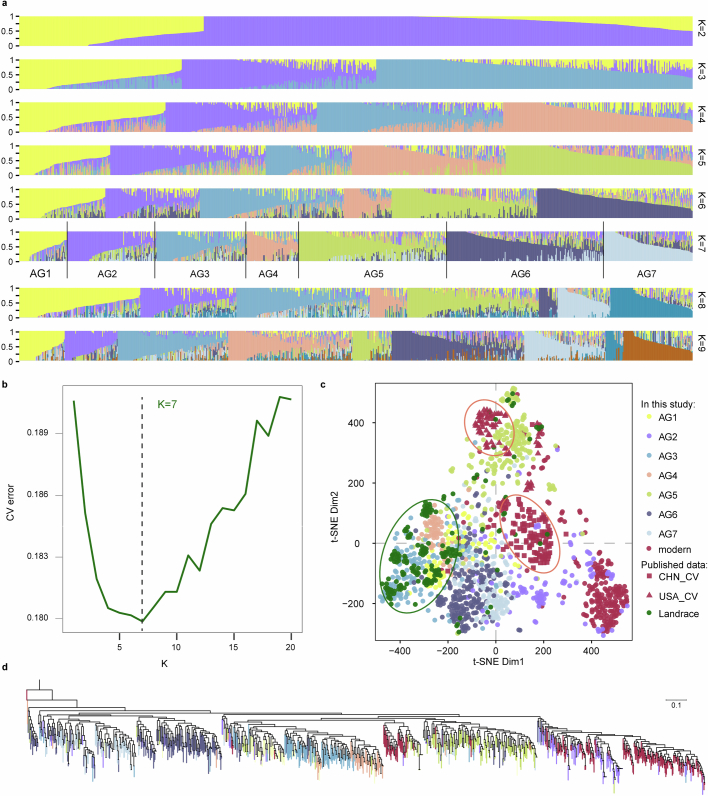
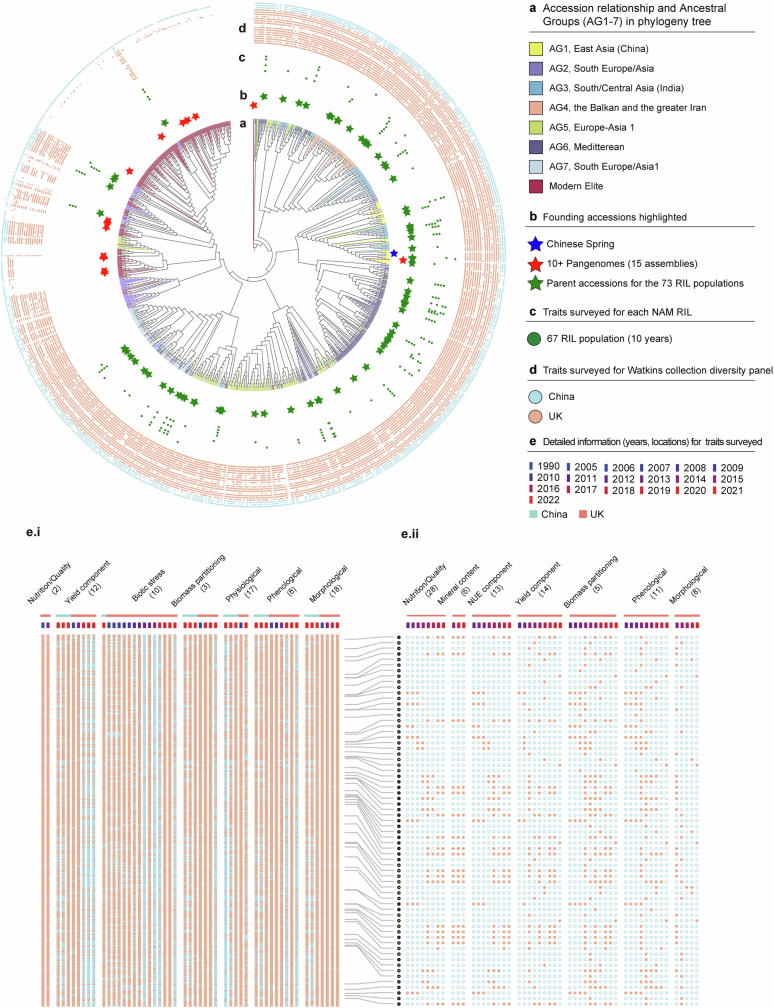
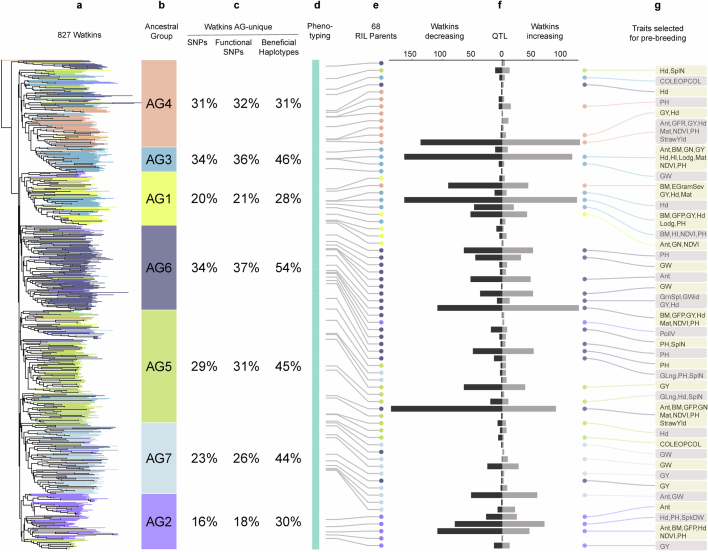
Harnessing genetic diversity in major staple crops through the development of new breeding capabilities is essential to ensure food security1. Here we examined the genetic and phenotypic diversity of the A. E. Watkins landrace collection2 of bread wheat (Triticum aestivum), a major global cereal, by whole-genome re-sequencing of 827 Watkins landraces and 208 modern cultivars and in-depth field evaluation spanning a decade. We found that modern cultivars are derived from two of the seven ancestral groups of wheat and maintain very long-range haplotype integrity. The remaining five groups represent untapped genetic sources, providing access to landrace-specific alleles and haplotypes for breeding. Linkage disequilibrium-based haplotypes and association genetics analyses link Watkins genomes to the thousands of identified high-resolution quantitative trait loci and significant marker-trait associations. Using these structured germplasm, genotyping and informatics resources, we revealed many Watkins-unique beneficial haplotypes that can confer superior traits in modern wheat. Furthermore, we assessed the phenotypic effects of 44,338 Watkins-unique haplotypes, introgressed from 143 prioritized quantitative trait loci in the context of modern cultivars, bridging the gap between landrace diversity and current breeding. This study establishes a framework for systematically utilizing genetic diversity in crop improvement to achieve sustainable food security.


Conflict of interest statement

The following authors are employed in private wheat breeding companies: Limagrain UK (S.B., P.F. and P.T.), KWS (J.L.), DSV (M.K.), RAGT (D. Schafer and C.B.), Syngenta (D.F.) and Elsoms (M.B.). The other authors declare no competing interests.

Figures

Fig. 1
Fig. 1. Genomic variants in Watkins landraces compared with modern wheat.
a, Geographical distribution of all accessions, including the entire Watkins collection (n = 827) and modern wheat cultivars that are the outputs of breeding programmes (n = 224; comprising 208 cultivars sequenced in this study and 15 previously described wheat cultivars from the 10+ Wheat Genomes Project as well as Chinese Spring). The seven ancestral groups (AG1–AG7, derived from Watkins) and modern wheat are colour-coded. b, t-SNE plot based on the 10 million SNPs shared by different ancestral groups. The SNPs were stringently controlled by LD (see Methods), with AG1–7 and modern wheat colour-coded as in a. The distribution of the 15 lines from the 10+ Wheat Genomes Project and Chinese Spring are shown. c, Percentage of Watkins-unique, shared and modern-unique variants for SNPs, short (<50 bp) insertion–deletion mutations (indels), gene copy number variations (CNV) and haplotypes (hap). d, k-mer based IBSpy long-range haplotype analysis of the selected 18 representative modern wheat cultivars (released from 1920 to 2011). IBS regions shared between these 18 modern wheat lines and the Watkins landraces are shown as coloured blocks according to the source of the detected Watkins accessions from the different ancestral subgroups (top 100 Watkins accessions; Supplementary Table 7; see Methods and ref. ). e, Genomic distribution and comparison of haplotypes between Watkins and modern wheat along the 21 chromosomes, including the proportion of haplotypes that are absent (Watkins-unique), shared with high frequency, modern-enriched or unique to modern wheat. The haplotypes were identified based on LD by PLINK (Methods), with single-base-resolution based on the IWGSC RefSeq v1.0 reference genome. Source Data
Fig. 2
Fig. 2. Genetic dissection of useful traits from Watkins.
a, SNP phylogeny of Watkins and modern lines. The tree was built on the core SNP set (Watkins parents of 73 RIL populations are marked with green circles). b, Schematic of trait data collected and categorized into nine classes. Total number of sub-traits for each trait is shown in parentheses. c, Field experiments and trait data collected from the Watkins natural population for GWAS analysis (top), QTL analysis from individual segregating mapping populations (RIL; middle) and combined analysis of NAM–GWAS with RILs from imputation of the NAM populations (bottom). d, Genetic association signals from different methods. Total number of MTAs detected from GWAS (top), NAM (bottom). Middle, summary of total number of QTLs identified using RILs. Watkins beneficial, number of allelic effects in which the Watkins allele exceeded Paragon allele for traits under directional selection; adaptive, effects that can be beneficial in either direction; Watkins beneficial, adaptive and unique, haplotype under the peak marker or genomic interval was absent or infrequent in modern. e, Examples of genetic effect detection as QTL (yellow rust resistance) using data collected from experiments in c. LOD, logarithm of the odds. f, Haplotype frequency within QTL peak interval blocks in e for Paragon and WATDE0076 (Supplementary Table 17), as Watkins-unique, Watkins-enriched, shared, modern-enriched, modern-unique and other (white, no haploblock). g, Left, principal component analysis (PCA) of Watkins NIL data, highlighting trait trade-off relationships (grain weight (GW) versus grain number (GN) and grain yield (GY) versus grain protein (GP)). Right, percentage phenotypic differences for the Watkins versus Paragon allele. Each QTL is represented by a NIL pair or family (Fam) (Supplementary Table 31). Significant effects (P < 0.05, F-statistics) for traits are shown by coloured or grey circles. Source Data
Fig. 3
Fig. 3. Recovery of useful diversity left behind by the green revolution.
a, Historical reduction in plant height of wheat. Heritage cultivar heights (empty circles) from 1790 to 2010 and yields (lines) from 1900 to present. Agricultural milestones are highlighted. b, Trait relationships between grain yield, harvest index (HI), plant height (PH) and biomass (BM) of the RILs indicated as a coloured circle, with the colour indicating Pearson correlation. The strength of the significance is represented by circle size. c, Plant height QTL (chromosome arm 7BL). The genetic confidence interval ranges from 62.2 to 70.3 cM, corresponding to 701 to 744 Mb, depicted by lines connecting c and d. d, Haplotype blocks within confidence interval from c for Paragon and WATDE0018 (Supplementary Table 17). Blocks are coloured by frequency, as Watkins-unique, Watkins-enriched, shared, modern-enriched, modern-unique and other (white, no haploblock). e, WATDE0018 segment on grain yield effect. Label prefixes are grain yield in t ha−1. Number after H indicates year harvested; harvest locations include: KWS, KWS Fowlmere; SYN, Syngenta; JIC, John Innes Centre Church Farm; LG, Limagrain; DSV, DSV, JMO, John Innes-Morley; SB, Sutton Bonington; RRes, Rothamsted; LSPB, LS Plant Breeding (details in Methods). Data are mean ± s.e.m. n = 3 independent field plots per NIL, except n = 4 for LSPB_H17 and n = 5 for JIC_H21. f, Mean percentage plant height (middle) and grain yield (top) effects of RHT8 (Mara) versus Paragon in the UK, Spain and Serbia. H, year harvested; JIC, John Innes Centre (UK); UDL: University of Lleida (Spain); IFVC, Institute of Field and Vegetables Crops (Serbia). Bottom, growing season temperature. Data are mean ± s.e.m. Number of independent field plots per per NIL: n = 5 (H21 and H22), n = 4 (H16–H19) and n = 3 (H20). g, Genetic map of the RHT8 locus delimitating to a 6.7-kb interval. Marker position is shown in black and flanking markers are in red. Independent recombination lines between RHT8 phenotype are in purple. h, RNA-seq expression data for TraesCS2D02G057800 and TraesCS2D02G057900 during tiller development reveal a negative regulatory relationship (Pearson correlation r = 0.979; P < 0.0001). Source Data
Fig. 4
Fig. 4. Validation of the breeding value and delivery of target segments.
a, Introgressed target segments of Watkins in 143 Paragon NILs based on QTL prioritization. Colours of segments represent the corresponding ancestral groups (AG1–AG7) of the donor parents. b, Inset highlighting one example for chromosome 7A, showing the composition of old breeding cultivars (top, mainly composed of AG2/5) and of NILs (bottom, also containing AG1, AG3 and AG4 representation). Details on each segment are provided in Supplementary Table 31. c, Phenotypic effects (AMMI means) of the genetic substitution derived from multi-environment screening for the 127 introgressed loci on 24 traits (marked on the perimeter; for trait abbreviations see Supplementary Table 13). Percentage increase or decrease in Watkins allele effects compared with Paragon are shown according to the vertical scale at 12 o’clock. d, Count distribution along each chromosome of the number of Watkins-unique haplotypes (represented by blue bars) that were introgressed into the modern wheat (Paragon) by backcrossing. Source Data
Extended Data Fig. 1
Extended Data Fig. 1. Graphical abstract and conceptual strategies.
a, The WWWG2B strategy started with the comparison of variations between the Watkins landrace collection (W, a.i) and the modern wheats (M, a.ii). b, By developing an extensive genomics resource, we determined the extent to which landraces carry variants that are not present in modern wheats. c-d, Natural and structured populations were then combined in multi-site field-based experiments to identify novel and useful genetic variations not yet deployed in modern wheat. This required genetic dissection by a combination of whole-genome resequencing (b.i), construction of variant atlas and haplotype map (b.ii) and extensive field-based phenotyping (c) of next-generation-gene-discovery populations, the NAM RIL segregating populations combined with GWAS (d.i), bi-parental QTL mapping, and haplotype analysis enabled by the development of the advanced genomics and genetics resources shown in b and d. e, Alleles with high breeding values and their phenotypic effects (determined by calculating the AMMI means for their selection) were validated and delivered for use in breeding. f, Diagnostic SNPs and KASP markers were designed for assisted molecular breeding. g, The overall objective of the Watkins Worldwide Wheat Genomics to Breeding (WWWG2B, http://wwwg2b.com/) consortium is to enable the development of a new generation of modern elite wheat cultivars that are climate resilient. The flow of useful genes and alleles through this process was gated by three prioritisation criteria: 1) the alleles or haplotypes are novel or unique to Watkins landraces or are at very low frequency in modern wheat (b.iii); 2) the Watkins-unique alleles or haplotypes are associated with significant genetic effects (target QTL and MTA) (d.i); 3) haplotype analysis showed that the Watkins-unique trait associated alleles or haplotypes are beneficial with increasing effects based on our understanding of physiological trait relationships (d.ii and d.iii). These prioritisation selection criteria are used to choose alleles to build new modern wheat cultivars while avoiding negative trade-offs.
Extended Data Fig. 2
Extended Data Fig. 2. Population structure and phylogenetic analysis of Watkins landraces and modern wheat cultivars.
a, Genome-wide ADMIXTURE (Maximum Likelihood Estimation) results for 827 Watkins landraces from K = 2 to K = 9. Each colour represents an ancestral population. The length of each segment in each vertical bar represents the proportion contributed by ancestral populations. b, Estimated CV error for different K values (from K = 2 to K = 20) in the ADMIXTURE analysis with a K of 7 designating the ancestral groups (AGs) identified here. c, dim1 and dim2 plots of t-SNE results using PLINK haplotypes, for the merged variation matrix (4 M shared SNPs) between the SNP matrix built in this study (the 10 M core SNPs, see Methods) and the published dataset (76 M SNPs) from Niu et al.. d, Phylogenetic reconstruction of a set of 133,222 4DTv sites using Maximum Likelihood Estimation with 1000 bootstrap replicates, corresponding to Fig. 2a with the ancestral groups (AG1-7) color-coded. It is worth noting that a subjective observation of the phylogenetic analysis of Watkins based on the maximum likelihood method (Extended Data Fig. 2d), largely places individual accessions of each ancestral group beneath common branchpoints of the phylogenetic tree. Instances where this is not observed reveal extensive admixture (Extended Data Fig. 2a, Supplementary Table 4). The highest level of admixture for AG2 is from AG5 (approximately 11.2%), for AG5 it is from AG7 (approximately 7.5%). This reflects the reticulate relationship among these ancestral groups and further demonstrates the need for alternative methods, particularly sophisticated models reliant on haplotype-based clustering for accurate inference of ancient wheat populations. Source Data
Extended Data Fig. 3
Extended Data Fig. 3. Choice of modern wheat cultivars and comparison with the Watkins collection.
a, Principal component analysis based on 35k Wheat Breeders’ Array genotypic data for 1169 modern cultivars and Watkins landraces hosted by CerealsDB (https://www.cerealsdb.uk.net/cerealgenomics/CerealsDB/indexNEW.php) when selections for sequencing in this project were made. Selected cultivars are shown in gold, Watkins in green and cultivars not selected for sequencing in grey. Representative cultivars from the blue circled group in PC1 vs. PC2 were not selected because synthetic wheat derivatives are highly represented in this group. b, Countries of origin of the 1169 modern cultivars genotyped.
Extended Data Fig. 4
Extended Data Fig. 4. Watkins collection and mapping populations, phenotypic resources and traits surveyed summarised in a phylogeny-based circular diagram.
a, Phylogenetic tree of the wheat accessions examined in this study. The phylogenetic tree was constructed using a set of 133,222 four-fold degenerate sites using rapidNJ with 1000 bootstrap replicates. The seven ancestral groups (AG1–7) and modern wheats are colour-coded as in Fig. 1a. b, The founder parents (green stars) of 73 Watkins x Paragon RIL populations are marked, the 15 pan-genome lines (red stars) and Chinese Spring (blue star) are indicated on the phylogenetic tree. c, Traits surveyed in multiple environments and multiple years for each of the NAM RIL populations, in which the corresponding Watkins line was used as the non-common parent. Each track represents a year (total of 10 years: 2011, 2012, 2013, 2014, 2015, 2016, 2017, 2018, 2019 and 2020). d, Traits surveyed in multiple environments and multiple years for the Watkins collection diversity panel (natural populations) grown in five geographic locations across China (blue circle, four years: 2020, 2021, 2022, 2023) and the UK (orange circle, 16 years: 1990, 2005, 2006, 2007, 2008, 2009, 2010, 2011, 2012, 2013, 2014, 2015, 2018, 2019, 2020 and 2021). e, Magnified view of data from the detailed field experiments, traits and phenotyping datasets as indicated in track d, including the traits surveyed in the Watkins collection diversity panel in multiple environments (e.i) and in multiple years (left) and in the RIL populations (NAM RILs) in multiple environments and in multiple years (e.ii). Source Data
Extended Data Fig. 5
Extended Data Fig. 5. Information flow from novel and functional genetic diversity derived from Watkins landraces to the quantification of the beneficial increasing QTL allele associated with target traits.
a, Phylogenetic tree of the 827 Watkins accessions, colour-coded by ancestral groups; the branches were roughly classified into the seven ancestral groups in panel b. c, Percentage of AG-unique genetic diversity for SNPs, functional SNPs (defined by SnpEff (v4.3t)) and beneficial haplotypes. d, Phenotyping of the Watkins collection including data collected in China and the UK and data for the 68 of 73 total RIL populations which exhibit significant QTLs in panel e. The Watkins parental lines in the RIL population, with colours representing their ancestral groups. f, distribution of the number statistic of QTLs detected from the biparental QTL mapping populations, comparison was made for the beneficial QTL with increasing effects (right) and decreasing (left) in Watkins. g, Prioritised QTL and the major traits selected for introgression into Paragon via backcrossing to test their phenotypic effects for pre-breeding. Source Data

References

    1. Moore, G. Strategic pre-breeding for wheat improvement. Nat Plants1, 15018 (2015). 10.1038/nplants.2015.18 - DOI - PubMed
    1. Wingen, L. U. et al. Establishing the A. E. Watkins landrace cultivar collection as a resource for systematic gene discovery in bread wheat. Theor. Appl. Genet.127, 1831–1842 (2014). 10.1007/s00122-014-2344-5 - DOI - PMC - PubMed
    1. Lobell, D. B., Schlenker, W. & Costa-Roberts, J. Climate trends and global crop production since 1980. Science333, 616–620 (2011). 10.1126/science.1204531 - DOI - PubMed
    1. Myers, S. S. et al. Increasing CO2 threatens human nutrition. Nature510, 139–142 (2014). 10.1038/nature13179 - DOI - PMC - PubMed
    1. Population Division. World Population Prospects 2019: Highlightshttps://population.un.org/wpp/ (United Nations Department of Economic and Social Affairs, 2019).