. 2024 Aug:86:101968.
doi: 10.1016/j.molmet.2024.101968. Epub 2024 Jun 15.

Adaptive gene expression of alternative splicing variants of PGC-1α regulates whole-body energy metabolism

Affiliations

Adaptive gene expression of alternative splicing variants of PGC-1α regulates whole-body energy metabolism

Kazuhiro Nomura et al. Mol Metab. 2024 Aug.

Abstract

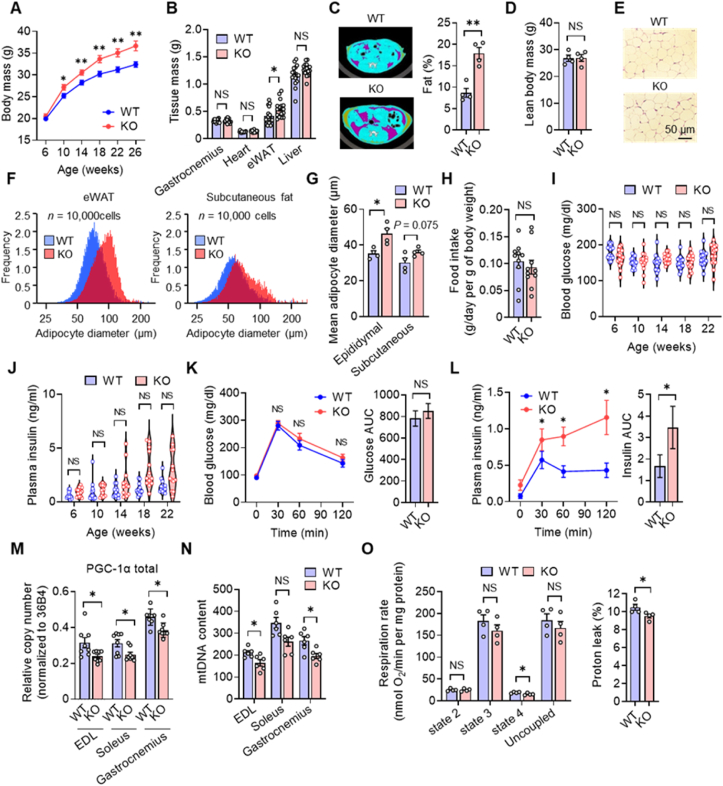
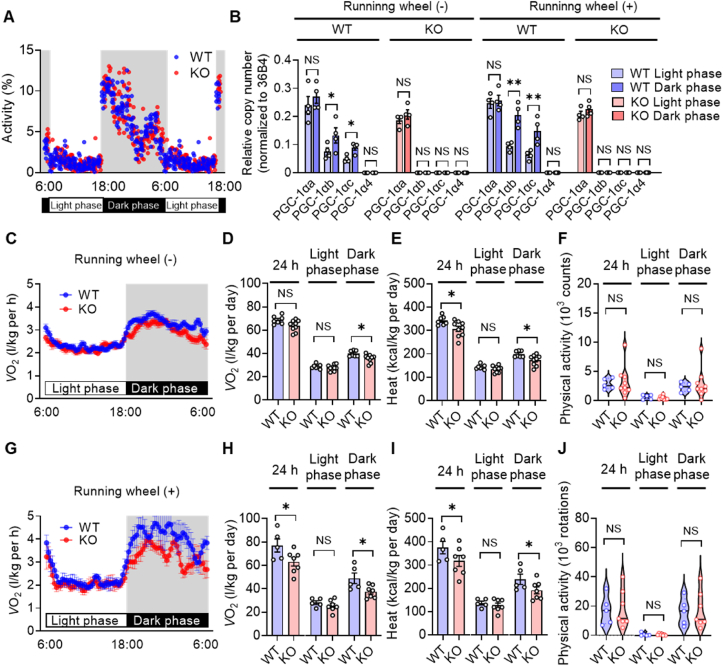
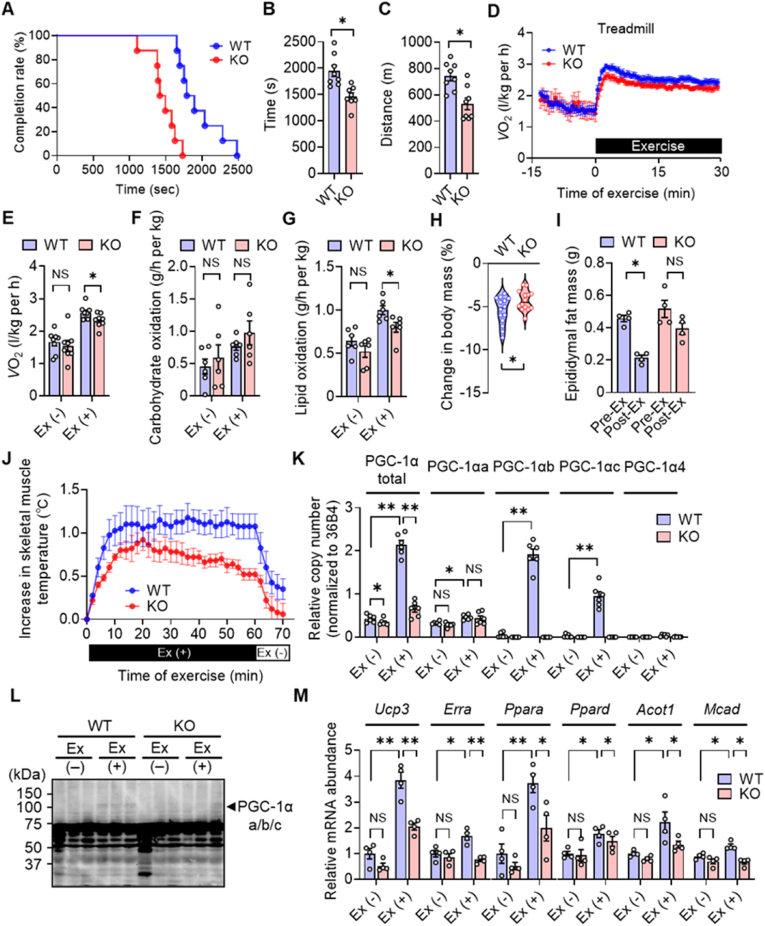
The transcriptional coactivator PGC-1α has been implicated in the regulation of multiple metabolic processes. However, the previously reported metabolic phenotypes of mice deficient in PGC-1α have been inconsistent. PGC-1α exists as multiple isoforms, including variants transcribed from an alternative first exon. We show here that alternative PGC-1α variants are the main entity that increases PGC-1α during exercise. These variants, unlike the canonical isoform of PGC-1α, are robustly upregulated in human skeletal muscle after exercise. Furthermore, the extent of this upregulation correlates with oxygen consumption. Mice lacking these variants manifest impaired energy expenditure during exercise, leading to the development of obesity and hyperinsulinemia. The alternative variants are also upregulated in brown adipose tissue in response to cold exposure, and mice lacking these variants are intolerant of a cold environment. Our findings thus indicate that an increase in PGC-1α expression, attributable mostly to upregulation of alternative variants, is pivotal for adaptive enhancement of energy expenditure and heat production and thereby essential for the regulation of whole-body energy metabolism.

Keywords: Diabetes; Energy expenditure; Exercise; Obesity; PGC-1α; Skeletal muscle.


Conflict of interest statement

Declaration of competing interest The authors declare that they have no known competing financial interests or personal relationships that could have appeared to influence the work reported in this paper.

Figures

Figure 1
Figure 1
Molecular structures and functions of mouse PGC-1α isoforms. (A) Gene and predicted protein structures of PGC-1α isoforms. (B) C2C12 myotubes infected with adenoviruses encoding individual PGC-1α isoforms or β-galactosidase (β-gal, control) were subjected to RT-qPCR analysis of carnitine palmitoyltransferase 1b (Cpt1b), PPARα (Ppara), mitochondrial ATP synthase subunit β (Atp5b), glucose transporter 4 (Glut4), mitochondrial transcription factor A (Tfam), and cytochrome c oxidase subunit II (Mt-Co2) mRNAs (n = 8 independent experiments). The amount of each mRNA was normalized by that of 36B4 mRNA, and normalized values are expressed relative to the corresponding value for myotubes expressing β-gal. (C) COS7 cells transfected with expression vectors encoding each PGC-1α isoform (or with the corresponding empty vector, Control) and with an expression vector for mouse PPARα were subjected to immunoprecipitation (IP) with antibodies to PGC-1α, and the resulting precipitates were subjected to immunoblot analysis with antibodies to PPARα (upper panel) or to PGC-1α (lower panel). (D) Luciferase reporter assay with the reporter plasmid 3x-PPRE-luc for the transcriptional coactivator activity of PGC-1α isoforms expressed together with PPARα in C2C12 cells (n = 4 independent experiments). (E, F) C2C12 myotubes infected with adenoviruses encoding PGC-1α isoforms or β-gal (control) were subjected to immunoblot analysis of PGC-1α and GAPDH as a loading control (E) as well as assayed both for respiration rate under basal conditions and in the presence of oligomycin or carbonyl cyanide p-trifluoromethoxyphenylhydrazone (FCCP) and for mitochondrial proton leak (F) (n = 8 independent experiments). (G) Effects of clenbuterol on the promoter activity of PGC-1αa or PGC-1αb/c genes in C2C12 myoblasts. All quantitative data are means ± s.e.m. ∗P < 0.05 versus the corresponding value for β-gal (B) or for the indicated comparisons (D, F) by one-way (B, F) or two-way (D, G) ANOVA with Bonferroni's post hoc test. NS, not significant.
Figure 2
Figure 2
Effects of exercise on the abundance of PGC-1α isoform mRNAs in mice and humans. (A) RT-qPCR analysis of PGC-1α isoform mRNAs in skeletal muscle of male C57BL/6J mice both under the static condition (Ex (−)) and after exercise on a treadmill at 15 m/min for 120 min (Ex (+)) (n = 8 mice per group). EDL, extensor digitorum longus. (B) RT-qPCR analysis of PGC-1α isoform mRNAs in vastus lateralis skeletal muscle of human individuals with NGT (n = 10) or T2D (n = 10) both under the static condition (Ex (−)) and after ergometer exercise for 30 min (Ex (+)). PGC-1α isoform mRNAs were subjected to quantification with the use of standard curves determined with plasmids containing the corresponding cDNAs so as to allow comparison of their amounts, and copy number was determined by RT-qPCR. The relative copy number of the transcripts was normalized to that of 36B4. Data in (A) and (B) are means ± s.e.m. ∗P < 0.05, ∗∗P < 0.01, and NS by one-way ANOVA with Bonferroni's post hoc test. (C) Correlation of log2[fold change] for the exercise-induced increase in the abundance of PGC-1α isoform mRNAs in human skeletal muscle and VO2 max (NGT, n = 10; T2D, n = 10). Spearman correlation R2 values and P values are indicated.
Figure 3
Figure 3
Obesity and insulin resistance in PGC-1αAE1KO mice. (A–D) Body mass at the indicated ages (n = 16) (A), tissue mass at 4 months of age (n = 16) (B), as well as abdominal images and adipose tissue mass (n = 4) (C) and lean body mass (n = 4) (D) obtained by CT at 4 months of age for WT and KO mice. (E–G) Hematoxylin–eosin staining of eWAT (E) as well as adipocyte diameter in epididymal or subcutaneous fat as determined either with a Coulter counter (F) or by histological analysis (G) for WT and KO mice at 3 months of age (n = 4). (H) Food intake for 4-month-old WT and KO mice (n = 10). (I, J) Violin plots for blood glucose (I) and plasma insulin (J) concentrations in the randomly fed state and at the indicated ages (n = 16). Plot center lines denote the median. (K, L) Blood glucose (K) and plasma insulin (L) levels during an intraperitoneal GTT (left panels) as well as the corresponding area under the curve (AUC) values (right panels) for WT and KO mice at 7 months of age (n = 11). (M, N) RT-qPCR analysis of total PGC-1α mRNA (n = 8) (M) and qPCR analysis of mtDNA content (n = 6) (N) for the indicated skeletal muscles of WT and KO mice at 4 months of age. (O) Function of mitochondria isolated from gastrocnemius muscle of WT and KO mice at 4 months of age (n = 4). Quantitative data are means ± s.e.m. for the indicated numbers (n) of mice in (A–D, G, H–O). ∗P < 0.05, ∗∗P < 0.01, and NS versus the corresponding WT value or for the indicated comparisons by the two-tailed unpaired Student's t test (B–D, H–J; K,L (right panels)) or by one-way (A; K, L (left panels); M-O) or two-way (G) ANOVA with Bonferroni's post hoc test.
Figure 4
Figure 4
Oxygen consumption, heat production, and locomotor activity during the light and dark phases for PGC-1αAE1KO mice. (A) The circadian pattern of locomotor activity for WT and KO mice at 3 months of age was analyzed with an infrared sensor for 10 days (n = 10). Locomotor activity is expressed as a percentage of the daily total: 100% × (activity counts for each hour/total activity counts for 24 h). Each point corresponds to an individual mouse. (B) RT-qPCR analysis of PGC-1α isoform mRNAs in skeletal muscle of WT and KO mice during the light and dark phases in the absence or presence of a running wheel (n = 4). (C–E, G–I) Circadian pattern of oxygen consumption (VO2) (C, G) as well as the levels of oxygen consumption (D, H) and heat production (E, I) during the light and dark phases in the absence (WT, n = 7; KO, n = 9) (C–E) or presence (WT, n = 5; KO, n = 7) (G–I) of a running wheel for 4-month-old WT and KO mice. (F, J) Locomotor activity for 4-month-old WT and KO mice during the light and dark phases was analyzed for 4 days in the absence (WT, n = 7; KO, n = 9) (F) or presence (WT, n = 5; KO, n = 7) (J) of a running wheel. The center lines of the violin plots indicate the median. Data are means ± s.e.m. in (B–E, G–I), and n values indicate the numbers of mice. ∗P < 0.05, ∗∗P < 0.01, and NS by the two-tailed unpaired Student's t test (D–F, H–J) or two-way ANOVA with Bonferroni's post hoc test (B).
Figure 5
Figure 5
Impaired motor performance as well as attenuated exercise-induced energy expenditure and gene expression in PGC-1αAE1KO mice. (A–C) Motor performance of 3-month-old WT and KO mice (n = 8) was assessed by an exercise endurance test with stepwise increases in treadmill rate (A). Exhaustion was defined as the inability of the animal to remain on the treadmill despite mechanical prodding. The average time (B) and distance (C) of running until exhaustion were determined. (D–G) Time course of oxygen consumption (n = 8) (D), total oxygen consumption (n = 8) (E), carbohydrate oxidation rate (n = 6) (F), and lipid oxidation rate (n = 6) (G) during the first 30 min of forced treadmill exercise (Ex) at 25 m/min for 4-month-old WT and KO mice. (H, I) Percentage change in body mass (n = 14) after (H), and epididymal fat mass (n = 4) before and after (I), forced treadmill exercise for 120 min at 15 m/min for 4-month-old WT and KO mice. (J) Intramuscular temperature of 4-month-old WT and KO mice during forced treadmill exercise at 15 m/min (n = 5). (K, L) RT-qPCR analysis of PGC-1α isoform mRNAs in gastrocnemius muscle (n = 6) (K) and immunoblot analysis of PGC-1α in EDL (n = 3) (L) for 4-month-old WT and KO mice under the static condition (Ex (−)) or after forced treadmill exercise at 15 m/min for 120 min (Ex (+)). (M) RT-qPCR analysis of mRNAs for the indicated genes in gastrocnemius muscle of 4-month-old WT and KO mice under the static condition or after forced treadmill exercise at 15 m/min for 120 min (n = 4). The amount of each mRNA was normalized by that of 36B4 mRNA, and normalized values are expressed relative to the corresponding value for WT Ex (−). All quantitative data are means ± s.e.m. for the indicated numbers (n) or mice with the exception of those in (A) and (H), with the median being indicated in (H). ∗P < 0.05, ∗∗P < 0.01, and NS by the two-tailed unpaired Student's t test (B, C, H) or two-way ANOVA with Bonferroni's post hoc test (E–G, I, K, M).
Figure 6
Figure 6
Characterization of BAT and change in body temperature in response to cold exposure in PGC-1αAE1KO mice. (A, B) Hematoxylin–eosin staining (A) and tissue mass (n = 16) (B) for interscapular BAT of WT and KO mice at 8 weeks of age. (C, D) RT-qPCR analysis of PGC-1α isoform mRNAs (n = 4) (C) and of UCP1 mRNA (n = 4) (D) in BAT of 6-week-old WT and KO mice maintained either at 22 °C or for the indicated times (C) or 3 h (D) at 4 °C. The amount of UCP1 mRNA was normalized by that of 36B4 mRNA, and normalized values are expressed relative to the value for WT at 22 °C. (E) Rectal temperature of 6-week-old WT and KO mice during exposure to 4 °C for the indicated times (n = 6). (F, G) RT-qPCR analysis of PGC-1α isoform mRNAs (F) and of expression of the indicated genes (G) in eWAT of 4-month-old WT and KO mice maintained at 22 °C or for 3 h at 4 °C (n = 4). Gene expression in (G) was normalized by the amount of 36B4 mRNA, and normalized values are expressed relative to the value for WT at 22 °C. All quantitative data are means ± s.e.m. for the indicated numbers (n) or mice. ∗P < 0.05, ∗∗P < 0.01, and NS versus the corresponding value for KO mice (E) or for the indicated comparisons (B–D, F, G) by the two-tailed unpaired Student's t test (B) or two-way ANOVA with Bonferroni's post hoc test (C–G).
Figure 7
Figure 7
Effects of exercise training on skeletal muscle remodeling in PGC-1αAE1KO mice. (A, B) RT-qPCR analysis of MHC mRNAs (n = 6) (A) and qPCR analysis of mtDNA (n = 8) (B) in gastrocnemius of WT and KO mice maintained with or without exercise training for 6 weeks beginning at 3 months of age. The amount of each MHC mRNA was normalized by that of 36B4 mRNA, and normalized values are expressed relative to the corresponding value for training (−). (C, D) Vascular density in EDL as determined by immunohistochemical staining with antibodies to CD31 (C) and represented by the average number of CD31-positive capillaries per high-power field (HPF) among four such HPFs (D) for WT and KO mice (n = 4) maintained with or without exercise training for 6 weeks beginning at 3 months of age. Mice at 4 months of age subjected to forced treadmill exercise at 15 m/min for 120 min were also analyzed for comparison (Ex (+), n = 4). (E) RT-qPCR analysis of PGC-1α isoform mRNAs in gastrocnemius of WT and KO mice as in (A) (n = 6). All quantitative data are means ± s.e.m. for the indicated numbers (n) of mice. ∗P < 0.05, ∗∗P < 0.01, and NS by two-way ANOVA with Bonferroni's post hoc test. (F) Model for the roles of PGC-1α isoforms in skeletal muscle. Circle sizes indicate the relative abundance of PGC-1α isoforms.

Similar articles

Cited by

References

    1. Handschin C., Spiegelman B.M. Peroxisome proliferator-activated receptor γ coactivator 1 coactivators, energy homeostasis, and metabolism. Endocr Rev. 2006;27(7):728–735. doi: 10.1210/er.2006-0037. - DOI - PubMed
    1. Pagel-Langenickel I., Bao J., Pang L., Sack M.N. The role of mitochondria in the pathophysiology of skeletal muscle insulin resistance. Endocr Rev. 2010;31(1):25–51. doi: 10.1210/er.2009-0003. - DOI - PMC - PubMed
    1. Mootha V.K., Lindgren C.M., Eriksson K.-F., Subramanian A., Sihag S., Lehar J., et al. PGC-1α-responsive genes involved in oxidative phosphorylation are coordinately downregulated in human diabetes. Nat Genet. 2003;34(3):267–273. doi: 10.1038/ng1180. - DOI - PubMed
    1. Patti M.E., Butte A.J., Crunkhorn S., Cusi K., Berria R., Kashyap S., et al. Coordinated reduction of genes of oxidative metabolism in humans with insulin resistance and diabetes: potential role of PGC1 and NRF1. Proc Natl Acad Sci U S A. 2003;100(14):8466–8471. doi: 10.1073/pnas.1032913100. - DOI - PMC - PubMed
    1. Kristensen J.M., Skov V., Petersson S.J., Ørtenblad N., Wojtaszewski Jørgen.F.P., Beck-Nielsen H., et al. A PGC-1α- and muscle fibre type-related decrease in markers of mitochondrial oxidative metabolism in skeletal muscle of humans with inherited insulin resistance. Diabetologia. 2014;57(5):1006–1015. doi: 10.1007/s00125-014-3187-y. - DOI - PubMed

MeSH terms

Substances

LinkOut - more resources