. 2024 Jun 17;12(6):e008375.
doi: 10.1136/jitc-2023-008375.

EBV promotes TCR-T-cell therapy resistance by inducing CD163+M2 macrophage polarization and MMP9 secretion

Affiliations

EBV promotes TCR-T-cell therapy resistance by inducing CD163+M2 macrophage polarization and MMP9 secretion

Yuanyuan Chen et al. J Immunother Cancer. .

Abstract

Background: Epstein-Barr virus (EBV) is a double-stranded DNA oncogenic virus. Several types of solid tumors, such as nasopharyngeal carcinoma, EBV-associated gastric carcinoma, and lymphoepithelioma-like carcinoma of the lung, have been linked to EBV infection. Currently, several TCR-T-cell therapies for EBV-associated tumors are in clinical trials, but due to the suppressive immune microenvironment of solid tumors, the clinical application of TCR-T-cell therapy for EBV-associated solid tumors is limited. Figuring out the mechanism by which EBV participates in the formation of the tumor immunosuppressive microenvironment will help T cells or TCR-T cells break through the limitation and exert stronger antitumor potential.

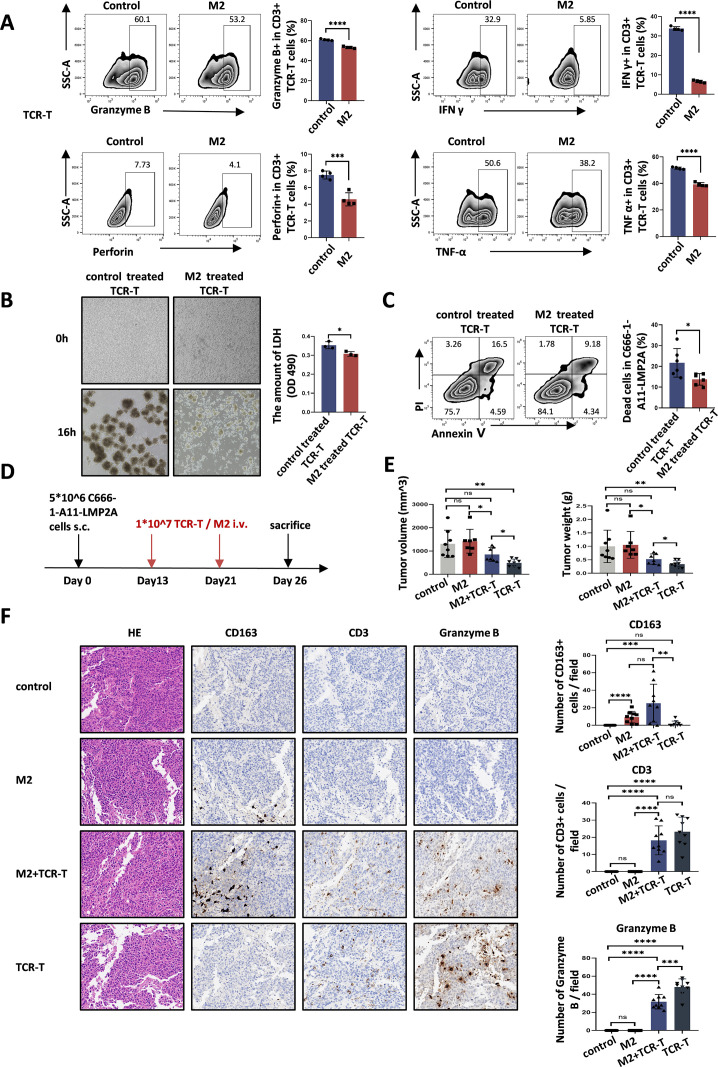
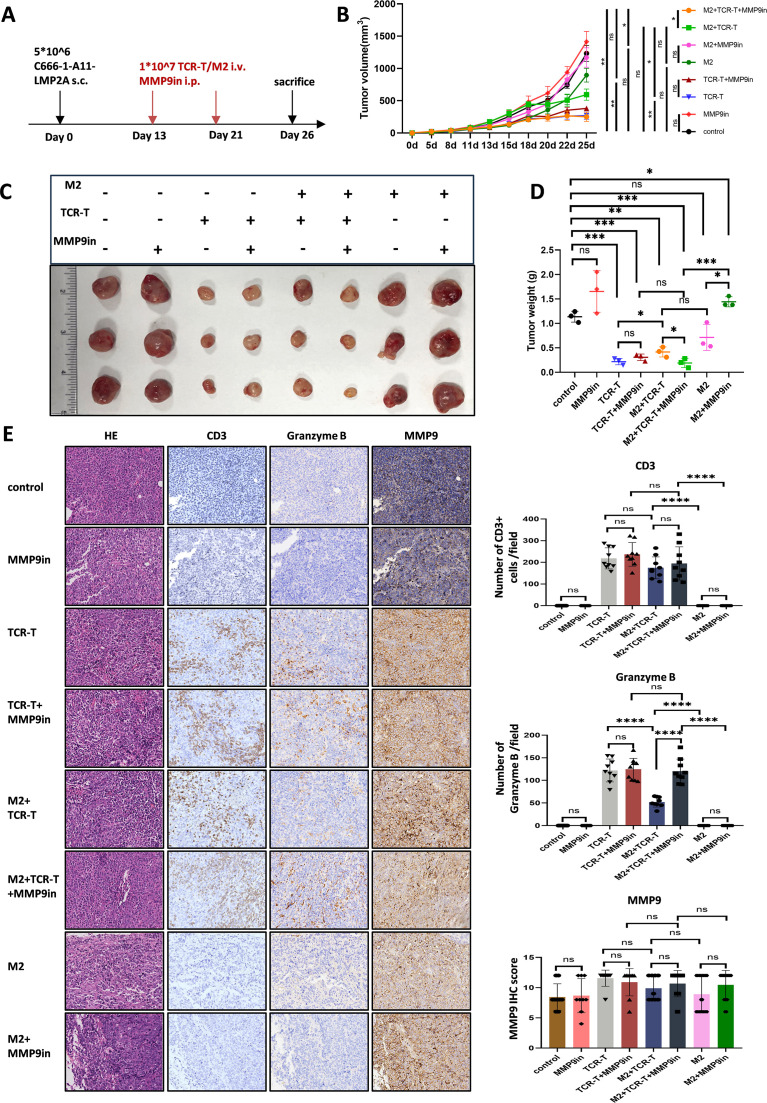
Methods: Flow cytometry was used for analyzing macrophage differentiation phenotypes induced by EBV-infected and EBV-uninfected tumors, as well as the function of T cells co-cultured with these macrophages. Xenograft model in mice was used to explore the effects of M2 macrophages, TCR-T cells, and matrix metalloprotein 9 (MMP9) inhibitors on the growth of EBV-infected tumors.

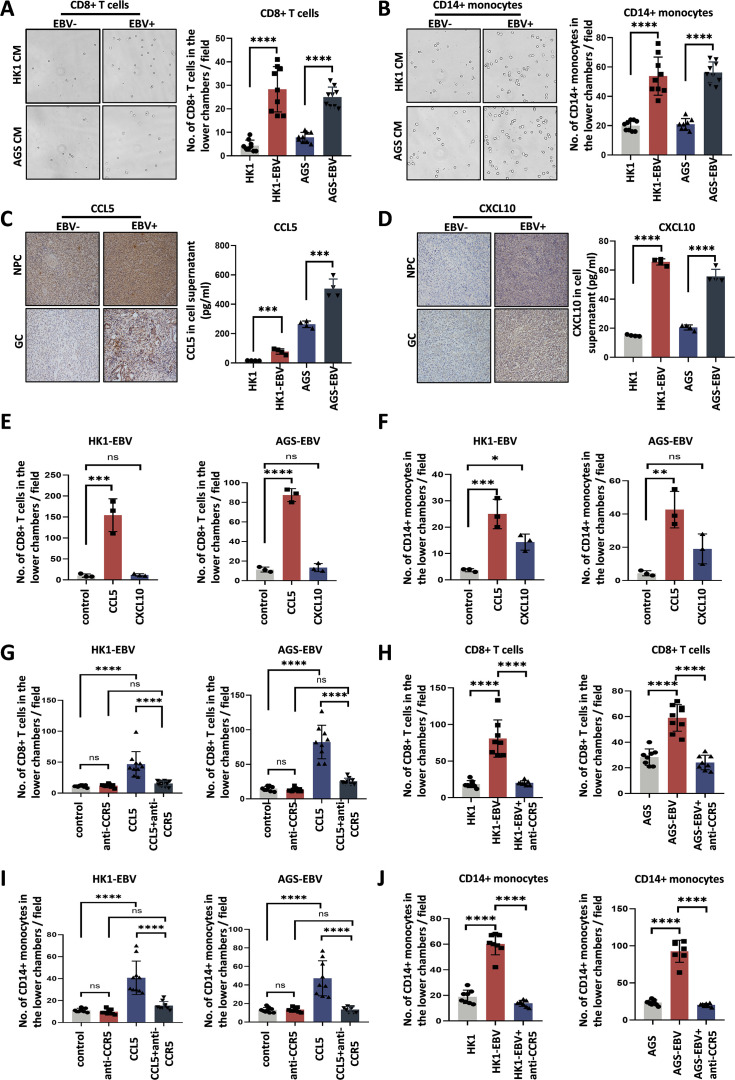
Results: EBV-positive tumors exhibited an exhaustion profile of T cells, despite the presence of a large T-cell infiltration. EBV-infected tumors recruited a large number of mononuclear macrophages with CCL5 and induced CD163+M2 macrophages polarization through the secretion of CSF1 and the promotion of autocrine IL10 production by mononuclear macrophages. Massive secretion of MMP9 by this group of CD163+M2 macrophages induced by EBV infection was an important factor contributing to T-cell exhaustion and TCR-T-cell therapy resistance in EBV-positive tumors, and the use of MMP9 inhibitors improved the function of T cells cocultured with M2 macrophages. Finally, the combination of an MMP9 inhibitor with TCR-T cells targeting EBV-positive tumors significantly inhibited the growth of xenografts in mice.

Conclusions: MMP9 inhibitors improve TCR-T cell function suppressed by EBV-induced M2 macrophages. TCR-T-cell therapy combined with MMP9 inhibitors was an effective therapeutic strategy for EBV-positive solid tumors.

Keywords: Head and Neck Neoplasms; Immune Evation; Immunotherapy; Macrophages; Tumor Microenvironment.


Conflict of interest statement

Competing interests: No, there are no competing interests.

Figures

Figure 1
Figure 1
Increased numbers of exhausted CD8+T cells and CD163+M2 macrophages within EBV-positive tumors. (A) Representative single-stained and merged images of panels (CD8, Granzyme B, DAPI) used for multiplex immunohistochemistry in EBV-positive and EBV-negative tumors. Magnification: ×400 (single-stained images and big merged images), ×200 (small merged images in the bottom right corner). (B–D) Statistical analysis of the density of CD8 (B) or Granzyme B (C) and the ratio of Granzyme B/CD8 (D) in multiplex immunohistochemistry. Mean±SD, n=3, two-tailed t-test. (E) Representative merged images of panels (CD8, Granzyme B, CD163, Pan-CK, DAPI) used in multiplex immunohistochemistry. Magnification: ×400 (small merged images in the top left corner), ×100 (big merged images). (F) Statistical analysis of the density of CD163 in EBV-positive and EBV-negative tumors by multiplex immunohistochemistry. Mean±SD, n=3, two-tailed t-test. *p<0.05, **p<0.01, ***p<0.001, ****p<0.0001. (G) Correlation analysis between CD163/mm2 and the Granzyme B/CD8 ratio in NPC, GC and LELC. EBV, Epstein-Barr virus; GC, gastric cancer; LELC, lymphoepithelioma-like carcinoma of the lung; NPC, nasopharyngeal cancer.
Figure 2
Figure 2
EBV-infected tumors secrete CCL5 to recruit T cells and monocytes. (A, B) Representative images (left) and quantification (right) of CD8+T cells (A) or CD14+monocytes (B) recruited to the lower chamber by EBV-infected or EBV-uninfected tumor supernatants. Magnification: ×400. Mean±SD, n=3, two-tailed t-test. (C, D) Left: Representative images of EBV-uninfected or EBV-infected nasopharyngeal and gastric cancer pathology sections stained with antibodies targeting CCL5 (C) or CXCL10 (D). Magnification: ×200. Right: Measurement of CCL5 (C) and CXCL10 (D) levels in the supernatant of EBV-uninfected or EBV-infected nasopharyngeal and gastric cancer cell lines by ELISA. Mean±SD, n=4, two-tailed t-test. (E, F) Quantification of CD8+T cells (E) or CD14+ monocytes (F) recruited to the lower chamber by 200 nM CCL5, 200 nM CXCL10 or serum-free RPMI 1640. CD8+T cells and CD14+monocytes were pretreated overnight with AGS-EBV or HK1-EBV cell supernatants. Mean±SD, n=3, one-way ANOVA. (G, I) Quantification of CD8+T cells (G) and CD14+monocytes (I) recruited to the lower chamber. CD8+T cells and CD14+monocytes were pretreated overnight with AGS-EBV or HK1-EBV cell supernatant, and anti-CCR5 or CCL5+anti-CCR5 groups were simultaneously treated with 200 nM CCR5 antibody overnight to block CCR5. CD8+T cells or CD14+ monocytes were then recruited with 200 nM CCL5 or serum-free RPMI 1640. Mean±SD, n=3, one-way ANOVA. (H, J) CD8+T cells or CD14+ monocytes were treated with or without CCR5 antibody overnight to block CCR5. The above cells were recruited with EBV-infected or EBV-uninfected tumor supernatants. Quantification of CD8+T cells (H) and CD14+ monocytes (J) recruited to the lower chamber. Mean±SD, n=3, one-way ANOVA. *p<0.05, **p<0.01, ***p<0.001, ****p<0.0001. ANOVA, analysis of variance; EBV, Epstein-Barr virus.
Figure 3
Figure 3
EBV-infected tumors promote CD163+M2 macrophages polarization. (A) Flow cytometry analysis of the CD163+M2 phenotype in THP-1 or CD14+ monocytes treated with EBV-infected or EBV-uninfected tumor supernatants. Mean±SD, n=4 (HK1), n=3 (AGS), two-tailed t-test. (B) Level of CSF1 in EBV-infected and EBV-uninfected tumor supernatants as measured by ELISA. Mean±SD, n=4, two-tailed t-test. (C) Flow cytometry analysis of the CD163+M2 phenotype of CD14+monocytes treated with 50 ng/mL CSF1, 80 ng/mL IL10, or both together. Mean±SD, n=3, one-way ANOVA. (D) Level of IL10 in EBV-infected and EBV-uninfected tumor supernatants as measured by ELISA. Mean±SD, n=4, two-tailed t-test. (E) Levels of IL10 in supernatants of mononuclear macrophages treated with EBV-infected and EBV-uninfected tumor supernatants for 3 days as measured by ELISA. Mean±SD, n=3, two-tailed t-test. (F) Levels of IL10 in mononuclear macrophage supernatants treated for 3 days with EBV-infected tumor supernatant, EBV-infected tumor supernatant and CSF1R inhibitor, 50 ng/mL CSF1, or no treatment as measured by ELISA. Mean±SD, n=4, two-tailed t-test. (G) Flow cytometry analysis of the CD163+M2 phenotype of CD14+monocytes treated with EBV-infected tumor supernatant (control), EBV-infected tumor supernatant and CSF1R inhibitor, EBV-infected tumor supernatant and anti-IL10R antibody, or EBV-infected tumor supernatant and CSF1R inhibitor and anti-IL10R antibody. Mean±SD, n=3, one-way ANOVA. *p<0.05, **p<0.01, ***p<0.001, ****p<0.0001. ANOVA, analysis of variance; EBV, Epstein-Barr virus.
Figure 4
Figure 4
CD163+M2 macrophages polarized by EBV suppresses T-cell function. (A) Volcano plot of differentially expressed genes between mononuclear macrophages induced with EBV-uninfected tumor supernatant and those induced with EBV-infected tumor supernatant for 3 days. (B) GO pathway enrichment analysis of differentially expressed genes between mononuclear macrophages treated with EBV-infected and EBV-uninfected tumor supernatant. (C, D) GSEA of differentially expressed genes between mononuclear macrophages treated with EBV-infected and EBV-uninfected tumor supernatant. (E) Flow cytometry analysis of T-cell functional molecules (Granzyme B, IFN γ, TNF α, Perforin) after 3 days of coculture with mononuclear macrophages polarized with EBV-uninfected or EBV-infected tumor supernatants. Mean±SD, n=3, two-tailed t-test. (F) Flow cytometry analysis of T-cell functional molecules after 3 days of coculture with mononuclear macrophages untreated (control) or polarized with 50 ng/mL CSF1+80 ng/mL IL10 (M2). (G) Statistical analysis of T-cell functional molecules in (F). Mean±SD, n=3, two-tailed t-test. (H) Flow cytometry analysis of T-cell functional molecules after 3 days of coculture with mononuclear macrophages induced by EBV-infected tumor culture medium (control), EBV-infected tumor culture medium and CSF1R inhibitor (CSF1Rin), EBV-infected tumor culture medium and anti-IL10R antibody (anti-IL10) or EBV-infected tumor culture medium and CSF1R inhibitor and anti-IL10R antibody (CSF1Rin+anti-IL10). (I) Statistical analysis of T-cell functional molecules in (H). Mean±SD, n=3, one-way ANOVA. *p<0.05, **p<0.01, ***p<0.001, ****p<0.0001. ANOVA, analysis of variance; EBV, Epstein-Barr virus; GO, Gene Ontology; GSEA, gene set enrichment analysis.
Figure 5
Figure 5
EBV-polarized CD163+M2 macrophages inhibit the cytotoxic capacity of TCR-T cells against tumors. (A) Flow cytometry analysis of functional molecules in TCR-T cells cocultured with CSF1+IL10-polarized M2 (M2) or untreated mononuclear macrophages (control) for 3 days. Mean±SD, n=4, two-tailed t-test. (B) Left: Images of C666-1-A11-LMP2A cells killed by TCR-T cells after coculture with untreated mononuclear macrophages (control treated TCR-T) or CSF1+IL10-polarized M2 macrophages (M2 treated TCR-T) for 3 days and then isolated via MACS at 0 hour and 16 hours. Magnification: ×100. Right: Statistical analysis of LDH released from C666-1-A11-LMP2A cells after 16 hours of killing by TCR-T cells. Mean±SD, n=3, two-tailed t-test. (C) Apoptosis rate analysis of C666-1-A11-LMP2A cells killed by TCR-T cells with different treatment for 16 hours by flow cytometry. Mean±SD, n=6, two-tailed t-test. (D) Experimental scheme diagram for the subcutaneous xenograft tumor model in NCG mice. (E) Tumor volume (left) and tumor weight (right) at day 26 after implantation. Mean±SD, n=7 (M2, M2+TCR T), n=8 (TCR-T, control), two-tailed t-test. (F) Left: Serial sections of mouse xenografts were stained with HE and antibodies targeting CD163, CD3, and Granzyme B. Magnification: ×200. Right: Statistical analysis of the number of CD163+cells, CD3+cells, and Granzyme B. Mean±SD, n=3, two-tailed t-test or Mann-Whitney U test. *p<0.05, **p<0.01, ***p<0.001, ****p<0.0001. EBV, Epstein-Barr virus; LDH, lactate dehydrogenase; HE, hematoxylin-eosin.
Figure 6
Figure 6
MMP9 secreted by EBV-induced CD163+M2 macrophages suppresses TCR-T-cell function in vitro. (A) Levels of MMP9 in the supernatants of mononuclear macrophages treated with different conditions (left) as well as in EBV-infected or EBV-uninfected tumor supernatants (right) measured by ELISA. Mean±SD, n=4, two-tailed t-test. (B) Left: Representative images of EBV-positive or EBV-negative nasopharyngeal and gastric cancer tissues stained with MMP9 antibody. Magnification: ×200. Right: IHC scores of MMP9. Mean±SD, n=5 (GC and NPC+), n=4 (NPC−), two-tailed t-test. (C) Flow cytometry analysis of functional molecules in TCR-T cells after 3 days of coculture with M2 macrophages induced by CSF1+IL10, M2 macrophages and MMP9 inhibitors, untreated monocytes (control), or untreated monocytes and MMP9 inhibitors (without C666-1-A11-LMP2A). Mean±SD, n=4, one-way ANOVA. (D) Images of C666-1-A11-LMP2A cells killed by TCR-T cells at 0 hour and 16 hours which were cocultured with M2 macrophages, M2 macrophages+MMP9 inhibitor, untreated monocytes or untreated monocytes+MMP9 inhibitor for 3 days and then isolated via MACS. Magnification: ×100. (E) Statistical analysis of LDH released from C666-1-A11-LMP2A cells after 16 hours of killing by TCR-T cells with different treatment. Mean±SD, n=5, two-tailed t-test. (F) Apoptosis analysis of C666-1-A11-LMP2A cells killed by TCR-T cells for 16 hours which were cocultured with M2 macrophages, M2 macrophages+MMP9 inhibitor, untreated monocytes or untreated monocytes+MMP9 inhibitor for 3 days and then isolated via MACS Mean±SD, n=4, two-tailed t-test. *p<0.05, **p<0.01, ***p<0.001, ****p<0.0001. ANOVA, analysis of variance; EBV, Epstein-Barr virus; IHC, immunohistochemistry.
Figure 7
Figure 7
The combination of TCR-T cells and MMP9 inhibitors synergistically induces the regression of EBV-positive xenograft tumors. (A) Experimental scheme diagram for the subcutaneous xenograft tumor model in NCG mice. (B) Tumor growth curves of subcutaneous xenograft tumors. Mean±SEM, n=3, two-way ANOVA. (C) Images of C666-1-A11-LMP2A xenograft tumors in mice treated with 1×10⁷ TCR-T cells (once a week, twice in total, i.v.), 1×10⁷ M2 macrophages (once a week, twice in total, i.v.), or an MMP9 inhibitor (20 mg/kg, twice a week, five times in total, i.p.) separately or together or untreated (control). (D) Statistical analysis of C666-1-A11-LMP2A xenograft weight in (C). Mean±SD, n=3, two-tailed t-test.(E) Left: Serial sections of mouse xenografts were stained with HE and antibodies targeting CD3, Granzyme B and MMP9. Magnification: ×200. Right: Statistical analysis of the number of CD3+cells, Granzyme B and IHC score of MMP9. Mean±SD, n=3, one-way ANOVA. *p<0.05, **p<0.01, ***p<0.001, ****p<0.0001. ANOVA, analysis of variance; IHC, immunohistochemistry; i.v., intravenous; i.p.,intraperitoneal.

References

    1. EPSTEIN MA, ACHONG BG, BARR YM. Virus particles in cultured Lymphoblasts from Burkitt’s lymphoma. Lancet 1964;1:702–3. 10.1016/s0140-6736(64)91524-7 - DOI - PubMed
    1. Kieff E, Rickinson AB. Epstein-Barr virus and its replication. In: Fields Virology. 2007.
    1. Farrell PJ. Epstein-Barr virus and cancer. Annu Rev Pathol 2019;14:29–53. 10.1146/annurev-pathmechdis-012418-013023 - DOI - PubMed
    1. Young LS, Yap LF, Murray PG. Epstein-Barr virus: more than 50 years old and still providing surprises. Nat Rev Cancer 2016;16:789–802. 10.1038/nrc.2016.92 - DOI - PubMed
    1. Lin C, Zong J, Lin W, et al. . EBV-miR-Bart8-3p induces epithelial-Mesenchymal transition and promotes metastasis of Nasopharyngeal carcinoma cells through activating NF-ΚB and Erk1/2 pathways. J Exp Clin Cancer Res 2018;37:283. 10.1186/s13046-018-0953-6 - DOI - PMC - PubMed

MeSH terms