. 2024 Jun 17;15(1):5170.
doi: 10.1038/s41467-024-49549-7.

NCF4 attenuates colorectal cancer progression by modulating inflammasome activation and immune surveillance

Affiliations

NCF4 attenuates colorectal cancer progression by modulating inflammasome activation and immune surveillance

Longjun Li et al. Nat Commun. .

Abstract

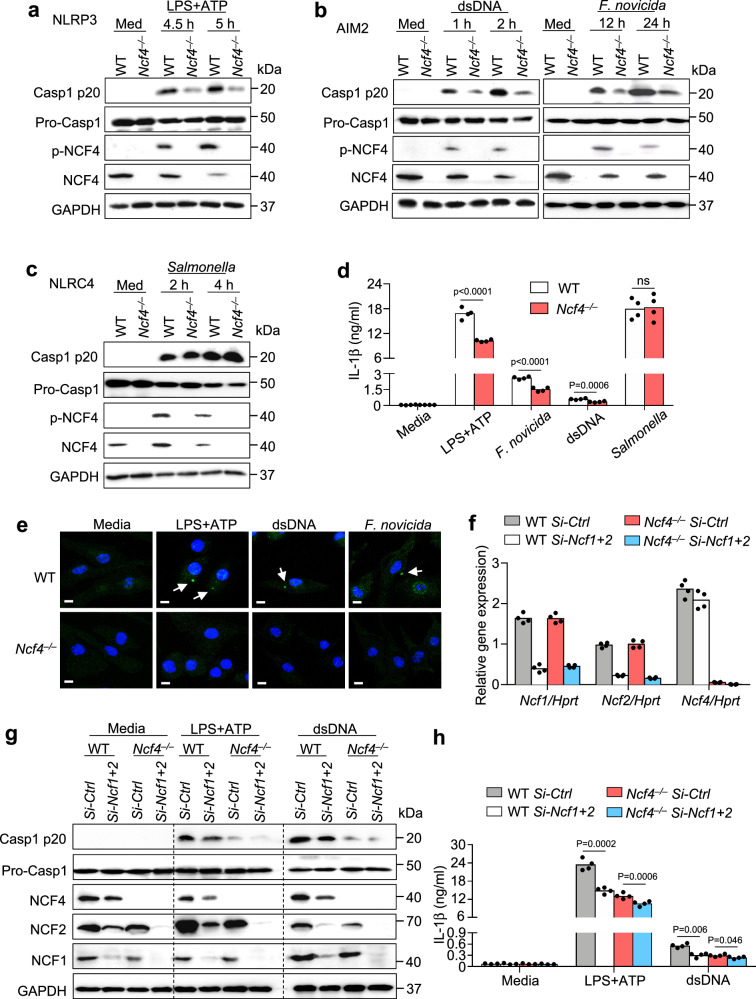
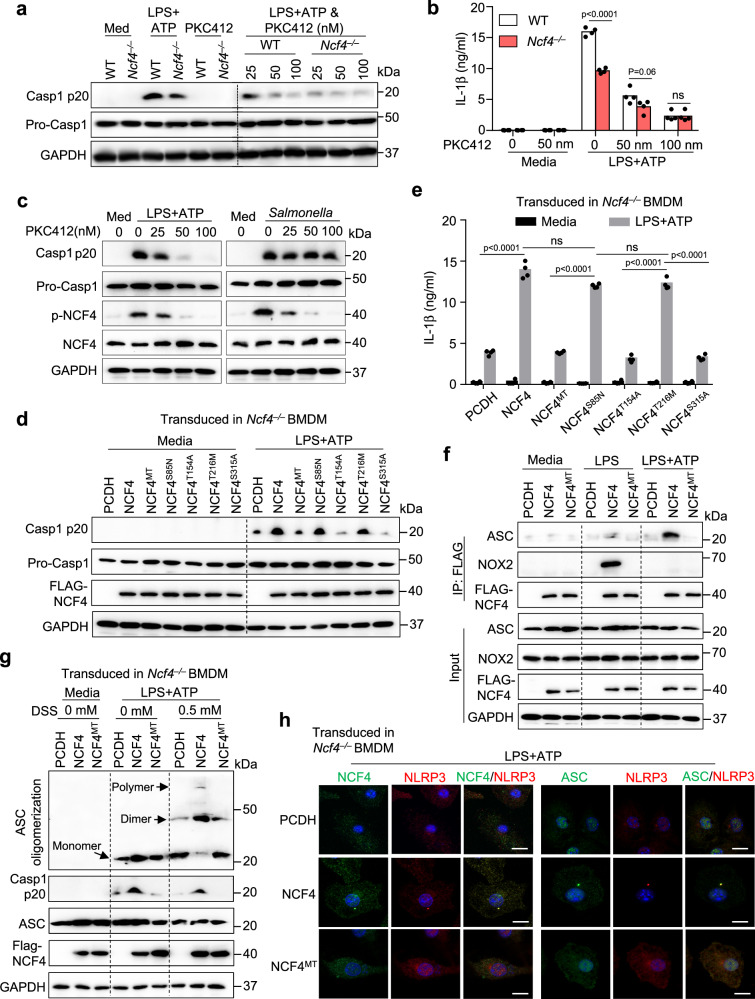
The spatiotemporal regulation of inflammasome activation remains unclear. To examine the mechanism underlying the assembly and regulation of the inflammasome response, here we perform an immunoprecipitation-mass spectrometry analysis of apoptosis-associated speck-like protein containing a CARD (ASC) and identify NCF4/1/2 as ASC-binding proteins. Reduced NCF4 expression is associated with colorectal cancer development and decreased five-year survival rate in patients with colorectal cancer. NCF4 cooperates with NCF1 and NCF2 to promote NLRP3 and AIM2 inflammasome activation. Mechanistically, NCF4 phosphorylation and puncta distribution switches from the NADPH complex to the perinuclear region, mediating ASC oligomerization, speck formation and inflammasome activation. NCF4 functions as a sensor of ROS levels, to establish a balance between ROS production and inflammasome activation. NCF4 deficiency causes severe colorectal cancer in mice, increases transit-amplifying and precancerous cells, reduces the frequency and activation of CD8+ T and NK cells, and impairs the inflammasome-IL-18-IFN-γ axis during the early phase of colorectal tumorigenesis. Our study implicates NCF4 in determining the spatial positioning of inflammasome assembly and contributing to inflammasome-mediated anti-tumor responses.


Conflict of interest statement

The authors declare no competing interests.

Figures

Fig. 1
Fig. 1. ASC-interacting protein NCF4 is associated with colorectal cancer development.
a Immunoblot analysis of ASC from the immunoprecipitated products generated with immunoprecipitation with an ASC antibody from the lysates of WT and Asc–/– BMDMs infected with F. novicida (100 MOI) for 12 h. b Mass spectrometry analysis of the IP product in (a). The peptides of ASC, NCF4, NCF1, and NCF2 were detected in the IP product with ASC antibody from WT and Asc–/– BMDMs in two repeated experiments. c Immunoblot analysis of Myc-ASC co-IP with FLAG-NCF4, FLAG-NCF4-PX, FLAG-NCF4-SH3 and FLAG-NCF4-PB1 from lysates of HEK293T cells transfected with the indicated plasmids. d Immunoblot analysis of FLAG-NCF4 co-IP with V5-ASC, V5-ASC-PYD, and V5-ASC-CARD from lysates of HEK293T cells transfected with the indicated plasmids. e Co-IP analysis of endogenous ASC interacting with total and phosphorylated NCF4, NCF1, and NCF2 in WT and Asc–/– BMDMs treated with the NLRP3 activator LPS plus ATP (LPS, 500 ng/mL for 4 h and ATP, 5 mM for 15 min). f Gene expression analysis of NCF1, NCF2, and NCF4 in total (left) and paired (right, n = 41) colorectal tumors (n = 480) and control tissues (n = 41) from 480 colorectal cancer (CRC) patients of pooled colon and rectal adenocarcinoma datasets in the TCGA database. g Correlation analysis between the gene expression of NCF4 and survival rate of CRC patients. (High, n = 466; Low, n = 131) Data are from 2 (a, b) or representative of 3 independent experiments with similar results (ce). Wilcoxon signed rank test for (f), Log-rank (Mantel–Cox) test for (g), p-value is indicated in the graph. Source data are provided as a Source Data file.
Fig. 2
Fig. 2. NCF4 mediates the activation of both NLRP3 and AIM2 inflammasomes.
ac Immunoblot analysis of pro-caspase-1 (Pro-Casp1), its subunit p20, total and phosphorylated NCF4 in WT and Ncf4–/– BMDMs without treatment (Med) or stimulated with LPS (500 ng/mL, 4 h) and ATP (5 mM, 30 min and 60 min) for NLRP3 inflammasome activation (a), transfected with dsDNA (1.5 μg, 1 h and 2 h) or infected with F. novicida (200 MOI, 12 h and 24 h) for AIM2 inflammasome activation (b), and Salmonella enterica Typhimurium (3 MOI, 2 h and 4 h) for NLRC4 inflammasome activation (c). d Analysis of IL-1β release in WT and Ncf4–/– BMDMs without treatment (Media) or stimulated with LPS (500 ng/mL, 4 h) and ATP (5 mM, 60 min), transfected with dsDNA (1.5 μg, 2 h), infected with F. novicida (200 MOI, 24 h), and Salmonella enterica Typhimurium (3 MOI, 4 h) (n = 4 biologically independent samples). e Confocal microscopy analysis of ASC speck formation in WT and Ncf4–/– BMDMs without treatment or stimulated with LPS (500 ng/mL, 4 h) and ATP (5 mM, 30 min), or transfected with dsDNA (1.5 μg, 1 h); or infected with F. novicida (200 MOI, 12 h) as indicated. Arrows indicate ASC specks. Scale bars: 10 μm. fh WT and Ncf4–/– BMDMs were transfected with siRNAs of Ncf1 and Ncf2, and further treated with LPS (500 ng/mL, 4 h) and ATP (5 mM, 60 min), and transfected with dsDNA (1.5 μg, 2 h) for inflammasome activation analysis. f qRT-PCR analysis of Ncf1, Ncf2, and Ncf4 in WT and Ncf4–/– BMDMs transfected with control siRNA or siRNAs of Ncf1 and Ncf2 (n = 4 technical replicates; 3 independent experiments). g, h Immunoblot analysis of pro-caspase-1 (Pro-Casp1), its subunit p20, NCF4, NCF2, and NCF1 (g), and analysis of IL-1β release (h) in WT and Ncf4–/– BMDMs transfected with siRNAs and further treated with inflammasome stimuli as indicated (n = 4 biologically independent samples). Data are from 3 (d, h) or representative of 3 independent experiments with similar results (ac, eg). Data represent Mean ± SEM for (d, f, h), 2-sided Student’s t-test without multiple-comparisons correction, p-value is indicated in the graph. Source data are provided as a Source Data file.
Fig. 3
Fig. 3. NCF4 deficiency promotes tumorigenesis of CRC.
a Body weight change analysis of gender- and age-matched WT (n = 14), Ncf4+/– (n = 9), and Ncf4–/– (n = 13) mice after AOM injection at Day 0 and three rounds treatment of DSS (2%). b Survival analysis of WT (n = 24), Ncf4+/– (n = 14), and Ncf4–/– (n = 20) mice after AOM injection at Day 0 and three rounds of treatment of DSS (2%). c, d Colorectal tumors in WT (n = 13), Ncf4+/– (n = 7), and Ncf4–/– (n = 7) mice day 70 under AOM-DSS treatment. Scale bar: 10 mm. e H&E staining of Colorectal tumors in WT, Ncf4+/–, and Ncf4–/– mice in (c). Scale bars: 10 μm. f, g Immunoblot analysis of caspase-1 (f) and ELISA analysis of IL-18, IL-1β, TNF and IL-6 (g) in colon tissues from WT (n = 18), Ncf4+/– (n = 10), and Ncf4–/– mice (n = 8) in (c). hj Colorectal tumors (h, i) and spleens (j) from gender- and age-matched offspring of ApcMin/+ mice crossed with Ncf4–/– mice with genotype as indicated (n = 8 for WT, n = 10 for Ncf4+/–, and n = 8 for Ncf4–/– in i). Scale bars: 10 mm for (h), and 5 mm for (j). Data are from 2 (b, g, i) or representative of 3 independent experiments with similar results (a, c, df, h, j). Data represent Mean ± SEM for (d, g, i), 2-sided Student’s t-test without multiple-comparisons correction, two-way ANOVA for (a), Log-rank (Mantel–Cox) test for (b), p-value is indicated in the graph. Source data are provided as a Source Data file.
Fig. 4
Fig. 4. NCF4 puncta colocalizes with ASC speck.
a Confocal microscopy analysis of the colocalization of NCF1 and NCF2, NCF1, and NCF4 in WT, Ncf4–/–, Asc–/–, and Nlrp3–/–Aim2–/– BMDMs stimulated with LPS (500 ng/mL, 4 h) and ATP (5 mM, 30 min) for NLRP3 inflammasome activation. Arrows indicate colocalized puncta; Arrowheads indicate separated puncta. Scale bars: 10 μm. b Quantification analysis of the colocalization of NCF1 and NCF2, NCF1 and NCF4 in WT, Ncf4–/–, Asc–/–, and Nlrp3–/–Aim2–/– BMDMs treated with LPS alone, or LPS plus ATP for inflammasome activation. At least 400 cells for NCF1/NCF2 colocalization analysis in LPS plus ATP treated groups and 130 (130–200) cells were analyzed for other groups (n = 3 biologically independent samples). c Confocal microscopy analysis of the colocalization of NLRP3 and ASC, NCF1 and ASC, NLRP3 and NCF2, NLRP3, and NCF4 in WT BMDMs treated with LPS plus ATP for inflammasome activation. Arrows indicate colocalized puncta; Arrowheads indicate separated puncta. Scale bars: 10 μm. d Quantification analysis of the colocalization of NLRP3 and ASC, NCF1 and ASC, NLRP3 and NCF2, NLRP3 and NCF4 in (c). At least 130 (130–200) cells were analyzed for each group (n = 3 biologically independent samples). Data are from 3 (b, d) or representative of 3 independent experiments with similar results (a, c). Data represent Mean ± SEM for (b, d), 2-sided Student’s t-test without multiple-comparisons correction, p-value is indicated in the graph. Source data are provided as a Source Data file.
Fig. 5
Fig. 5. NCF4 contributes to both ROS production and inflammasome activation.
a FACS analysis of ROS production in untreated (Media), LPS-treated (500 ng/mL), and LPS (500 ng/mL) plus ATP (5 mM)-treated WT and Ncf4–/– BMDMs for the indicated time. b Immunoblot analysis of caspase-1 maturation and ELISA analysis of IL-1β production (n = 4 biologically independent samples) in WT and Ncf4–/– BMDMs without (Med) or with H2O2 treatment (10 μM, 1 h). c, d Co-IP analysis of endogenous NCF4 interacting with ASC and NCF1 (c), and endogenous NCF1 interacting with ASC and NCF4 (d) in WT and Asc–/– BMDMs without treatment (Med), treated with LPS (500 ng/mL, 4.5 h) or with LPS plus ATP (L+A; LPS, 500 ng/mL, 4 h and ATP, 5 mM, 15 min) for NLRP3 inflammasome activation. e, f Quantification analysis of the relative portion of NCF4 (e) and NCF1 (f) interaction with other proteins in (c, d) (n = 2 biologically independent samples). g 3D-Confocal microscopy analysis of the colocalization of NCF1 and NCF2, NCF1 and NCF4 in WT BMDMs stimulated with LPS (500 ng/mL, 4.5 h), or in WT, Ncf4–/–, and Asc–/– BMDMs stimulated with LPS (500 ng/mL, 4 h) plus ATP (5 mM, 30 min) for NLRP3 inflammasome activation. Scale bars: 10 μm. Data are from 3 (b, IL-β) or representative of 3 independent experiments with similar results for others. Data represent Mean ± SEM for (b, IL-β), 2-sided Student’s t-test without multiple-comparisons correction, p-value is indicated in the graph. Source data are provided as a Source Data file.
Fig. 6
Fig. 6. The phosphorylation of NCF4 is important for NLRP3 inflammasome activation.
a, b WT and Ncf4–/– BMDMs were pretreated with PKC412 (25 nm, 50 nm, and 100 nm) for 1 h, and further stimulated with LPS (500 ng/mL, 4 h) plus ATP (5 mM, 60 min) for NLRP3 inflammasome activation. Immunoblot analysis of pro-caspase-1 (Pro-Casp1) and its subunit p20 (a), and analysis of IL-1β release (b, n = 4 biologically independent samples) in PKC412-treated and untreated BMDMs with and without treatment for NLRP3 inflammasome activation. c Immunoblot analysis of phosphorylation of NCF4, pro-caspase-1 (Pro-Casp1) and its subunit p20 in untreated and PKC412-treated WT BMDMs with and without treatment with the NLRP3 activator LPS plus ATP (LPS, 500 ng/mL, 4 h and ATP, 5 mM, 60 min) or the NLRC4 activator Salmonella enterica Typhimurium (3 MOI, 2 h). d, e Immunoblot analysis of pro-caspase-1 (Pro-Casp1) and its subunit p20 (d), and analysis of IL-1β release (e, n = 4 biologically independent samples) in Ncf4–/– BMDMs transduced with WT NCF4 and single or quadruple mutations (NCF4MT) of phosphorylation sites of NCF4 as indicated, further stimulated with LPS plus ATP (LPS, 500 ng/mL, 4 h and ATP, 5 mM, 60 min). f Co-IP analysis of transduced NCF4 interacting with ASC and NOX2 in Ncf4–/– BMDMs transduced with control plasmid (PCDH), WT NCF4 and quadruple mutations (NCF4MT) of phosphorylation sites of NCF4 without treatment (Media), treated with LPS (500 ng/mL, 4.5 h) or with LPS plus ATP (LPS, 500 ng/mL, 4 h and ATP, 5 mM, 15 min). g ASC oligomerization analysis in Ncf4–/– BMDMs transduced with control plasmid (PCDH), WT NCF4, and quadruple mutations (NCF4MT) of phosphorylation sites of NCF4 without treatment (Media) and treated with LPS plus ATP (LPS, 500 ng/mL, 4 h and ATP, 5 mM, 30 min). h Confocal microscopy analysis NCF4, NCF4MT, NLRP3, and ASC subcellular localization in Ncf4–/– BMDMs transduced with control plasmid (PCDH), WT NCF4 and quadruple mutations (NCF4MT) of phosphorylation sites of NCF4 response to LPS plus ATP (LPS, 500 ng/mL, 4 h and ATP, 5 mM, 30 min). Scale bars: 20 μm. Data are from 3 (b, e) or representative of 3 independent experiments with similar results (a, c, d, fh). Data represent Mean ± SEM for (b, e), 2-sided Student’s t-test without multiple-comparisons correction, p-value is indicated in the graph. Source data are provided as a Source Data file.
Fig. 7
Fig. 7. NCF4 promotes the activation of NK and CD8+ T cells within the colonic microenvironment in the precancerous stage.
Single-cell RNA sequencing analysis of colonic cells isolated from WT (n = 3) and Ncf4–/–mice (n = 3) at Day 35 post AOM treatment. a Uniform manifold approximation and projection (UMAP) plot and fraction illustrating the distribution of immune and epithelial cells colored by cluster. TA, transit-amplifying cells; Lig Enterocytes, large intestine gland enterocytes; ASC, adenoma-specific cells; EEC, enteroendocrine cells; and SeEPC, stem-early enterocyte precursor cells. b UMAP embedding of all epithelial cells with the stochastic representation of the RNA velocity. c UMAP plot of epithelial cells showing expression of a gene with stem-like features (tumor marker), Slc12a2 and Fermt1. d Representative immunohistochemical image of colon tissues from WT (n = 3) and Ncf4–/– mice (n = 3) stained with anti-SLC12A2 and anti-FERMT1. Scale bars: 10 μm. e UMAP embedding of sub-clustering of CD4+ T, CD8+ T, and NK cell clusters, colored by subclusters. The identity of each cluster was redetermined by its predominant cells. The annotation of each subcluster was determined by its marker genes. f UMAP plot and fraction illustrating the distribution of the subcluster of immune cells in (e). The cells in the UMAP plot were colored by sample identity. g Chord diagram showing potential interactions or communication between different cell types mediated by IFN-γ signaling pathway. There was no significant interaction in Ncf4–/– mice compared to the WT mice. TA transit-amplifying cells, TC TA carcinoma, DE1 distal enterocytes 1, LE large intestine gland enterocytes, AC adenoma-specific cells, EEC enteroendocrine cells. h, i Representative flow cytometry plots (h) and quantification analysis (i) of IFN-γ+ cells in colonic CD45.2+, CD4+ T, CD8+ T and NK cells from WT (n = 7) and Ncf4–/– (n = 7) mice as indicated. Data are representative of 3 independent experiments with similar results (d, h, i). Data represent Mean ± SEM for (i), 2-sided Student’s t-test without multiple-comparisons correction, p-value is indicated in the graph. Source data are provided as a Source Data file.

References

    1. Guo H, Callaway JB, Ting JPY. Inflammasomes: mechanism of action, role in disease, and therapeutics. Nat. Med. 2015;21:677–687. doi: 10.1038/nm.3893. - DOI - PMC - PubMed
    1. Man SM, Kanneganti TD. Regulation of inflammasome activation. Immunol. Rev. 2015;265:6–21. doi: 10.1111/imr.12296. - DOI - PMC - PubMed
    1. Sharma D, Kanneganti T-D. The cell biology of inflammasomes: mechanisms of inflammasome activation and regulation. J. Cell Biol. 2016;213:617–629. doi: 10.1083/jcb.201602089. - DOI - PMC - PubMed
    1. Liu X, Xia S, Zhang Z, Wu H, Lieberman J. Channelling inflammation: gasdermins in physiology and disease. Nat. Rev. Drug Discov. 2021;20:384–405. doi: 10.1038/s41573-021-00154-z. - DOI - PMC - PubMed
    1. Lamkanfi M, Dixit VM. Inflammasomes and their roles in health and disease. Annu. Rev. Cell Dev. Biol. 2012;28:137–161. doi: 10.1146/annurev-cellbio-101011-155745. - DOI - PubMed

MeSH terms