. 2024 Jun 17;15(1):5153.
doi: 10.1038/s41467-024-48746-8.

Differential cortical layer engagement during seizure initiation and spread in humans

Affiliations

Differential cortical layer engagement during seizure initiation and spread in humans

Pierre Bourdillon et al. Nat Commun. .

Abstract

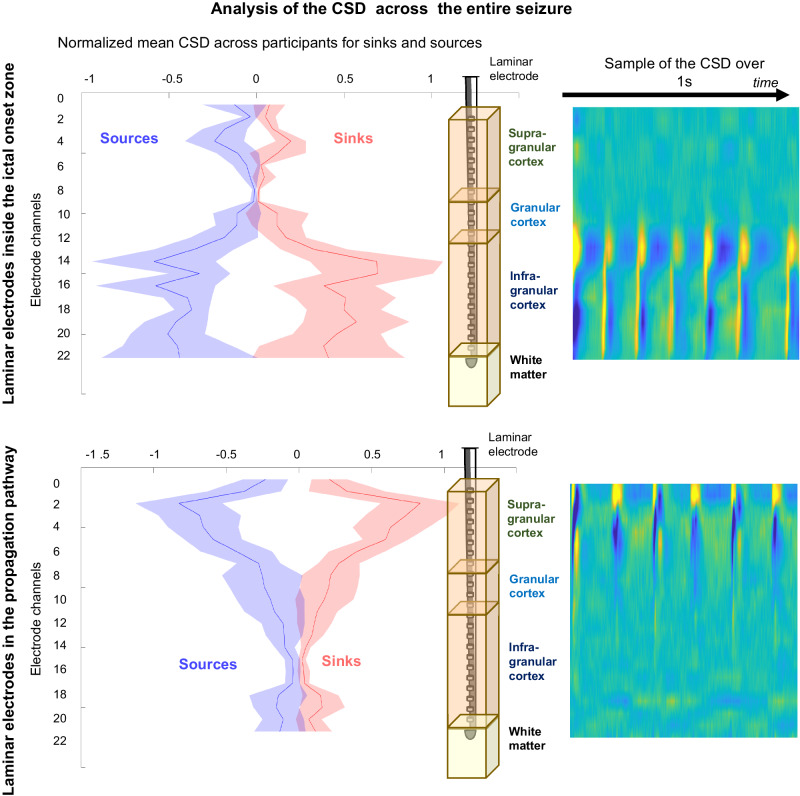
Despite decades of research, we still do not understand how spontaneous human seizures start and spread - especially at the level of neuronal microcircuits. In this study, we used laminar arrays of micro-electrodes to simultaneously record the local field potentials and multi-unit neural activities across the six layers of the neocortex during focal seizures in humans. We found that, within the ictal onset zone, the discharges generated during a seizure consisted of current sinks and sources only within the infra-granular and granular layers. Outside of the seizure onset zone, ictal discharges reflected current flow in the supra-granular layers. Interestingly, these patterns of current flow evolved during the course of the seizure - especially outside the seizure onset zone where superficial sinks and sources extended into the deeper layers. Based on these observations, a framework describing cortical-cortical dynamics of seizures is proposed with implications for seizure localization, surgical targeting, and neuromodulation techniques to block the generation and propagation of seizures.


Conflict of interest statement

The authors declare no competing interests.

Figures

Fig. 1
Fig. 1. Example of LFP (Local Field Potential) and CSD (Current Source Density) inside and outside the seizure onset zone.
A The laminar electrode (yellow dot) was implanted within the ictal onset zone (red shading). Seizure onset (red arrow) on laminar recordings is similar to the adjacent ECoG electrodes. Ictal activities were first observed in granular and infra-granular layer recordings (sources are plotted in blue) with sinks both in the adjacent granular cortex and in the deepest infragranular cortex. Later during the seizure, the source moved into the deepest layer and the sink is constituted by all the remaining granular and infragranular cortex. B The laminar electrode (yellow dot) was implanted outside the ictal onset zone. Seizure onset (red arrow) on laminar recordings is late as compared to the adjacent ECoG electrodes. Ictal activities were first observed in supra-granular layers with sinks in the adjacent supra-granular cortex. Later during the seizure, the pattern appears to be more intense but grossly similar in morphological features.
Fig. 2
Fig. 2. Activity evolves through time across layers during a seizure.
A Example in a single participant having two laminar electrodes of change of the CSD over time for a seizure recorded within the ictal onset zone (top) and outside the ictal onset zone (bottom). The start and end of seizures are marked with red arrows. The red lines represent the CSD distribution across the cortex and the clear change in the CSD spread for seizures outside the onset zone. Insets in the middle show an expanded view of the CSD at different time points. B Average representation of CSD evolution across all participants and seizures during seizures recorded within the ictal onset zone (upper matrix) and outside of the ictal onset zone (bottom matrix). The values correspond to the normalized distribution of the absolute values of CSD (thus combining sink and source) differing significantly from the baseline.
Fig. 3
Fig. 3. Distribution of CSD values (mean values +/- SEM).
Left: Normalized mean across subjects and seizures of the CSD for sources (in blue) and sinks (in red) for electrodes implanted in the ictal onset zone (left) and in an area of spread (right). The CSD is not limited to the ictal discharges but is computed on the whole signal during the seizures. Right: Samples of CSD raw data with the same colour scale as for Fig. 1 and recorded in supra and infra-granular are represented to illustrate the temporal alternation of sources and sinks. Example from single participants of the sink/source alternation over 1 s during a seizure.
Fig. 4
Fig. 4. Independent Components Analysis (ICA) reveal evolving patterns differentiating the ictal zone from outside the ictal zone.
A recording from the ictal onset zone. B a propagation region. In both A and B, the top plot shows the CSD over time in all channels. The middle plot shows the results of the independent component analysis during the same time period, and the lower plot represents the identified pattern(s). A diagram of the temporal dynamics of detected patterns is illustrated below the lower plots in both A and B.
Fig. 5
Fig. 5. Multi-unit activity (MUA) changes across cortical layers alongside CSD.
A Example of CSD (top) and MUA (bottom) during ictal discharge generation inside the ictal onset zone (left) and the propagation pathway (right). B Example of three single laminar channels from supra-granular, granular and infra-granular layers from two participants showing both the LFP and the MUA during the whole seizure. Top, laminar electrode implanted inside the ictal onset zone. Bottom, laminar electrode implanted outside the ictal onset zone. C Normalized mean (mean values +/- SEM) CSD (purple) and MUA (black) across participants (n = 9) inside (left) and outside (right) the ictal onset zone (n = 22 seizures).
Fig. 6
Fig. 6. Hypothetical schema of seizure generation in the ictal onset zone (red column) and its propagation (blue columns).
Red arrows show interpopulation spread of ictal activity. The exact cell types involved in each layer remain to be described. The red circles represent the regions where a pathological CSD has been demonstrated and the yellow ones where an increase in MUA has been described (see Fig. 3).

References

    1. Kwan P, Sander JW. The natural history of epilepsy: an epidemiological view. J. Neurol. Neurosurg. Psychiatry. 2004;75:1376–1381. doi: 10.1136/jnnp.2004.045690. - DOI - PMC - PubMed
    1. Ryvlin P, Cross JH, Rheims S. Epilepsy surgery in children and adults. Lancet Neurol. 2014;13:1114–1126. doi: 10.1016/S1474-4422(14)70156-5. - DOI - PubMed
    1. Rugg-Gunn F, Miserocchi A, McEvoy A. Epilepsy surgery. Pr. Neurol. 2020;20:4–14. - PubMed
    1. Isnard J, et al. French guidelines on stereoelectroencephalography (SEEG) Neurophysiol. Clin. 2018;48:5–13. doi: 10.1016/j.neucli.2017.11.005. - DOI - PubMed
    1. Chauvel P, Gonzalez-Martinez J, Bulacio J. Presurgical intracranial investigations in epilepsy surgery. Handb. Clin. Neurol. 2019;161:45–71. doi: 10.1016/B978-0-444-64142-7.00040-0. - DOI - PubMed