. 2024 Jun 17;15(1):5144.
doi: 10.1038/s41467-024-49562-w.

Low potassium activation of proximal mTOR/AKT signaling is mediated by Kir4.2

Affiliations

Low potassium activation of proximal mTOR/AKT signaling is mediated by Kir4.2

Yahua Zhang et al. Nat Commun. .

Abstract

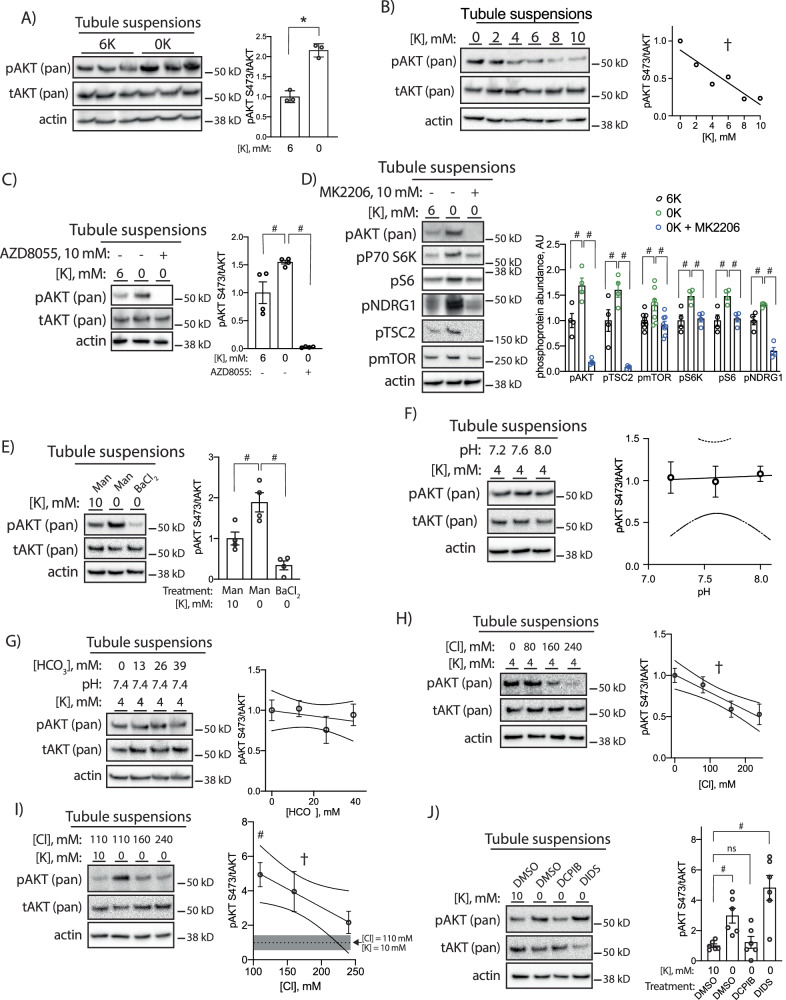
The renal epithelium is sensitive to changes in blood potassium (K+). We identify the basolateral K+ channel, Kir4.2, as a mediator of the proximal tubule response to K+ deficiency. Mice lacking Kir4.2 have a compensated baseline phenotype whereby they increase their distal transport burden to maintain homeostasis. Upon dietary K+ depletion, knockout animals decompensate as evidenced by increased urinary K+ excretion and development of a proximal renal tubular acidosis. Potassium wasting is not proximal in origin but is caused by higher ENaC activity and depends upon increased distal sodium delivery. Three-dimensional imaging reveals Kir4.2 knockouts fail to undergo proximal tubule expansion, while the distal convoluted tubule response is exaggerated. AKT signaling mediates the dietary K+ response, which is blunted in Kir4.2 knockouts. Lastly, we demonstrate in isolated tubules that AKT phosphorylation in response to low K+ depends upon mTORC2 activation by secondary changes in Cl- transport. Data support a proximal role for cell Cl- which, as it does along the distal nephron, responds to K+ changes to activate kinase signaling.


Conflict of interest statement

The authors declare no competing interests.

Figures

Fig. 1
Fig. 1. Blood electrolytes in Kir4.2+/+ and Kir4.2−/− animals following four days on 0 K diet.
Blood (A) K+(p = 0.034), (B) Na+ (p = 0.0059), (C) Cl (p = 3 × 10⁻⁵), and (D) HCO3 (1.5 × 10⁻⁴) values in Kir4.2+/+ and Kir4.2−/− animals after four days on 0 K diet. Daily urine K+ (E) concentration and (F) excretion at baseline and on 0 K diet for indicated time. G Cumulative urine K+ losses on 0 K diet (p = 0.0068, 0.0002, <0.0001, <0.0001). H Urine K+ excretion normalized to creatinine from spot urines collected from animals at baseline and on 0 K diet for indicated times (p = 0.018, 0.0096). Daily urine Na+ (I) concentration and (J) excretion at baseline and on 0 K diet for indicated time. K Normalized daily hour urine Na+ excretion in mice consuming a 0 K diet for 1 day (p = 0.024). L Calculated free water clearance for mice consuming a 0 K diet for 1 day (p = 0.032). N = 5 per group for (AD) and (L) except (A) where N = 5 for Kir4.2+/+ and 4 for Kir4.2−/−. One knockout blood K+ sample was excluded for the presence of gross hemolysis. N = 10 per group for (EJ) and 15 per group for (K). *P < 0.05 by unpaired t test. #P < 0.05 for genotype difference at indicated timepoints by two-way ANOVA with repeated measures followed by Sidak’s multiple comparison test. P < 0.05 for interaction between treatment and time variables by two-way ANOVA with repeated measures. All tests were two-sided. Data presented as mean ± sem.
Fig. 2
Fig. 2. Effects of dietary Na+ intake and ENaC inhibition on urine K+ excretion in Kir4.2+/+ and Kir4.2−/− animals.
A Urine K+ excretion at baseline and on 0 K diet for indicated timepoints in Kir4.2+/+ and Kir4.2−/− mice. Diet contained 0% Na+ with 0 K (purple and green). B Urine K+ excretion on day three of 0 K from animals treated with normal Na+ or as in (A). Note black and red data (both genotypes on 0.3% Na+) are from panel 1 h (p = 0.0011 and 0.0082). Urine (C) K+ excretion at baseline and on 0 K diet in Kir4.2−/− mice. Amiloride was added to drinking water at indicated time point (p = 0.02). D Comparison of urine K+ excretion between Kir4.2+/+ and Kir4.2−/− mice after three days of consuming a 0 K diet with and without amiloride treatment (p = 0.0027 for interaction). Blood (E) K+ (p = 5 × 10⁻⁶) (F) Na+ (p = 0.038), (G) Cl- (p = 0.044), and (H) HCO3 from Kir4.2−/− mice treated as in (C). N = 5 for all, except day 1 of 0 K in 2a where n = 2 and 4 (3 Kir4.2+/+ and 1 Kir4.2−/− animals did not consume diet and so data were not included in analysis), and N = 6 for WT 0 K in (D). #, P < 0.05 for genotype difference at indicated timepoints by two-way ANOVA with or without repeated measures followed by Sidak’s multiple comparison test. *P < 0.05 by unpaired t test. ††p < 0.05 for interaction by two-way ANOVA. All tests were two-sided. Data presented as mean ± sem.
Fig. 3
Fig. 3. Effects of Kir4.2 deletion on distal renal epithelial transporters/channels in mice on a normal diet.
Total kidney abundances of (A) αENaC, γENaC, total NKCC2, Kir4.2 and (B) pNCC-T53 and total NCC in Kir4.2+/+ and Kir4.2−/− animals. ► uncleaved γENaC, → cleaved γENaC. C Plasma aldosterone concentrations in Kir4.2+/+ and Kir4.2−/− animals (p = 0.0096). DH Quantification for blots shown in (A) and (B) (p = 0.013 for (E), 0.011 for (F), 0.010 for (G), and 0.041 for (H)). I Natriuretic and (J) kaliuretic responses of Kir4.2+/+ and Kir4.2−/− mice following acute HCTZ treatment (p = 0.013 for I and 0.012 for ( J). K Natriuretic, (L) kaliuretic, and (M) calciuretic responses of Kir4.2+/+ and Kir4.2−/− mice following acute furosemide treatment (p = 0.0081 for L and for 1.5 × 10⁻⁴ for (M). Renal (N) Na+ clearance (ClNa) and (O) Li+ clearance ClLi, and (P) Li+ clearance to Na+ clearance ratio (ClLi/ClNa) in Kir4.2+/+ and Kir4.2−/− mice (p = 0.047). Animals were on normal diets for all panels. N = 5 per group for (A, B, DH and NP), 9 and 8 per group for (C), and N = 10 per group for (IM). *P < 0.05 by Student’s t test. All tests were two-sided. Data presented as mean ± sem.
Fig. 4
Fig. 4. Effects of Kir4.2 deletion on kidney growth and nephron segment expansion.
A Kidney mass from Kir4.2+/+ and Kir4.2−/− mice on 0 K diet at indicated timepoints (p < 0.0001 for interaction). B Representative three-dimensional images from optically cleared Kir4.2+/+ and Kir4.2−/− kidneys stained for pNCC-T53. Animals were maintained on 0 K diet for eight days. C Quantification of DCT volume based on imaging as described in B (3.4 × 10⁻¹⁰). D Representative three-dimensional images from optically cleared Kir4.2+/+ and Kir4.2−/− kidneys stained with LTL-fluorescein and DAPI. Animals were maintained on 0 K diet for eight days. Yellow boxes indicate sections highlighted in (F). E Quantification of cortical thickness based on imaging as described in (D) (p = 2.5 × 10⁻⁴). F Representative 2-D projections from optically cleared Kir4.2+/+ and Kir4.2−/− kidneys stained with LTL-fluorescein. Yellow boxes indicate sections highlighted on the right. G Quantification of tubule thickness based on imaging as described in (F) (p = 5.8 × 10⁻⁴). In (A), N = 10 (t = 0), 5 (t = 4), and 11 (t = 8) for Kir4.2+/+ and N = 10 (t = 0), 15 (t = 4), and 14 (t = 8) for Kir4.2−/−, for (BG), N = 3 per group P < 0.05 for interaction between treatment and time variables by two-way ANOVA with repeated measures. * indicates P < 0.05 by unpaired Student’s t test. All tests were two-sided. Data presented as mean ± sem.
Fig. 5
Fig. 5. Effects of dietary K+ on AKT phosphorylation and function in the kidney.
A Representative Western blots for pan pAKT-S473 and pan total AKT from Kir4.2+/+ and Kir4.2−/− kidneys following normal K+ and 0 K dietary treatments. Quantification presented in Supplementary Fig. 5.B Representative Western blots using isoform-specific antibodies for pAKT1, total AKT1, pAKT2, and total AKT2 from mice treated as in (A). Quantification presented in Supplementary Fig. 5. C and D Representative immunofluorescence imaging showing colocalization of AKT and the PT marker LTL in mice maintained on a normal diet. Arrows indicate punctate staining of AKT. Urinary Na+ and K+ excretion following treatment with either vehicle (Veh) or MK-2206 in wild-type animals on either (E) normal K+ (NK, p = 0.046 and 0.014) diet or (F) 0 K diet (p = 0.0059 and 0.0079). G Diuretic response (p = 0.0092) and (H) the urine Na-to-K ratio following to the same treatments as in (D). MK-2206-induced (I) urine Na+ and (J) K+ response in Kir4.2+/+ and Kir4.2−/− animals (p = 0.048). Each data point presented for (I) and (J) is the difference between MK-2206- and vehicle-induced electrolyte excretion for each animal. K Kidney weights from normal K-fed (NK) mice, 0K-fed (0 K) mice, and 0K-fed mice that were also treated with MK-2206 (0 K + MK) for four days (p = 0.046). N = 5 per group for all in (A, C), N = 3 per group for (B), N = 6 per group for (E), and N = 4 for Veh and 5 for MK-2206 for (F). In (G), N = 6, 6, 4 and 5. In (H), N = 5, 6, 4, and 5. N = 3 for Kir4.2+/+ and 4 for Kir4.2−/− in (I) and (J). For (K), N = 5, 8, and 8 respectively. * indicates p < 0.05 by unpaired Student’s t test. # indicates P < 0.05 by one-way ANOVA followed by Dunnett’s post-hoc test. Scale bars = 20 μM. All tests were two-sided. Data presented as mean ± sem.
Fig. 6
Fig. 6. Kir4.2 deletion reduces abundance of phosphorylated mTOR targets and PT Na+ transporters following 0 K feeding.
A Representative immunofluorescence staining for LTL and mTOR along the proximal tubule. B Representative Western blots for total mTOR and pmTOR-S2448 from Kir4.2+/+ and Kir4.2−/− mice treated with 0 K. Quantification shown in Supplementary Fig. 4.C Representative Western blots for pP70S6 kinase-T389, pS6RP-S235/236, pEIG4G-S1108, and (D) pNDRG1-T346 from Kir4.2+/+ and Kir4.2−/− mice treated with 0 K. Loading control for (C) is same as in (B). Quantification shown in Supplementary Fig. 4.E Representative Western blots for NBCe1 and NHE3, from Kir4.2+/+ and Kir4.2−/− mice treated with 0 K. Quantification shown in Supplementary Fig. 7.F Urine ammonia excretion from Kir4.2+/+ and Kir4.2−/− mice treated with 0 K. 0 K treatment was given for 8 days for (BF). For (A), N = 5 per group. For (B, C, E), N = 4 for Kir4.2+/+ and 5 for Kir4.2−/−. Panel (D) is a representative image from N = 10 and 12. For (F) N = 13 and 12. * indicates P < 0.05 by unpaired Student’s t test. Scale bar = 20 μM. All tests were two-sided. Data presented as mean ± sem.
Fig. 7
Fig. 7. Effects of extracellular K+ reductions on isolated tubule suspensions.
A Western blots from isolated tubule suspensions cultured for 30 min in either 6 mM or 0 mM K+ conditions (p = 8.5 × 10⁻⁴). B Representative Western blots from isolated tubule suspensions cultured for 30 min in indicated K+ concentrations (p = 0.008 for nonzero slope). C Representative Western blots from isolated tubule suspensions cultured for 30 min in indicated K+ concentrations with or without the mTORC2 inhibitor AZD8055 (10 μM) (p = 0.019 and <0.0001). D Representative Western blots from isolated tubule suspensions cultured for 30 min in indicated K+ concentrations with or without the AKT inhibitor MK2206 (10 μM) (p = 0.0069 and <0.0001 for pAKT, p = 0.044 and 0.0001 for pTSC2, p = 0.043 and 0.0092 for pmTOR, p < 0.0001 and p < 0.0001 for pP70S6K, p = 0.0078 and 0.013 for pS6, and p = 0.02 and <0.0001 for pNDRG1). E Representative Western blots from isolated tubule suspensions cultured for 30 min in indicated K+ concentrations with medium supplemented with either mannitol (30 mM) or BaCl2 (10 mM) (p = 0.015 and 0.0004). F Representative Western blots from isolated tubule suspensions cultured for 30 min in 4 mM K+ at indicated pH. G Representative Western blots from isolated tubule suspensions cultured for 30 min in 4 mM K+ and pH 7.4 at indicated HCO3 concentrations. H Representative Western blots from isolated tubule suspensions cultured for 30 min in 4 mM K+ at indicated Cl- concentrations (p = 0.0009 for nonzero slope). I Representative Western blots from isolated tubule suspensions cultured for 30 min in indicated K+ and Cl- concentrations (p = 0.043 for nonzero slope). J Representative Western blots from isolated tubule suspensions cultured for 30 min in indicated K+ concentrations and either DMSO, DCPIB (10 μM), or DIDS (100 μM) (p = 0.036 and 0.0001). N = 3 per group for (A, FI), 4 per group for (C, E), 4 per group for (D) except pmTOR for which N = 8, and 6 per group for (J). * indicates P < 0.05 by unpaired Student’s t test. # indicates P < 0.05 by one-way ANOVA followed by Tukey’s (CE) or Dunnett’s (I, J) post-hoc test. † indicates P < 0.05 for slope being significantly different than 0. In I, post-hoc comparisons are made between the indicated group and the 10 mM K+, 110 mM Cl- group, the abundance of which is indicated by a dotted line and SEM indicated by the shaded gray area. All tests were two-sided. Data presented as mean ± sem.
Fig. 8
Fig. 8. Effects of extracellular hypertonicity on isolated tubule suspensions.
A Representative Western blots from isolated tubule suspensions cultured for 30 min in either 0 or 50 mM mannitol at indicated K+ concentrations. B Representative Western blots from isolated tubule suspensions cultured for 30 min at 50 mM concentrations of indicated solute. * indicates P < 0.05 by one-way ANOVA followed by Tukey’s post-hoc test. N = 4 per group in A and 3 per group in (B). All tests were two-sided. Data presented as mean ± sem.
Fig. 9
Fig. 9. Model depicting effects of reduced extracellular K+ on PT cell physiology.
Reduced blood K+ along the basolateral membrane leads to K+ efflux via Kir4.2, which reduces membrane voltage (Vm). This promotes Cl- efflux through VRAC, decreased intracellular Cl- concentration [Cl-], and activates mTORC2 to phosphorylate AKT. This has broad effects on cell physiology including increasing transcription/translation, Na+ reabsorption, and PT expansion. Figure 9 created with BioRender.com released under a Creative Commons Attribution-NonCommercial-NoDerivs 4.0 International license https://creativecommons.org/licenses/by-nc-nd/4.0/deed.en.

References

    1. Tolins JP, Hostetter MK, Hostetter TH. Hypokalemic nephropathy in the rat. Role of ammonia in chronic tubular injury. J. Clin. Invest. 1987;79:1447–1458. doi: 10.1172/JCI112973. - DOI - PMC - PubMed
    1. Tannen RL. Relationship of renal ammonia production and potassium homeostasis. Kidney Int. 1977;11:453–465. doi: 10.1038/ki.1977.63. - DOI - PubMed
    1. Kamm DE, Strope GL. Glutamine and glutamate metabolism in renal cortex from potassium-depleted rats. Am. J. Physiol. 1973;224:1241–1248. doi: 10.1152/ajplegacy.1973.224.6.1241. - DOI - PubMed
    1. Boyd-Shiwarski CR, et al. Effects of extreme potassium stress on blood pressure and renal tubular sodium transport. Am. J. Physiol. Renal Physiol. 2020;318:F1341–F1356. doi: 10.1152/ajprenal.00527.2019. - DOI - PMC - PubMed
    1. Cuevas CA, et al. Potassium sensing by renal distal tubules requires Kir4.1. J. Am. Soc. Nephrol. 2017;28:1814–1825. doi: 10.1681/ASN.2016090935. - DOI - PMC - PubMed

MeSH terms