. 2024 Jun 17;15(6):420.
doi: 10.1038/s41419-024-06813-4.

The Mohawk homeobox gene represents a marker and osteo-inhibitory factor in calvarial suture osteoprogenitor cells

Affiliations

The Mohawk homeobox gene represents a marker and osteo-inhibitory factor in calvarial suture osteoprogenitor cells

Yiyun Wang et al. Cell Death Dis. .

Abstract

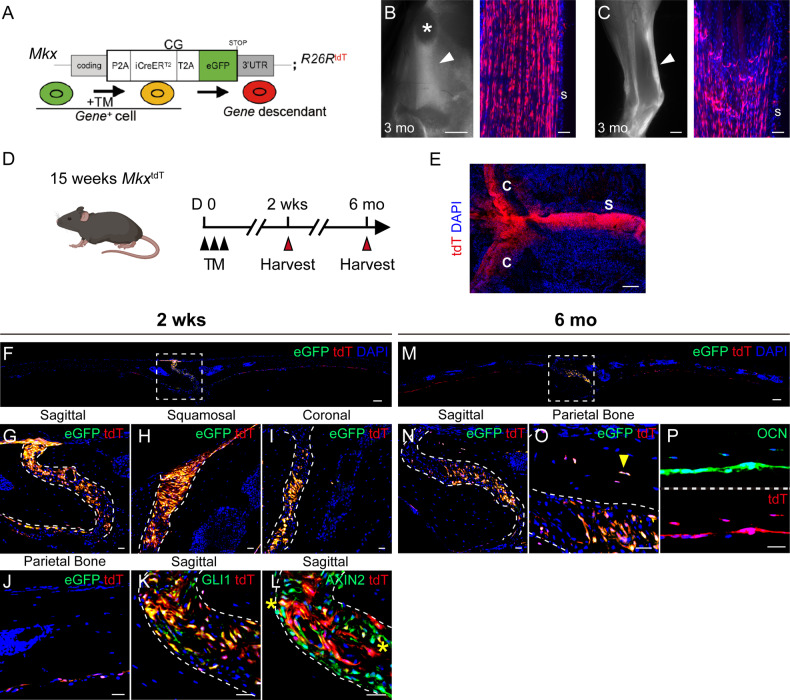
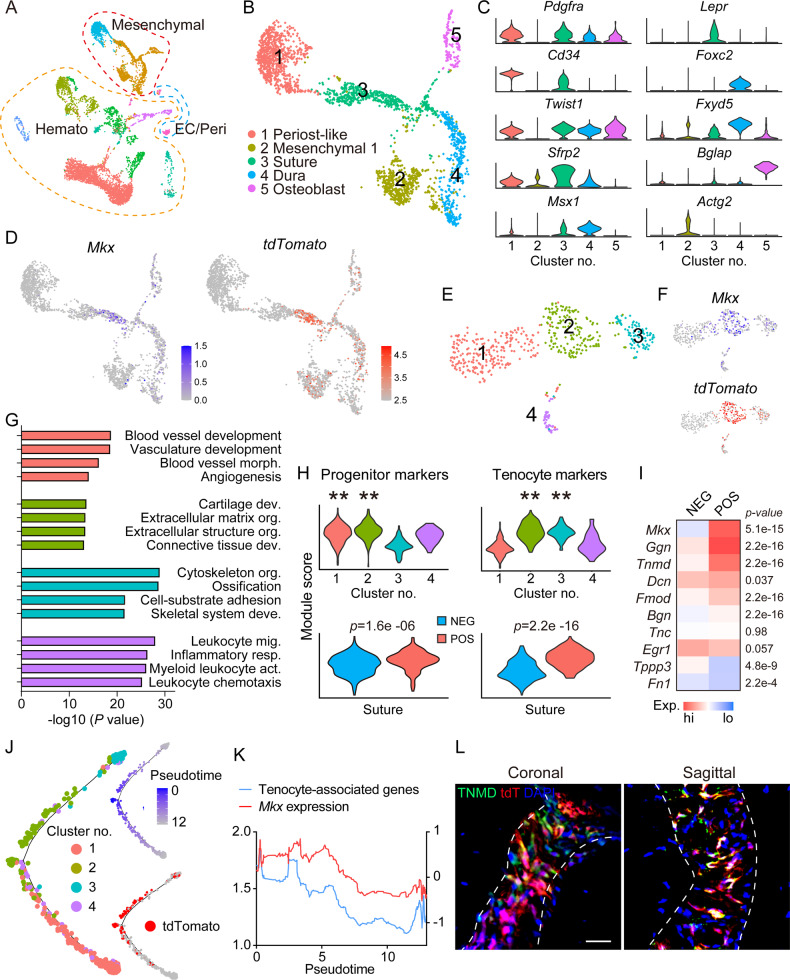
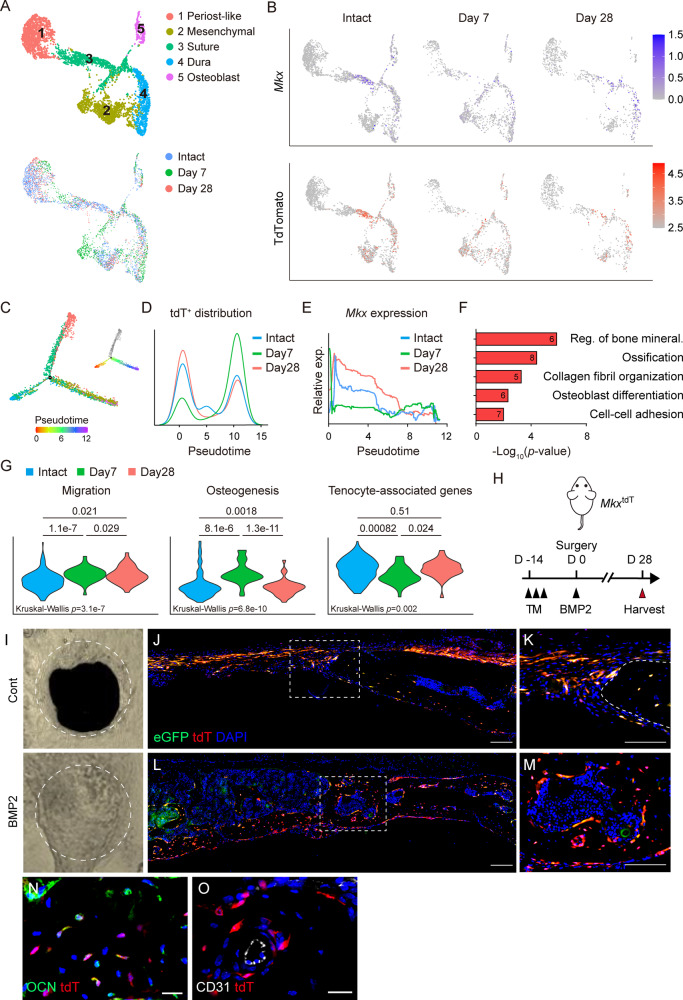
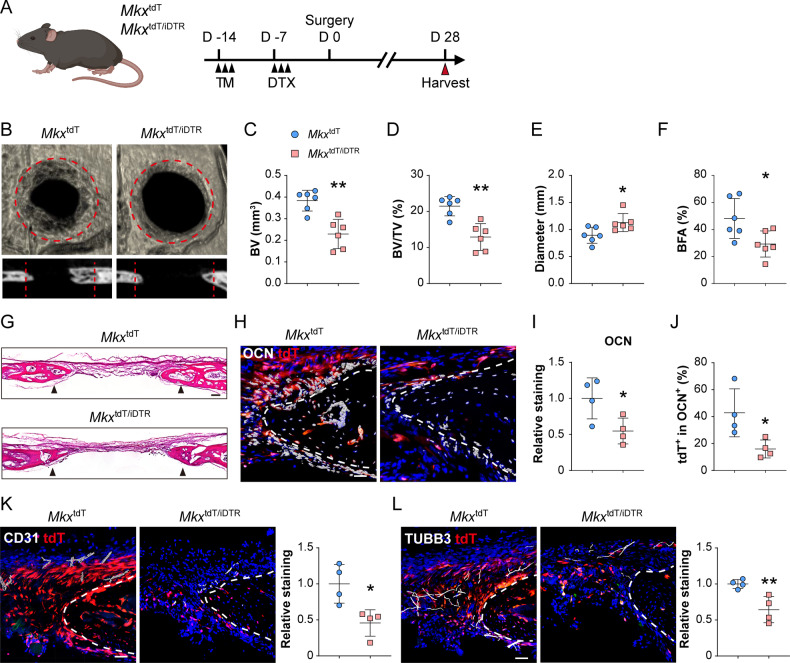
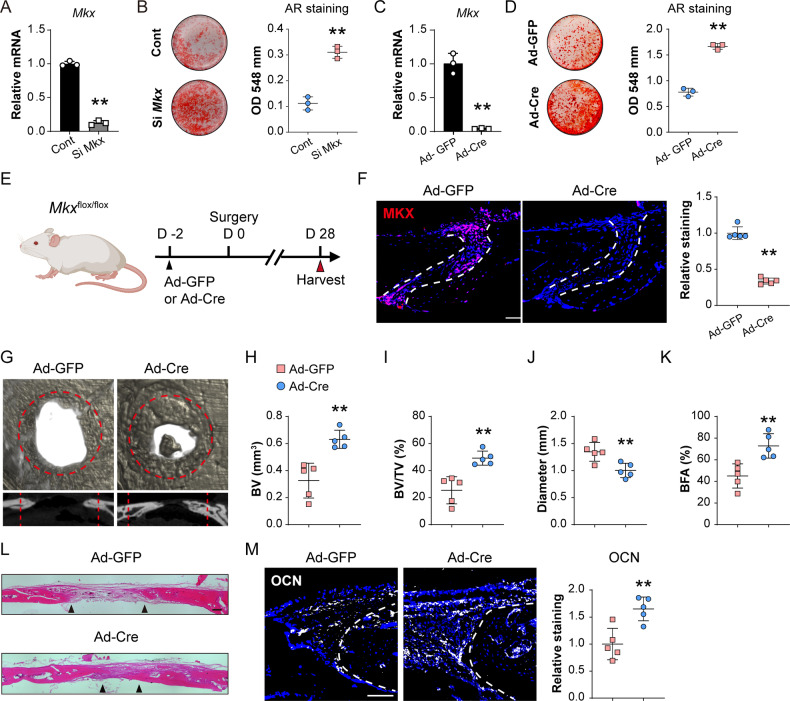
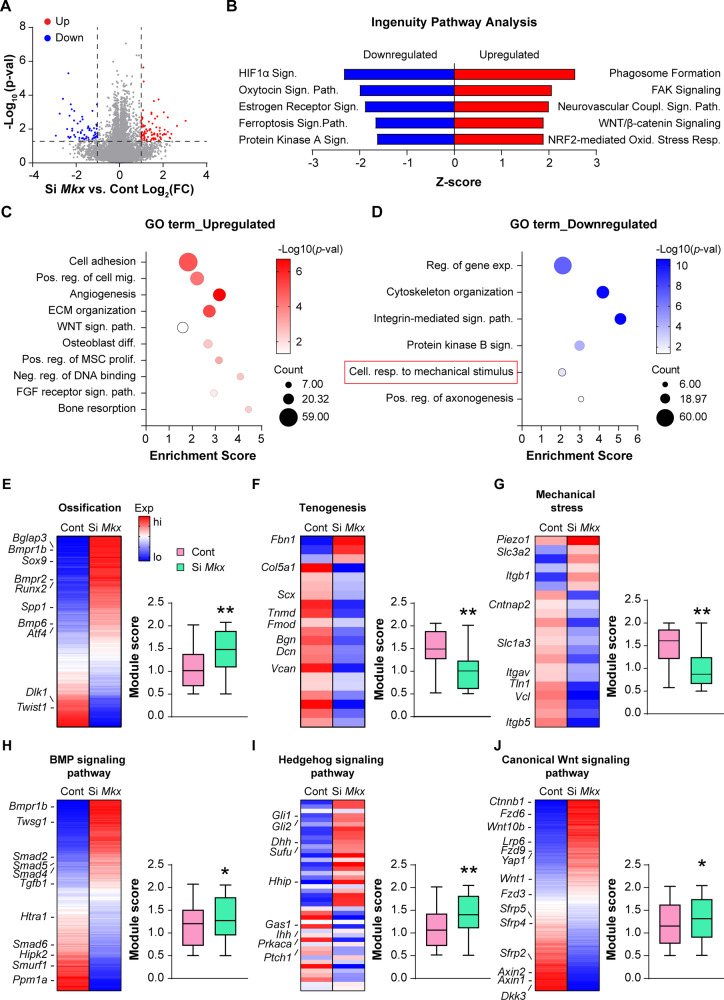
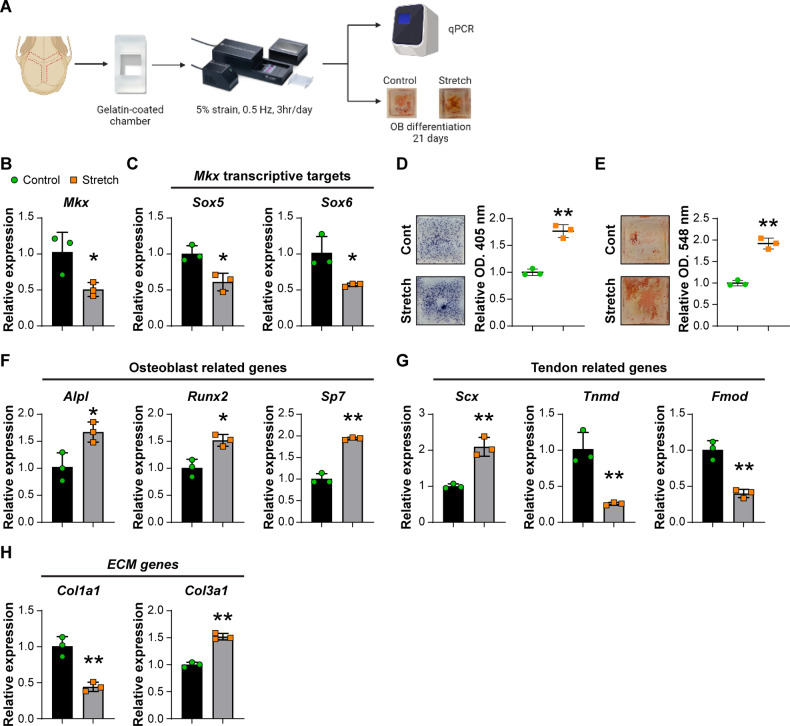
The regeneration of the mammalian skeleton's craniofacial bones necessitates the action of intrinsic and extrinsic inductive factors from multiple cell types, which function hierarchically and temporally to control the differentiation of osteogenic progenitors. Single-cell transcriptomics of developing mouse calvarial suture recently identified a suture mesenchymal progenitor population with previously unappreciated tendon- or ligament-associated gene expression profile. Here, we developed a Mohawk homeobox (MkxCG; R26RtdT) reporter mouse and demonstrated that this reporter identifies an adult calvarial suture resident cell population that gives rise to calvarial osteoblasts and osteocytes during homeostatic conditions. Single-cell RNA sequencing (scRNA-Seq) data reveal that Mkx+ suture cells display a progenitor-like phenotype with expression of teno-ligamentous genes. Bone injury with Mkx+ cell ablation showed delayed bone healing. Remarkably, Mkx gene played a critical role as an osteo-inhibitory factor in calvarial suture cells, as knockdown or knockout resulted in increased osteogenic differentiation. Localized deletion of Mkx in vivo also resulted in robustly increased calvarial defect repair. We further showed that mechanical stretch dynamically regulates Mkx expression, in turn regulating calvarial cell osteogenesis. Together, we define Mkx+ cells within the suture mesenchyme as a progenitor population for adult craniofacial bone repair, and Mkx acts as a mechanoresponsive gene to prevent osteogenic differentiation within the stem cell niche.


Conflict of interest statement

AWJ is a paid consultant for Novadip and Lifesprout LLC. D-HK is a scientific founder and equity holder of Curi Bio Inc. This arrangement has been reviewed and approved by the Johns Hopkins University in accordance with its conflict-of-interest policies. All other authors declare no potential competing interest.

Figures

Fig. 1
Fig. 1. Mkx+ cells populate the calvarial suture mesenchyme and contribute to calvarial bone turnover.
A Diagrams of the MkxCG driver. Mkx-expressing cells are labeled with GFP. Following tamoxifen (TM) administration, Mkx-expressing cells will be permanently labeled with TdTomato (tdT). B Whole-mount fluorescent image (left) and histology of tdT reporter activity (right) in patellar tendon of a 3-month old MkxCG;RtdT mice post TM injection. Arrowhead: patellar tendon. s: tendon sheath. Asterisk: patella. GFP not shown. C Whole-mount fluorescent image (left) and histology of tdT reporter activity (right) in Achilles tendon of a 3-month old MkxCG;R26RtdT (denoted as MkxtdT) mice post TM injection. Arrowhead: Achilles tendon. s: tendon sheath. GFP not shown. D Schematic of TM administration in 15 weeks-old mice, with sample collection at 2 wks and 6 mo. E Top-down whole-mount image of calvarial bones 2 wks after TM injection. C: coronal suture and S: sagittal suture. GFP not shown. FJ Representative images of Mkx reporter activity within F tile scan of parietal bone, G sagittal suture, H squamosal suture, I coronal suture, and J Dura at 2 weeks after TM administration. K, L Colocalization of Mkx reporter activity with K GLI1 and L AXIN2 immunostaining. Reporter activity appears red, immunoreactivity appears green, and colocalization appears yellow (indicated with asterisk). GFP reporter activity not shown. MP Representative images of Mkx reporter activity within M Tile scan of parietal bone, N sagittal suture, and O suture adjacent osteocytes at 6 months after TM administration. Yellow arrowheads indicate reporter positive osteocyte. P OCN immunostaining and Mkx reporter activity at 6 months after TM administration. GFP reporter activity not shown. n = 4 mice per time point. Scale bars length: B, C (left): 1000 μm. F, M: 100 μm. B, C (right), GL and NP: 20 μm.
Fig. 2
Fig. 2. Single-cell RNA sequencing of the intact calvaria within Mkx reporter animals.
MkxtdT animals (male and female, 8-week old, n = 3) were administered TM for three consecutive days, and subjected to sacrifice after 5 days from the last dosage. The frontal and parietal bone including coronal and sagittal sutures was micro-dissected, dissociated, and subjected to scRNA-seq. A Uniform Manifold Approximation and Projection (UMAP) plot of total cells isolated from intact calvaria. Hemato hematopoietic cell, EC endothelial cell, Peri pericyte. B UMAP of mesenchymal lineage cells. C Violin plots of marker gene expression for subclusters. D UMAP plot of Mkx expression and tdTomato reporter activity. E UMAP plot of subclusters of suture cells only. F UMAP plot of Mkx expression and tdTomato reporter activity across subclusters. G Selected GO terms and KEGG pathways enriched in each subcluster. H Module score of progenitor cell markers and tenocyte markers across 4 subclusters (top) and in Mkx and Mkx+ cells from all subclusters (bottom). The tdTomato expression >2.5 was considered as Mkx positive. I Heatmap showing selected tenocyte-associated genes among tdT and tdT+ cells in suture cells. J Trajectory analyses of cell clusters showing the distribution of identified 4 subclusters and pseudotemporal cell ordering along tdTomato trajectories. K Tenocyte-associated genes and Mkx gene expression over pseudotime. L Immunostaining of TNMD and tdTomato reporter activity in coronal and sagittal suture (n = 4). GFP reporter activity not shown. Scale bar: 20 μm.
Fig. 3
Fig. 3. Mkx+ cells contribute to calvarial bone repair.
AH Single-cell RNA sequencing of calvarial defects within MkxtdT reporter mice in relation to intact calvaria. A UMAP plot of cell clusters all time points (top) and across time points after defect creation (bottom). N = 3 mice/time point. Intact: 8321 cells (data also shown in Fig. 2), Day 7: 6699 cells, Day 28: 7065 cells. B UMAP plot of Mkx gene expression (top) and tdTomato reporter activity (bottom) across time. C Pseudotemporal cell ordering along differentiation trajectories. Pseudotime is depicted from red to purple. The tdT negative state (appearing in gray) was not included for downstream analyses. D MkxtdT cell distribution over pseudotime. E Mkx gene expression over pseudotime. F GO terms enriched in MkxtdT cells on day 7. G Module score of cell migration, osteogenesis, and tenocyte-associated genes in MkxtdT cells across time points. A Kruskal–Wallis test with Dunn’s multiple comparison was used to determine differences between groups. H Schematic for calvarial bone defect with or without BMP2 treatment in MkxtdT reporter mice. I μCT reconstructions of the defect area without or with BMP2 treatment. The margins of original defect are indicated by dashed white. JM Representative tile scans and high-magnification images of Mkx reporter activity in the calvarial defect site J, K without or L, M with BMP2 treatment at 28 d post-defect. Reporter activity appears red and green, nuclear counterstain appears blue. Dashed white lines at high-magnification images indicate healing bone edge. Scale bar: 100 μm (J, L) or 20 μm (K, M). N Osteocalcin (OCN) immunostaining and O CD31 immunostaining within the healing area on day 28 after defect. GFP reporter activity not shown in (M, O). Scale bar: 20 μm. n = 3 for (IO).
Fig. 4
Fig. 4. Mkx+ cell ablation leads to compromised defect repair.
A Schematic for calvarial bone defect. MkxtdT or MkxtdT/iDTR mice were administered TM followed by local diphtheria toxin (DTX) overlying the skull, and then subjected to full-thickness frontal bone defects. Samples were harvested at day 28 post-defect. B μCT reconstructions of the defect site in a top-down view (above) and sagittal cross-sectional images (below). Margins of original defect are indicated by dashed red lines. CG μCT quantification of bone healing among MkxtdT and MkxtdT/iDTR mice, including C bone volume (BV), D bone volume/tissue volume (BV/TV), E residual defect diameter, and F bone fractional area (BFA). G Hematoxylin and eosin (H&E) staining of coronal cross sections of the healing defect site from MkxtdT or MkxtdT/iDTR mice, d 28 after defect. Black arrowheads indicate original defect sites. Scale bar: 100 μm. HJ Immunostaining of OCN at the defect edge (H) and quantification of OCN (I) and percentage of MkxtdT cells among OCN+ cells within the defect site (J). GFP reporter activity not shown. K Immunostaining of CD31+ blood vessels at the defect edge from MkxtdT and MkxtdT/iDTR mice (left) and quantification (right). L Immunostaining of TUBB3+ (Beta III tubulin) nerve fibers at the defect edge from MkxtdT and MkxtdT/iDTR mice (left) and quantification (right). White dashed lines indicate healing bone edges. Scale bar: 100 μm. Dots in scatterplots represent values from individual measurement, whereas mean and 1 SD are indicated by crosshairs and whiskers. Relative staining: individual value was normalized to mean fluorescence intensity of control group (MkxtdT). *p < 0.05; ** p < 0.01. A two-tailed Student t-test was used for all comparisons.
Fig. 5
Fig. 5. Mkx gene knockdown or knockout induces osteogenic differentiation and calvarial bone repair.
A, B siRNA mediated knockdown of Mkx within calvarial suture cells. A Confirmation of siRNA mediated Mkx knockdown efficiency by qPCR, 48 h after siRNA treatment. B Representative Alizarin red staining at d 10 of osteogenic differentiation (left) and quantification (right). C, D Ad-Cre mediated knockout of Mkx within Mkxfl/fl calvarial suture cells. C Confirmation of Ad-Cre mediated Mkx knockout efficiency by qPCR, 48 h after Ad-Cre treatment. D Representative Alizarin red staining at d 10 of osteogenic differentiation (left) and quantification (right). E Schematic of calvarial bone defect. Mkxflox mice were locally administered Ad-Cre or Ad-GFP directly overlying the skull, and thereafter subjected to calvarial defect creation. Samples were harvested at d 28 post-defect. F Mkx gene knockout efficiency tested by immunostaining (left) and quantification (right) within the sagittal suture of Mkxflox mice 28 d after viral injection. G μCT reconstructions of the defect site in a top-down view (above) and sagittal cross-sectional images (below). Analysis performed at d 28 post-defect. Margins of original defect are indicated by dashed red lines. HK μCT quantification of bone healing among control and Ad-Cre treated mice, including H bone volume (BV), I bone volume/tissue volume (BV/TV), J residual defect diameter, and K bone fractional area (BFA). L H&E staining of coronal cross section of the healing defect site from control and Ad-Cre treated mice, d 28 after defect. Black arrowheads indicate healing bone edges. Scale bar: 100 μm. M Immunostaining of OCN at the defect edge (left) and quantification of OCN (right). Dots in scatterplots represent values from individual measurement, whereas mean and 1 SD are indicated by crosshairs and whiskers. *p < 0.05; **p < 0.01. A two-tailed Student t-test was used for all comparisons.
Fig. 6
Fig. 6. Total RNA sequencing reveals signaling alterations after Mkx knockdown in calvarial suture cells.
A Volcano plot summarizing differentially expressed genes (DEGs) (FDR < 0.05). DEGs with fold change (Log2FC) over 1 and p-value less than 0.05 were colored red or blue. Red dots are significantly upregulated DEGs after Mkx KD, while blue dots are significantly downregulated DEGs in comparison to scramble control. N = 3 biological replicates. B Ingenuity Pathway Analysis (IPA) showing top canonical pathways upregulated and downregulate among Mkx KD cells in comparison to control. C, D Bubble plot showing GO enrichment analysis identified representative pathways that were upregulated (C) or downregulated (D) among Mkx KD cells. EJ Heatmaps and corresponding module scores among Mkx KD cells versus control in key biological processes and signaling pathways, including E Ossification, F Tenogenesis, G Mechanical stress, H BMP signaling, I Hedgehog signaling, and J Canonical Wnt signaling. Gene module scores are shown as a boxplot with center line as the median, box limits as upper and lower quartiles of the modulus score. *p < 0.05; **p < 0.01. A two-tailed Student t-test was used for all comparisons.
Fig. 7
Fig. 7. Mechanical loading of calvarial suture cells.
A Schematic of the mechanical loading experiment. Calvarial suture cells from male 8-week-old C57BL/6J mice were seeded into gelatin-coated chambers and loaded with 5% stain at 0.5 Hz, 2 h per d for 3 d using the Cytostretcher system. Control cells were seeded in identical chambers but not subjected to biaxial strain. Gene expression was examined by qPCR 1 h after stretching or osteoblast differentiation for up to 21 d. B Mkx expression after mechanical loading by qPCR. C Expression of Mkx target genes, Sox5 and Sox6 by qPCR. D Representative images of ALP staining at 7 d (left) and statistical analysis of the staining intensity (right). E Representative images of alizarin red staining at 21 d (left) and quantitative analysis of staining (right). F Osteoblast-related genes by qPCR. G Expression of tendon-related genes by qPCR. H Expression of extracellular matrix (ECM) genes by qPCR. B, C, and FH, data shown as mean ± 1 SD, with dots representing individual data points. D and E, individual dots in scatterplots represent values from single measurements, whereas mean and one SD are indicated by crosshairs and whiskers. All experiments were performed in triplicate replicates, with results from a single replicate shown. *p < 0.05; **p < 0.01. A two-tailed Student t-test was used for all comparisons.

References

    1. Li B, Wang Y, Fan Y, Ouchi T, Zhao Z, Li L. Cranial suture mesenchymal stem cells: insights and advances. Biomolecules. 2021;11:1129.. doi: 10.3390/biom11081129. - DOI - PMC - PubMed
    1. Ikegame M, Ejiri S, Okamura H. Expression of non-collagenous bone matrix proteins in osteoblasts stimulated by mechanical stretching in the cranial suture of neonatal mice. J Histochem Cytochem. 2019;67:107–16. doi: 10.1369/0022155418793588. - DOI - PMC - PubMed
    1. Ikegame M, Tabuchi Y, Furusawa Y, Kawai M, Hattori A, Kondo T, et al. Tensile stress stimulates the expression of osteogenic cytokines/growth factors and matricellular proteins in the mouse cranial suture at the site of osteoblast differentiation. Biomed Res. 2016;37:117–26. doi: 10.2220/biomedres.37.117. - DOI - PubMed
    1. Zhao H, Feng J, Ho TV, Grimes W, Urata M, Chai Y. The suture provides a niche for mesenchymal stem cells of craniofacial bones. Nat Cell Biol. 2015;17:386–96. doi: 10.1038/ncb3139. - DOI - PMC - PubMed
    1. Wilk K, Yeh SA, Mortensen LJ, Ghaffarigarakani S, Lombardo CM, Bassir SH, et al. Postnatal calvarial skeletal stem cells expressing PRX1 reside exclusively in the calvarial sutures and are required for bone regeneration. Stem Cell Rep. 2017;8:933–46. doi: 10.1016/j.stemcr.2017.03.002. - DOI - PMC - PubMed

Publication types

Associated data