. 2024 Jun 18;14(1):13992.
doi: 10.1038/s41598-024-64628-x.

Adiposity in mares induces insulin dysregulation and mitochondrial dysfunction which can be mitigated by nutritional intervention

Affiliations

Adiposity in mares induces insulin dysregulation and mitochondrial dysfunction which can be mitigated by nutritional intervention

Kyle Fresa et al. Sci Rep. .

Abstract

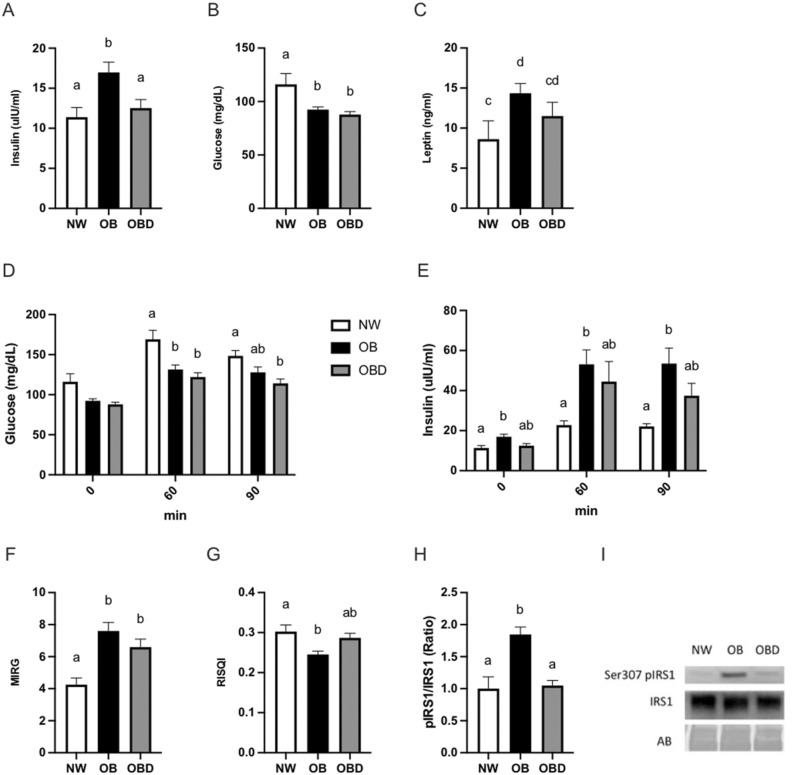
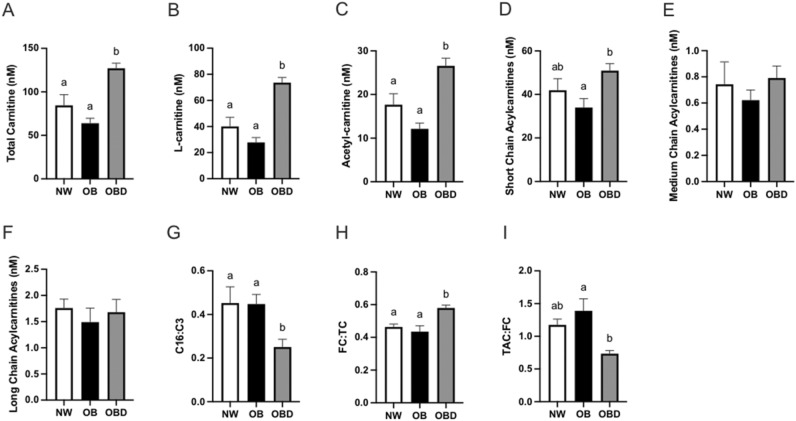
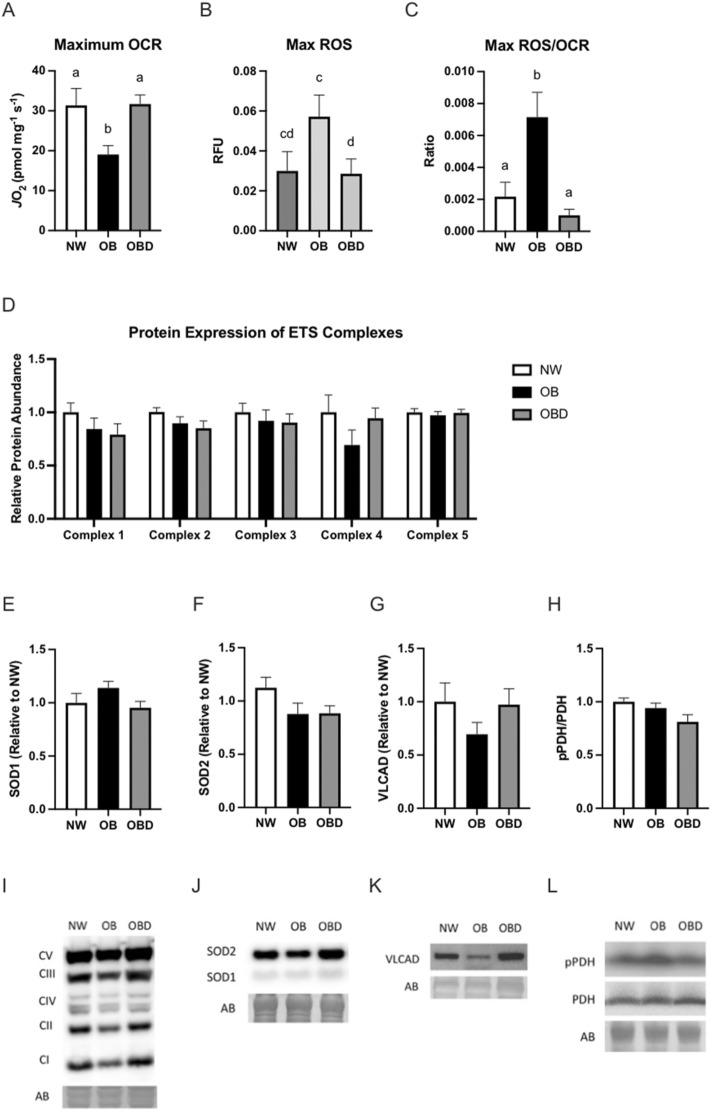
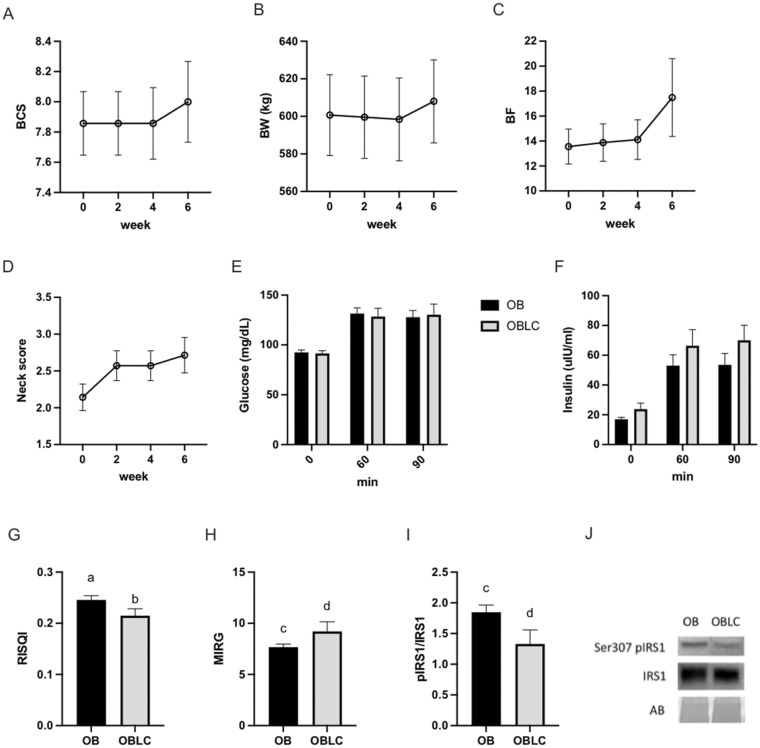
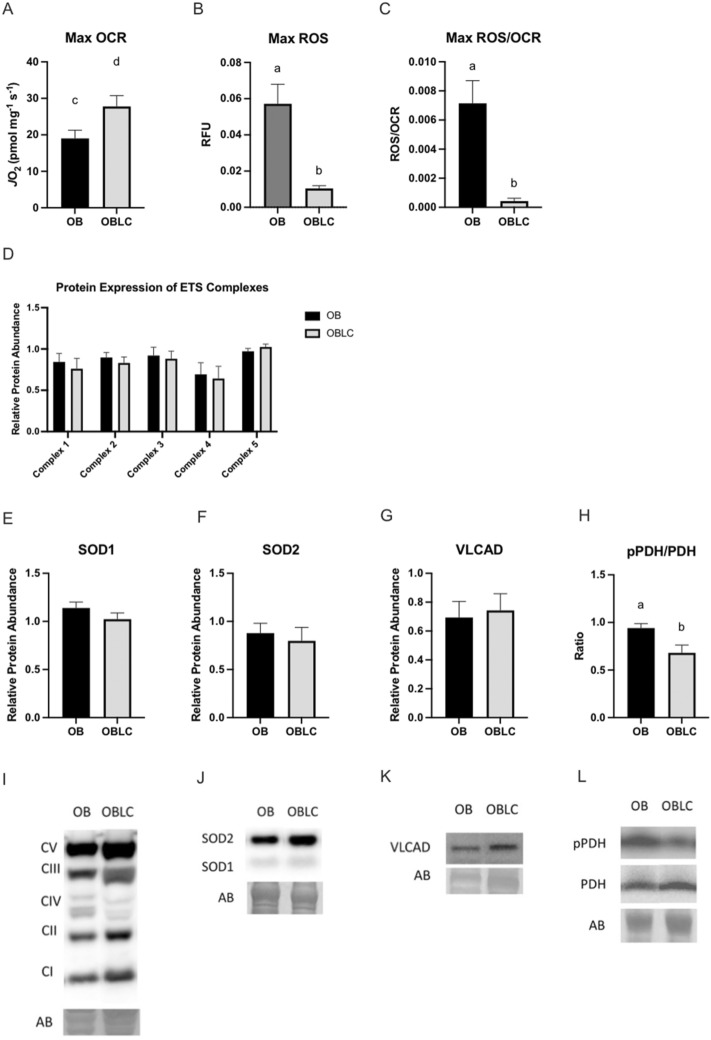
Obesity is a complex disease associated with augmented risk of metabolic disorder development and cellular dysfunction in various species. The goal of the present study was to investigate the impacts of obesity on the metabolic health of old mares as well as test the ability of diet supplementation with either a complex blend of nutrients designed to improve equine metabolism and gastrointestinal health or L-carnitine alone to mitigate negative effects of obesity. Mares (n = 19, 17.9 ± 3.7 years) were placed into one of three group: normal-weight (NW, n = 6), obese (OB, n = 7) or obese fed a complex diet supplement for 12 weeks (OBD, n = 6). After 12 weeks and completion of sample collections, OB mares received L-carnitine alone for an additional 6 weeks. Obesity in mares was significantly associated with insulin dysregulation, reduced muscle mitochondrial function, and decreased skeletal muscle oxidative capacity with greater ROS production when compared to NW. Obese mares fed the complex diet supplement had better insulin sensivity, greater cell lipid metabolism, and higher muscle oxidative capacity with reduced ROS production than OB. L-carnitine supplementation alone did not significantly alter insulin signaling, but improved lipid metabolism and muscle oxidative capacity with reduced ROS. In conclusion, obesity is associated with insulin dysregulation and altered skeletal muscle metabolism in older mares. However, dietary interventions are an effective strategy to improve metabolic status and skeletal muscle mitochondrial function in older mares.

Keywords: Equine; Insulin dysregulation; Metabolism; Mitochondrial dysfunction; Muscle; Obesity; Systemic.


Conflict of interest statement

The authors declare no competing interests.

Figures

Figure 1
Figure 1
Morphometric and metabolic classification of mares. Morphometric measurements from normal-weight (NW), obese (OB) and obese diet supplemented (OBD) mares performed at week 12 of diet prior to sampling for (a) body condition score, (b) percentage of body fat calculated using a tailhead fat measurement (c), cresty neck score, (d) and body weight; ab superscripts indicate differences at p < 0.05. Bars represent mean ± SEM.
Figure 2
Figure 2
Metabolic hormone signaling and circulating metabolites. At 12 weeks of diet supplementation, normal-weight (NW), obese (OB) and obese diet supplemented (OBD) mares were fasted overnight before blood collection and analysis of basal concentrations of (a) insulin, (b) glucose, and (c) leptin; (de) glucose and insulin concentrations response within group after oral administration light corn syrup for an oral sugar test at 0 (basal), 60 and 90 min; Proxies, including (f) modified insulin to glucose ratio (MIRG) and (g) reciprocal of the square root of insulin (RISQI), used to quantify pancreatic response to glucose and insulin sensitivity, respectively; (h) ratio of phosphorylated IRS-1 to total IRS-1 in skeletal muscle; (i) Representative western blot for phosphorylation of IRS-1 to total IRS-1; ab Superscripts indicate differences at p < 0.05. cd Superscripts indicate differences at p = 0.08. Bars represent mean ± SEM.
Figure 3
Figure 3
Fatty acid uptake and integration. Samples were collected after 12 weeks on diets for mares grouped into normal-weight (NW), obese (OB) and obese diet supplemented (OBD) after overnight fasting. Circulating (a) non-esterified fatty acids (NEFA) and (b) triglycerides were measured in plasma; Percentages of (c) saturated fatty acids, (d) omega-3 polyunsaturated fatty acids (PUFA), (e) omega-6 PUFA, and (f) EPA + DHA to total fatty acids were measured in red blood cell membranes. ab Superscripts indicate differences at p < 0.05 within time point. cd Superscripts indicate tendency at p < 0.09 within time points. *,** Asterisks indicate differences at p < 0.05 among months within individual groups. Bars represent mean ± SEM.
Figure 4
Figure 4
Acylcarnitine profiles. Serum acylcarnitine profiles were assessed 12 weeks after mares were placed on diets to maintain normal body weight (NW), obesity (OB) or obese diet supplemented (OBD). Serum samples were incubated and processed with an internal standard of known concentrations of acylcarnitines and analyzed using liquid chromatography mass spectrometry to determine concentrations of (a) total carnitine, (b) L-carnitine, (c) total acetyl carnitines, (d) short chain acylcarnitines, (e) medium chain acylcarnitines, and (f) long chain acylcarnitines; ratio of (g) C16:C3 which approximates completeness of β-oxidation, with lower values representing increased lipid metabolism efficiency; and ratios of (h) free carnitine to total carnitines (FC:TC) or (i) or total acetyl carnitines to free carnitine (TAC:FC) which represent carnitine availability. ab Superscripts indicate differences at p < 0.05. Bars represent mean ± SEM.
Figure 5
Figure 5
Skeletal muscle mitochondrial function. High-resolution respirometry and immunoblotting for selected protein expression was performed in skeletal muscle tissue collected 12 weeks after normal weight (NW), obese (OB) or obese diet supplemented (OBD). Skeletal muscle was obtained by biopsy of the semitendinosus muscle before being permeabilized and analyzed using an Oroboros O2K high-resolution respirometer for (a) mitochondrial oxidative capacity in the presence of metabolic substrates, (b) reactive oxygen species production, and (c) reactive oxygen species production relative to oxidative capacity. Muscle was used for immunoblotting of (d) electron transport system complexes I-V, (e, f) superoxide dismutase isoforms, (g) very long chain acyl-CoA dehydrogenase, and (h) phosphorylation of pyruvate dehydrogenase relative to NW. Representative western blots for (i) electron transport system complexes, (j) superoxide dismutase isoforms, (k) very long chain acyl-CoA dehydrogenase, and (l) phosphorylation of pyruvate dehydrogenase; ab Superscripts indicate differences at p < 0.05. Bars represent mean ± SEM.
Figure 6
Figure 6
Morphometric and metabolic classification of mares during L-carnitine supplementation. Morphometric measurements and assessments of insulin dysfunction were taken at 2-week intervals before and during L-carnitine supplementation to obese mares including (a) body condition score (BCS), (b) body weight (BW), (c) percentage of body fat (BF) calculated using a tailhead fat measurement, (d) and cresty neck score (NS). Glucose (e) and insulin (f) concentrations response within group after oral administration light corn syrup for an oral sugar test at 0 (basal), 60- and 90-min. Proxies, including (g) reciprocal of the square root of insulin (RISQI) and (h) modified insulin to glucose ratio (MIRG), used to quantify insulin sensitivity and pancreatic response to glucose, respectively; (i) Ratio of phosphorylated IRS-1 to total IRS-1 in skeletal muscle; (j) Representative western blot for phosphorylation of IRS-1 to total IRS-1; ab Superscripts indicate differences at p < 0.05. cd Superscripts indicate differences at p < 0.1. Graphs represent mean ± SEM.
Figure 7
Figure 7
Acylcarnitine profile summary following 6 weeks of L-Carnitine. Serum samples were incubated and processed with an internal standard of known concentrations of acylcarnitines and analyzed using liquid chromatography mass spectrometry for obese mares before (OB) and after (OBLC) 6 weeks of L-carnitine supplementation for (a) total carnitine, (b) L-carnitine, and (c) total acetyl carnitines including (d) short chain, (e) medium chain, and (f) long chain. The ratio of (g) C16:C3 ratio was used to approximate completeness of β-oxidation as a measure of lipid metabolism efficiency, and ratios of (h) free carnitine to total carnitines or (i) total acetyl carnitines to free carnitine were used to compare carnitine availability. ab Superscripts indicate differences at p < 0.05. Graphs represent mean ± SEM.
Figure 8
Figure 8
Skeletal muscle mitochondrial function. High-resolution respirometry and immunoblotting for selected protein expression was performed in skeletal muscle from obese mares before (OB) and after 6 weeks of dietary L-carnitine (OBLC). Skeletal muscle biopsies were taken from the trapezius muscle and were permeabilized and added to an Oroboros O2K high-resolution respirometer to determine (a) mitochondrial oxidative capacity in the presence of metabolic substrates, (b) reactive oxygen species production, and (c) reactive oxygen species production relative to oxidative capacity. Muscle was used for immunoblotting of (d) electron transport system complexes I-V, (e, f) superoxide dismutase isoforms, (g) very long chain acyl-CoA dehydrogenase, and (h) phosphorylation of pyruvate dehydrogenase relative to NW. Representative western blots for (i) electron transport system complexes, (j) superoxide dismutase isoforms, (k) very long chain acyl-CoA dehydrogenase, and (l) phosphorylation of pyruvate dehydrogenase. ab Superscripts indicate differences at p < 0.05. cd Superscripts indicate differences at p < 0.1. Graphs represent mean ± SEM.

Similar articles

Cited by

References

    1. Giles SL, Rands SA, Nicol CJ, Harris PA. Obesity prevalence and associated risk factors in outdoor living domestic horses and ponies. PeerJ. 2014;2:e299. doi: 10.7717/peerj.299. - DOI - PMC - PubMed
    1. Kosolofski, H. R., Gow, S. P. & Robinson, K. A. Prevalence of obesity in the equine population of Saskatoon and surrounding area. Can. Vet. J.58 - PMC - PubMed
    1. Ertelt A, Barton A-K, Schmitz RR, Gehlen H. Metabolic syndrome: Is equine disease comparable to what we know in humans? Endocr. Connect. 2014;3:R81–R93. doi: 10.1530/EC-14-0038. - DOI - PMC - PubMed
    1. Rendle D, et al. Equine obesity: current perspectives. UK-Vet. Equine. 2018;2:1–19. doi: 10.12968/ukve.2018.2.S2.3. - DOI
    1. Johnson PJ, Wiedmeyer CE, LaCarrubba A, Ganjam VKS, Messer NT. Diabetes, insulin resistance, and metabolic syndrome in horses. J. Diabetes Sci. Technol. 2012;6:534–540. doi: 10.1177/193229681200600307. - DOI - PMC - PubMed

MeSH terms