. 2024 Dec;8(12):1540-1552.
doi: 10.1038/s41551-024-01222-6. Epub 2024 Jun 17.

Enhancement of erythropoietic output by Cas9-mediated insertion of a natural variant in haematopoietic stem and progenitor cells

Affiliations

Enhancement of erythropoietic output by Cas9-mediated insertion of a natural variant in haematopoietic stem and progenitor cells

Sofia E Luna et al. Nat Biomed Eng. 2024 Dec.

Abstract

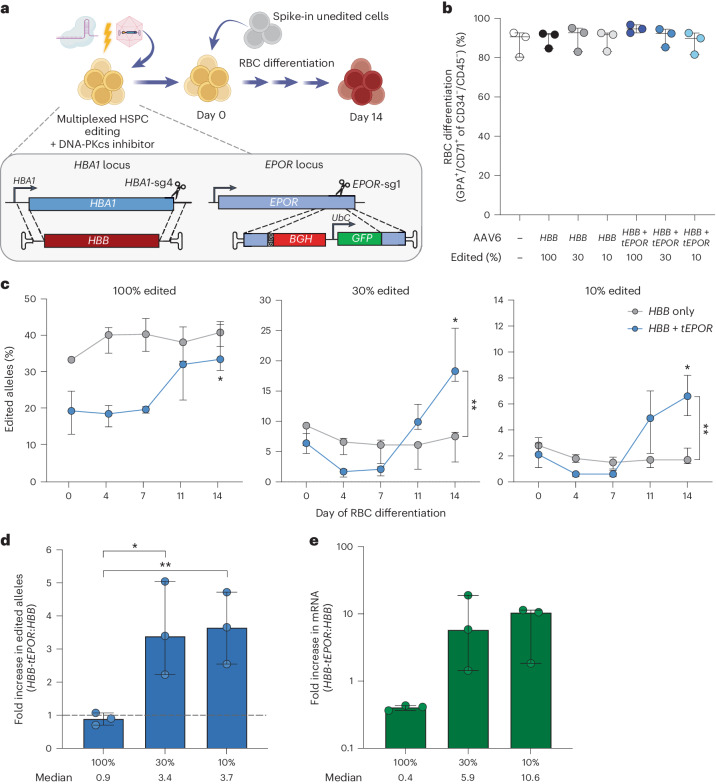
Some gene polymorphisms can lead to monogenic diseases, whereas other polymorphisms may confer beneficial traits. A well-characterized example is congenital erythrocytosis-the non-pathogenic hyper-production of red blood cells-that is caused by a truncated erythropoietin receptor. Here we show that Cas9-mediated genome editing in CD34+ human haematopoietic stem and progenitor cells (HSPCs) can recreate the truncated form of the erythropoietin receptor, leading to substantial increases in erythropoietic output. We also show that combining the expression of the cDNA of a truncated erythropoietin receptor with a previously reported genome-editing strategy to fully replace the HBA1 gene with an HBB transgene in HSPCs (to restore normal haemoglobin production in cells with a β-thalassaemia phenotype) gives the edited HSPCs and the healthy red blood cell phenotype a proliferative advantage. Combining knowledge of human genetics with precise genome editing to insert natural human variants into therapeutic cells may facilitate safer and more effective genome-editing therapies for patients with genetic diseases.


Conflict of interest statement

Competing interests: M.H.P. serves on the scientific advisory board of Allogene Tx and is an advisor to Versant Ventures. M.H.P., M.K.C. and J.C. have equity in Graphite Bio. M.H.P. has equity in CRISPR Tx and serves on the board of directors of Graphite Bio and Kamau Therapeutics. J.C., M.K.C. and M.H.P. have filed provisional patent number PCT/US2022/077951. All other authors declare no competing interests.

Figures

Fig. 1
Fig. 1. Cas9-guided EPOR truncation in HSPCs enhances erythroid proliferation.
a, Schematic of HSPC editing and model of tEPOR’s effect. Representation of EPOR gene and location of the candidate sgRNA (EPOR-sg1) indicated by a line. Location of c.1316G>A mutation is denoted by the star. Created with BioRender.com. b, Frequency of indels created by EPOR-sg1 in primary human CD34+ HSPCs over the course of erythroid differentiation compared with control HBB sgRNA. Points represent median ± interquartile range. Values represent biologically independent HSPC donors: n = 5 for EPOR-sg1 and n = 1 for control HBB sgRNA. *P = 0.0016 of day 0 versus day 14 by unpaired two-tailed t-test. c, Genome-editing strategy when using an AAV6 DNA repair template to introduce the EPOR c.1316G>A mutation followed by a BGH-poly(A) region and UbC-driven GFP reporter. d, Percentage of GPA+/CD71+ of live single cells on day 14 of differentiation. Bars represent median ± interquartile range. Values represent biologically independent HSPC donors: n = 2–3 for HSPC and n = 3–4 for −EPO and +EPO conditions. *P = 0.0016 of −EPO versus HSPC conditions; **P = 0.003, ***P = 0.0001 of −EPO versus +EPO conditions by unpaired two-tailed t-test. e, Percentage of GFP+ cells of live single cells maintained in RBC media with or without EPO or HSPC media as determined by flow cytometry. Points represent median ± interquartile range. Values represent biologically independent HSPC donors: n = 2 for HSPC condition and n = 3–4 for −EPO and +EPO conditions. *P = 0.04, **P = 0.0006 of day 0 versus day 14 by unpaired two-tailed t-test. f, Fold change in cell count throughout RBC differentiation (for example, if at day 0 starting cell numbers were 1 × 105 cells total, then a fold count change of 1,000 would yield a total cell number of 1 × 108 at day 14). Points represent mean ± s.e.m. Values represent biologically independent HSPC donors: n = 3 for mock and EPOR-sg1 + BGH and n = 2 for EPOR-sg1. Source data
Fig. 2
Fig. 2. Integration of tEPOR cDNA shows an erythroid-specific proliferative effect.
a, Genome-editing strategy to introduce tEPOR-T2A-YFP-BGH-poly(A) cDNA at the CCR5 locus with expression driven by a ubiquitous UbC promoter. b, Percentage of GPA+/CD71+ of live single cells on day 14 of differentiation following introduction of tEPOR at the CCR5 locus. Bars represent median ± interquartile range. Values represent biologically independent HSPC donors: n = 2–3 for HSPC condition and n = 2–4 for −EPO and +EPO conditions. *P = 0.0018 for −EPO versus HSPC conditions, **P < 0.0001 for −EPO versus +EPO conditions by unpaired two-tailed t-test. c, Representative flow cytometry plots of one donor of CCR5-sg3 + tEPOR-edited HSPCs on day 14 of RBC differentiation in the +EPO condition. d, Percentage of YFP+ cells of live single cells as determined by flow cytometry. Points represent mean ± s.e.m. Values represent biologically independent HSPC donors: n = 2 for HSPC condition, n = 3 for −EPO condition and n = 3–4 for +EPO condition. *P = 0.0003 for day 0 versus day 14 by unpaired two-tailed t-test. e, Genome-editing strategy to introduce tEPOR-T2A-YFP cDNA at the HBA1 locus by whole gene replacement to place integration cassette under regulation of the endogenous HBA1 promoter. f, Percentage of GPA+/CD71+ of live single cells on day 14 of differentiation following introduction of tEPOR cDNA at the HBA1 locus. Bars represent median ± 95% confidence interval. Values represent biologically independent HSPC donors: n = 2 for HSPC condition and n = 2–3 for −EPO and +EPO condition. *P = 0.0002 for −EPO to +EPO condition by unpaired two-tailed t-test. g, Representative flow cytometry plots of one donor of HBA1-sg4 + tEPOR-edited HSPCs on day 11 of RBC differentiation in the +EPO condition. h, Percentage of YFP+ cells of live single cells as determined by flow cytometry. Points represent mean ± s.e.m. Values represent biologically independent HSPC donors: n = 2 for HSPC condition and n = 3 for −EPO and +EPO condition. FSC-A, forward scatter area; FITC, fluorescein isothiocyanate. Source data
Fig. 3
Fig. 3. Therapeutic editing frequencies are achieved using bicistronic HBB-tEPOR cassette.
a, Design of HBB (control) and HBB-tEPOR (bicistronic) AAV6 donor cassettes targeted to the HBA1 locus by whole gene replacement. b, Percentage of GPA+/CD71+ of CD34/CD45 cells on day 14 as determined by flow cytometry. Points are shown as median ± 95% confidence interval. Values represent biologically independent HSPC donors: n = 2 for HBB and n = 3 for all other vectors. c, Percentage of edited alleles for control (HBB) and bicistronic HBB-tEPOR in cord-blood-derived CD34+ cells over the course of RBC differentiation. Points are shown as median ± 95% confidence interval. Values represent biologically independent HSPC donors: n = 2 for HBB, n = 3 for all other vectors. *P = 0.003 for PGK-tEPOR, P = 0.0055 for tEPOR-T2A, P = 0.0259 for tEPOR-FuT2A, P = 0.0003 for IRES-tEPOR (day 0 versus day 14) by unpaired two-tailed t-test. d, Fold change in edited alleles from the beginning (day 0) to end (day 14) of RBC differentiation.The dashed line represents no fold change. Bars represent median ± 95% confidence interval. e, Percentage of edited alleles for control (HBB) and bicistronic HBB-tEPOR vectors in cells from patients with SCD over the course of RBC differentiation. Points are shown as median ± 95% confidence interval. Values represent biologically independent HSPC donors: n = 3 for PGK-tEPOR and n = 4 for all other vectors. *P = 0.0061 for PGK-tEPOR, *P = 0.011 for tEPOR-T2A, *P = 0.0016 for tEPOR-FuT2A, *P = 0.0153 for IRES-tEPOR (day 0 versus day 14) by unpaired two-tailed t-test. f, Fold change in edited alleles from the beginning (day 0) to end (day 14) of RBC differentiation. The dashed line represents no fold change. Bars represent median ± 95% confidence interval. Source data
Fig. 4
Fig. 4. Multiplexed editing of EPOR and HBA1 leads to robust increase in HBB mRNA within editing HSPCs.
a, Schematic of multiplexed editing strategy with spike-in of unedited cells at the start of erythroid differentiation to model HSPC transplantation. b, Percentage of GPA+/CD71+ of CD34/CD45 cells on day 14 of RBC differentiation as determined by flow cytometry. Points are shown as median ± interquartile range. n = 3 biologically independent HSPC donors. c, Percentage of edited alleles at HBA1 in all multiplexed editing or spike-in conditions throughout RBC differentiation. Points are shown as median ± 95% confidence interval. n = 3 biologically independent HSPC donors. *P = 0.0332 for HBB + tEPOR 100%, *P = 0.0086 for HBB + tEPOR 30%, *P = 0.0122 for HBB + tEPOR 10% (day 0 versus day 14) by unpaired two-tailed t-test; **P = 0.0113 for HBB versus HBB + tEPOR 30% at day 14, **P = 0.008 for HBB versus HBB + tEPOR 10% at day 14 by unpaired two-tailed t-test. d, Fold increase in edited alleles on day 14 of differentiation of multiplexed conditions versus HBB only. The dashed line represents no fold change. Bars represent median ± 95% confidence interval. *P = 0.0315, **P = 0.0123 by unpaired two-tailed t-test. e, mRNA expression of integrated HBB at HBA1 locus normalized to HBB expression from mock. GPA mRNA expression was used as a reference. n = 3 biologically independent HSPC donors. Bars represent median ± 95% confidence interval. Source data
Extended Data Fig. 1
Extended Data Fig. 1. Indel analysis of HSPCs edited with most effective EPOR sgRNA (sg1) over course of erythroid differentiation.
a, Frequency of five most common indels found in one HSPC donor targeted with EPOR-sg1 over the course of RBC differentiation. b, Fold enrichment of five most common indels over course of RBC differentiation in one HSPC donor targeted with EPOR-sg1. Source data
Extended Data Fig. 2
Extended Data Fig. 2. Almost all cells edited at EPOR locus contain tEPOR at end of differentiation and show increased erythroid proliferation.
a, Plot of percentage of GFP+ cells of live single cells maintained in RBC media +EPO (from data shown in Fig. 1e) overlaid with percentage of alleles containing indels in EPOR in same three biological donors. Points represent median ± 95% confidence interval. b, Cell count fold change in mock and edited cells maintained in RBC media +/- EPO or HSPC media. Points represent mean ± SEM. Values represent biologically independent HSPC donors N = 3 for Mock and EPOR-sg1+ BGH and N = 2 for sg1. Data for +EPO condition same as in Fig. 1f. Source data
Extended Data Fig. 3
Extended Data Fig. 3. Enrichment of edited cells and RBC differentiation is only minorly affected by different concentration of EPO in media.
a, Schematic depicting HSPC editing and subsequent RBC differentiation using different levels of EPO cytokine. b, Percentage of GFP+ cells of live single cells maintained in RBC media with 0 U/mL – 20 U/mL EPO from one biological HSPC donor. c, Fold increase of GFP+ cells at each concentration of EPO compared to 0 U/mL EPO at day 14 of RBC differentiation. Bars represent median ± 95% confidence interval. N = 2 biological HSPC donors. d, Percentage of GPA+/CD71+ of live single cells on day 14 of differentiation. Bars represent median ± 95% confidence interval. Values represent N = 2 biologically independent HSPC donors. Source data
Extended Data Fig. 4
Extended Data Fig. 4. Off-target analysis of EPOR-sg1 by in silico prediction and targeted next-generation sequencing (NGS).
a, Complete list of potential off-target sites predicted by COSMID with a score ≤5.5. b, Summary of off-target sites classified by region in genome. c, Detailed summary of 5 candidate off-target sites found in an exon or UTR of the genome. Sequence nucleotide mismatches highlighted in red, inserted nucleotides underlined, and missing nucleotides indicated by the ‘^’ symbol. PAM sequence highlighted in blue. d, Sequencing read depth of mock-edited and EPOR-sg1 edited sample sent for each off-target site. N = 1 biological HSPC donor. e, Frequency of indels detected in each sample at each off-target site. N = 1 biological HSPC donor. Source data
Extended Data Fig. 5
Extended Data Fig. 5. Safe harbour integration of tEPOR leads to increased erythroid proliferation and editing frequencies with little impact at different concentrations of EPO.
a, Fold change in edited alleles at CCR5 over course of RBC differentiation +/- EPO or maintained in HSPC media measured by ddPCR. Points shown as median ± interquartile range. N = 3-4 biologically independent HSPC donors. b, Cell count fold change in mock and edited cells maintained in RBC media +/- EPO or HSPC media. Points represent mean ± SEM. Values represent biologically independent HSPC donors N = 3 for Mock and CCR5-sg3 + tEPOR and N = 2 for CCR5-sg3. c, Percentage of YFP+ cells of live single cells throughout RBC differentiation with 0 U/mL – 20 U/mL EPO from one biological HSPC donor. d, Fold increase of YFP+ cells at each concentration of EPO compared to 0 U/mL EPO at day 14 of differentiation. Bars represent median ± 95% confidence interval. N = 2 biological HSPC donors. e, Percentage of GPA+/CD71+ of live single cells on day 14 of differentiation. Bars represent median ± 95% confidence interval. Values represent N = 2 biologically independent HSPC donors. Source data
Extended Data Fig. 6
Extended Data Fig. 6. Erythroid specific expression of tEPOR leads to increased editing frequencies and is not affected by EPO concentration.
a, Fold change in edited alleles at HBA1 over course of RBC differentiation +/- EPO measured by ddPCR. Points shown as median ± 95% CI. N = 3 biologically independent HSPC donors. b, Percentage of YFP+ cells of live single cells throughout RBC differentiation with 0 U/mL – 20 U/mL EPO in one biological HSPC donor. c, Fold increase of YFP+ cells at each EPO concentration compared to 0 U/mL EPO at day 14 of RBC differentiation. Bars represent median ± 95% confidence interval. N = 2 biological HSPC donors. d, Percentage of GPA+/CD71+ of live single cells on day 14 of differentiation. Bars represent median ± 95% confidence interval. Values represent N = 2 biologically independent HSPC donors. Source data
Extended Data Fig. 7
Extended Data Fig. 7. Haemoglobin tetramer analysis of tEPOR-edited SCD patient HSPCs following RBC differentiation.
a, Percentage of GPA+/CD71+ of CD34/CD45cells on day 14 of RBC differentiation as determined by flow cytometry. Points shown as median ± 95% confidence interval. N = 4 biologically independent HSPC donors. b, Ratio of adult haemoglobin to sickle haemoglobin from HPLC analysis of haemoglobin tetramers from differentiated SCD patient HSPCs. Bars shown as mean ± SD. N = 4 biologically independent HSPC donors. Source data
Extended Data Fig. 8
Extended Data Fig. 8. Multiplexed editing shows maintenance of EPOR truncation at end of RBC differentiation and does not disrupt HSPC lineage formation.
a, Percentage of GFP+ cells of live single cells on day 14 of RBC differentiation as determined by flow cytometry. Points represent median ± interquartile range. Values represent N = 3 biologically independent HSPC donors. b, CFU assay of mock, single edited, and multiplex edited HSPCs. Bars represent percent of total colonies: CFU-GEMM (multi-potential granulocyte, erythroid, macrophage, megakaryocyte progenitor cells), CFU-GM (colony forming unit-granulocytes and monocytes), and BFU-E (erythroid burst forming units). N = 1. c, Number of total colonies in CFU assay produced per 500 plated cells in each condition. Source data

Similar articles

Cited by

References

    1. Hütter, G. et al. Long-term control of HIV by CCR5 Delta32/Delta32 stem-cell transplantation. N. Engl. J. Med.360, 692–698 (2009). - PubMed
    1. Frangoul, H. et al. CRISPR-Cas9 gene editing for sickle cell disease and β-thalassemia. N. Engl. J. Med.384, 252–260 (2021). - PubMed
    1. Fitzgerald, K. et al. A highly durable RNAi therapeutic inhibitor of PCSK9. N. Engl. J. Med.376, 41–51 (2017). - PMC - PubMed
    1. de la Chapelle, A., Träskelin, A. L. & Juvonen, E. Truncated erythropoietin receptor causes dominantly inherited benign human erythrocytosis. Proc. Natl Acad. Sci. USA90, 4495–4499 (1993). - PMC - PubMed
    1. Sokol, L. et al. Primary familial polycythemia: a frameshift mutation in the erythropoietin receptor gene and increased sensitivity of erythroid progenitors to erythropoietin. Blood86, 15–22 (1995). - PubMed

MeSH terms