. 2024 Aug;43(15):3287-3306.
doi: 10.1038/s44318-024-00135-z. Epub 2024 Jun 17.

Cryo-EM structure of a conjugative type IV secretion system suggests a molecular switch regulating pilus biogenesis

Affiliations

Cryo-EM structure of a conjugative type IV secretion system suggests a molecular switch regulating pilus biogenesis

Kévin Macé et al. EMBO J. 2024 Aug.

Abstract

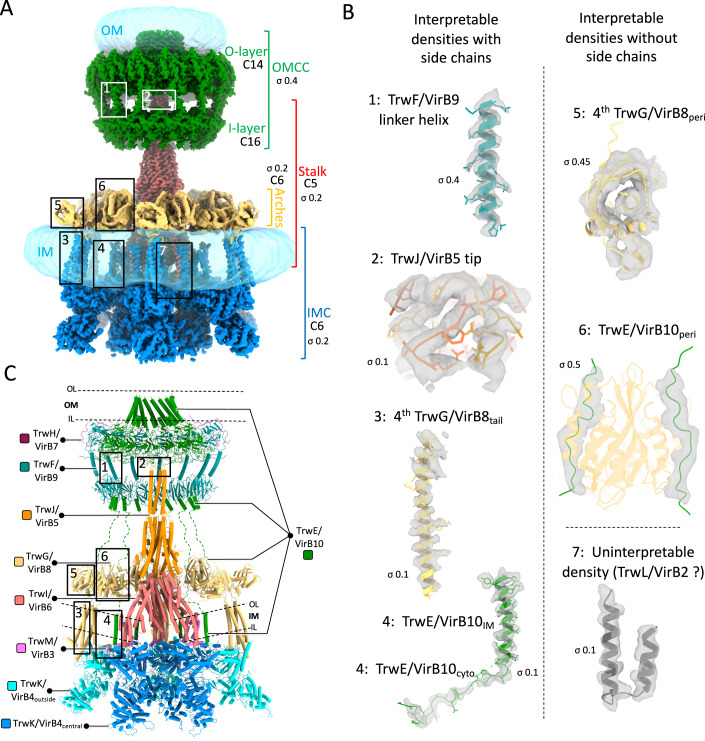
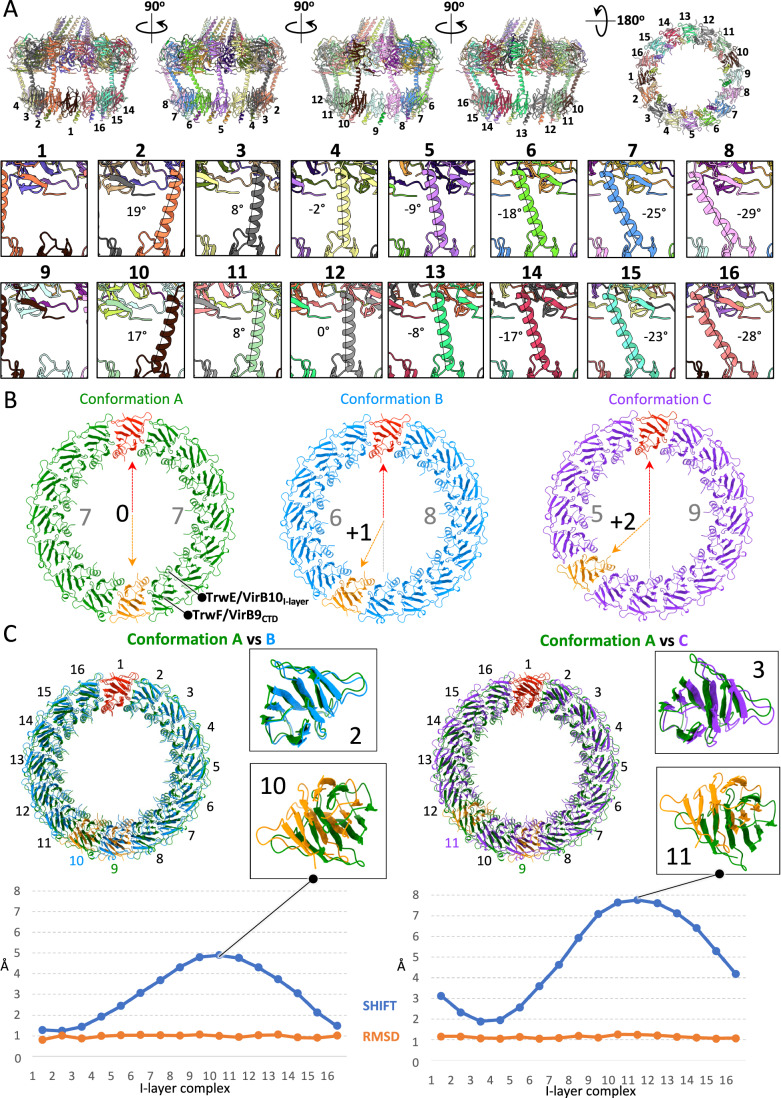
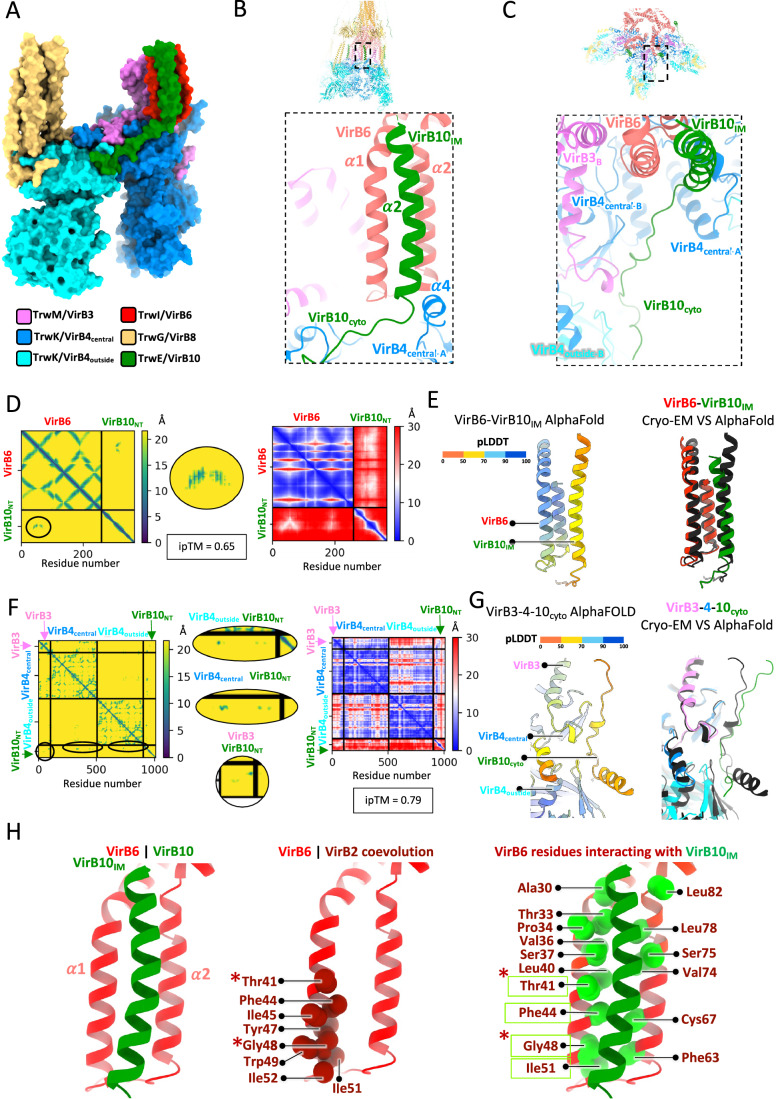
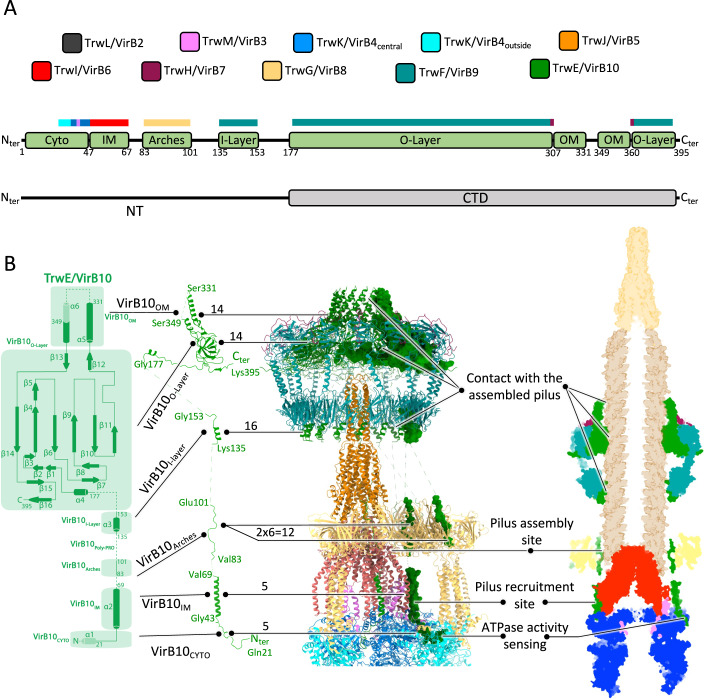
Conjugative type IV secretion systems (T4SS) mediate bacterial conjugation, a process that enables the unidirectional exchange of genetic materials between a donor and a recipient bacterial cell. Bacterial conjugation is the primary means by which antibiotic resistance genes spread among bacterial populations (Barlow 2009; Virolle et al, 2020). Conjugative T4SSs form pili: long extracellular filaments that connect with recipient cells. Previously, we solved the cryo-electron microscopy (cryo-EM) structure of a conjugative T4SS. In this article, based on additional data, we present a more complete T4SS cryo-EM structure than that published earlier. Novel structural features include details of the mismatch symmetry within the OMCC, the presence of a fourth VirB8 subunit in the asymmetric unit of both the arches and the inner membrane complex (IMC), and a hydrophobic VirB5 tip in the distal end of the stalk. Additionally, we provide previously undescribed structural insights into the protein VirB10 and identify a novel regulation mechanism of T4SS-mediated pilus biogenesis by this protein, that we believe is a key checkpoint for this process.

Keywords: Antibiotic Resistance; Bacterial Conjugation; Cryo-EM; T4SS; Type IV Secretion System.


Figures

Figure 1
Figure 1. Improved structure of the R388 conjugative T4SS.
(A) Composite EM density map. A composite EM density map of the R388 T4SS is presented and created by assembling maps detailed in Table EV1A. In this map, sub-complexes of the T4SS, including the outer membrane core complex (OMCC; map referred to as “OMCC Conformation A at 3.2 Å”), the Stalk (map referred to as “Stalk C5 at 3.0 Å”), the Arches (map referred to as “Arches at 6.2 Å”), and the inner membrane complex (IMC, map referred to as “extended IMC protomer at 3.8 Å”), are colour-coded in green, red, yellow and blue, respectively. Sigma levels for each map is reported. Symmetry within the sub-complexes is indicated. The detergent and/or lipid densities at the membrane and outer membranes are depicted as semi-transparent light blue density. Additionally, newly identified densities from this study compared to the one published previously are highlighted in rectangular boxes and detailed in panel (B). (B) Newly identified densities. Three categories of newly identified densities are shown as grey, semi-transparent surface contour: interpretable with side chains (regions 1 to 4), interpretable with only secondary structures represented (no side chains; regions 5 and 6) and uninterpretable (region 7). Structures shown in these densities are in cartoon representation, with side chains reported only for regions 1 to 4. The structures are colour-coded according to proteins as in panel (C). Sigma levels are reported. For region 7, the density was tentatively ascribed to TrwL/VirB2, but in the absence of corroborating evidence, the density is classed as uninterpretable at this moment in time. (C) Composite model of the T4SS. A composite model of the R388 T4SS is presented in cartoon representation colour-coded per protein as shown in margins. Positions of IM and OM based on cryo-EM densities of detergents and lipids are shown by dashed lines labelled OL and IL for the outer leaflet and inner leaflet of the lipid bilayer. Regions highlighted in (B) are shown in correspondingly numbered boxes.
Figure 2
Figure 2. Analysis of OMCC mismatch symmetry.
(A) Structure analysis of the OMCC conformation A. In the top panel, five views of the OMCC structure obtained without symmetry applied (from the “Conformation A at 3.2 Å” map) are shown in cartoon representation and coloured by chains. Each I-layer complex is numbered. The bottom panel provides a close-up view of all TrwF/VirB9 linker helices connecting the O-layer to the I-layer, with the angles of the helices relative to the vertical axis indicated. (B) Three distinct conformations of the OMCC. In this panel, three OMCC structures are presented, each exhibiting a distinct I-layer organisation. A top view of the three I-layer structures is shown in cartoon representation, with colours representing different conformations: green for the conformation A, blue for the conformation B and purple for the conformation C. For each conformation, the two extra I-layer complexes are coloured in red and orange. The number of I-layer complexes between the two inserted extra I-layer complexes is indicated in grey. (C) Superposition of OMCC structures. This panel shows pairwise superpositions of the OMCC structures presented in panel (B), with alignment based on the O-layer. Left: superposition of Conformations A and B. Right: superposition of Conformations A and C. The impact of the insertion of two extra complexes in the I-layer is shown at the right of each superposition in zoom-in panels illustrating the least and most affected complexes (2 and 10 for Conformation A versus B and 3 and 11 for Conformation A versus C). Also reported underneath is the shift (as reported using Chimera) separating the two superposed structures for each I-layer complex position. Despite these shifts, each I-layer complex structure remains identical, as evidenced by the RSMD values (orange line). Raw data are included in the source data file. Source data are available online for this figure.
Figure 3
Figure 3. Structure of the Stalk and Arches sub-complex.
(A) The stalk in various representations. In this panel, the Stalk structure is presented in both side and top views, employing three different colour-coding schemes: by proteins (left), hydrophobicity (middle), and coulombic properties (right). The newly resolved tip of the TrwJ/VirB5 structures is indicated in brackets, and the IM is delineated by two dashed lines labelled OL and IL. (B) Details of the cryo-EM map in the Arches region. Left: top view of the “Arches at 6.2 Å” map (Table EV1a) is displayed in grey colour and shows three asymmetric units, one of them (in dashed line box) is better defined. Sigma level is indicated. Middle panel: close-up of the asymmetric unit of the “Arches at 6.2 Å” map corresponding to the region shown in the inset in the left panel. The structure of four TrwG/VirB8peri and four TrwG/VirB8connector regions are shown in cartoon representation (rigid body fitting correlation coefficient of 0.88 and 0.75 for TrwG/VirB8peri and TrwG/VirB8connector, respectively). Density is shown in semi-transparent grey. Two dashed rectangles highlight two newly solved portions of the structure compared to our earlier work: the TrwG/VirB8connector and the fourth TrwG/VirB8peri, which are further detailed in the zoomed-in views on the right. (C) TrwG/VirB8 Arches structure validation using AlphaFold. Distogram plot (left), predicted model colour-coded by model quality (pLDDT; middle) and PAE (predicted aligned error) plot (right) for the four TrwG/VirB8 tail and connector domains. Interacting residue pairs detected by AlphaFold are marked with green dots on the diagram at left. The ipTM score is reported. A list of co-evolving residue pairs and top-scoring pair mapping onto AlphaFold models are reported in Dataset EV1 and Fig. EV3. (D) Superposition of the AlphaFold (in black ribbon) and cryo-EM (in yellow ribbon) models for the TrwG/VirB8 connector and tail domains (RMSD of 9.398 and 6.928 Å for TrwG/VirB8connector and TrwG/VirB8tails, respectively) without (left) or with (right) the cryo-EM EM density map for this region contoured at same sigma level as in panel (B). (E) Structure of the asymmetric unit of the TrwG/VirB8 Arches structure. The four TrwG/VirB8 subunits are colour-coded in four shades of yellow and in cartoon representation. TrwG/VirB8 subunits and domains are indicated, as well as the location of the IM represented by two dashed lines labelled OL and IL.
Figure 4
Figure 4. Structure of the Arches sub-complex and VirB8-VirB10 interaction.
(A) Top view of the “Arches at 6.2 Å” cryo-EM map showing the two densities corresponding to TrwE/VirB10Arches. The map is presented in semi-transparent grey (sigma level indicated). The four TrwG/VirB8 are fitted within this map as represented in Fig. 3, panel E. Two densities corresponding to VirB10Arches are coloured green. (B) Identification TrwE/VirB10Arches, the region of TrwE/VirB10 that interacts with TrwG/VirB8peri using AlphaFold. Upper left: distogram plot between VirB10 and VirB8, with interacting residue pairs shown as green dots surrounded by a solid-lined oval. A zoom-up of this region is shown next to it. Lower left: PAE plot with ipTM score. Middle: AlphaFold-derived structural model of TrwG/VirB8peri-TrwE/VirB10Arches (residues 88 to 96) shown in cartoon representation, colour-coded by model quality (pLDDT). Right: superposition of the AlphaFold-derived model (in black cartoon) onto the cryo-EM-derived TrwG/VirB8peri-TrwE/VirB10Arches structure (in yellow and green cartoon, respectively). RMSD is 0.65 Å. A list of co-evolving residue pairs and top-scoring pair mapping onto AlphaFold models are reported in Dataset EV1 and Fig. EV3. (C) Top view of the structure of the asymmetric unit of the Arches. Left: the four TrwG/VirB8 periplasmic and connector domains are shown in cartoon representation, coloured in four shades of yellow, while the poly-Ala chain of the two TrwE/VirB10Arches are shown in green with a surface representation. A dashed rectangle indicates the zoomed-in area shown on the right. Right: Zoomed-in view of inset shown at left. This view highlights (1) the twofold symmetry between the two TrwG/VirB8peri-TrwE/VirB10Arches complexes; (2) the involvement of TrwG/VirB8peri α4 and α5 in binding TrwE/VirB10Arches. (D) Details of secondary structures participating in TrwG/VirB8peri-TrwE/VirB10Arches interaction. Both proteins are as in panel C, except for the TrwG/VirB8peri region shown in red, which points to a region of VirB8peri shown previously to interact with VirB10 (Sharifahmadian et al, 2017). Secondary structures in TrwG/VirB8peri are labelled, showing interaction in TrwG/VirB8 is principally along the α4 and α5 helices. Residues boundaries for TrwE/VirB10Arches are labelled. Arrows indicate which T4SS sub-complex to which TrwE/VirB10Arches connect, OMCC at the top and IMC at the bottom.
Figure 5
Figure 5. TrwE/VirB10 inner membrane and cytoplasmic sub-domains.
(A) Structure of the extended IMC protomer. This panel presents a side view of the extended IMC protomer structure in surface representation, colour-coded by protein as indicated. The extended IMC protomer includes the formerly-defined IMC protomer (TrwK/VirB4central, TrwK/VirB4outside, TrwM/VirB3 and four TrwG/VirB8tails) to which has been added the TM α1 and α2 of TrwI/VirB6 and TrwE/VirB10IM and TrwE/VirB10Cyto. (B) Location and interaction details of TrwE/VirB10IM with the TM helices (α1 and α2) of TrwI/VirB6. Representation and colour coding of proteins are as in Fig. 1C. Inset locates the region of the structure zoomed-in at right. (C) Location and interaction details of TrwE/VirB10Cyto with the TrwK/VirB4central-TrwK/VIrB4outside-TrwM/VirB3 part of the T4SS complex. Representation and colour coding of proteins are as in Fig. 1C. Inset locates the region of the structure zoomed-in at right. (D) Validation of VirB10-VirB6 interaction using AlphaFold. Left: distogram plot between VirB10NT (see definition of VirB10NT in the main text) and VirB6 with interacting residue pairs shown as green dots surrounded by a solid-lined oval. Middle: a zoom-up of this region is shown. Right: PAE plot. The ipTM score is reported. A list of co-evolving residue pairs and top-scoring pair mapping onto AlphaFold models are reported in Dataset EV1 and Fig. EV3. E Comparison between the cryo-EM and AlphaFold structures of the TrwE/VirB10IM-TrwI/VirB6 complex. Left: AlphaFold-derived structural model of the TrwE/VirB10IM-TrwI/VirB6 complex shown in cartoon representation, colour-coded by model quality (pLDDT). Right: superposition of the AlphaFold-derived (in black cartoon) and cryo-EM-derived structure of the TrwE/VirB10IM-VirB6α1α2TM complex (in green and red cartoon, respectively). RMSD is 1.067 Å. (F) Validation of VirB10 interaction with VirB3 and VirB4 using AlphaFold. Left: distogram plot between VirB10 N-terminus (VirB10NT; see definition of VirB10NT in main text), VirB3 and VirB4, with interacting residue pairs involving TrwE/VirB10NT shown here as green dots surrounded by a solid-lined oval. A zoom-up of the various regions of interest is shown in the middle. Right: PAE plot. ipTM score is reported. A list of co-evolving residue pairs and top-scoring pair mapping onto AlphaFold models are reported in Dataset EV1 and Fig. EV3. (G) Comparison between the cryo-EM and AlphaFold structure of TrwE/VirB10Cyto-TrwK/VirB4-TrwM/VirB3 complex. Left: Alphafold-derived structural model of the TrwE/VirB10Cyto-TrwK/VirB4-TrwM/VirB3 complex, shown in cartoon representation, colour-coded by model quality (pLDDT). Right: superposition of the AlphaFold-derived (in black cartoon) and cryo-EM-derived structures of the TrwE/VirB10Cyto-TrwK/VirB4-TrwM/VirB3 complex (in dark and cyan blue cartoon for TrwK/VirB4central and TrwK/VirB4outside, respectively, pink cartoon for TrwM/VirB3 and dark green cartoon for TrwE/VirB10Cyto). RMSD is 1.85 Å. (H) TrwI/VirB6 α1 and α2 TM interactions with TrwE/VirB10IM. Left: structure of the VirB6 α1 and α2 TM interaction with VirB10IM in cartoon representation coloured in red and green, respectively. Middle: TrwI/VirB6 α1 and α2 in cartoon representation except for their residues known to co-evolve with the VirB2 pilus subunit shown as red spheres. Co-evolved residues are labelled, with a star, indicating that the residue was mutated in our previous study and the mutation was shown to result in a significant reduction of T4SS conjugation activities. Right: the same view as in the left panel, with the cα of TrwI/VirB6 residues interacting with TrwE/VirB10IM shown as green balls and labelled. A green box surrounding a residue name indicates that the VirB6 residue co-evolved in both interactions, with VirB2 and VirB10. The star is in the middle panel.
Figure 6
Figure 6. VirB10: a central protein of the T4SS.
(A) Structural organisation and interactions of TrwE/VirB10. Top panel, colour-code for Trw/VirB proteins used in this figure. Middle panel: functional organisation of TrwE/VirB10. Green boxes indicate the location and boundary residues of the various functional regions of TrwE/VirB10. In the main text, these functional regions are labelled TrwE/VirB10XXX (for example, TrwE/VirB10Arches or TrwE/VirB10IM) where the XXX subscript reflects the function and location of that region. The Trw/VirB proteins with which region TrwE/VirB10XXX interact are indicated on the coloured boxes just above (the colour is by proteins as in the top panel). Bottom panel: folded domain structure of TrwE/VirB10. While two domains were previously described, only one is now known to adopt a defined fold, TrwE/VirB10CTD, which is part of the O-layer et forms the OM channel. The previously named NTD is a linear peptide best described as an N-terminal region or TrwE/VirB10NT. (B) TrwE/VirB10 full-length structure details. Left: a topology diagram of TrwE/VirB10, with annotated domains and secondary structures. Middle left: The full-length VirB10 structure is presented in cartoon representation. Middle right: The T4SS structure is shown in cartoon representation, except for TrwE/VirB10, which is displayed in surface representation. The number of VirB10 copies known to make interactions with other VirB proteins or itself in the various T4SS regions and sub-complexes is indicated. Right: A cut-out side view in the surface representation of the T4SS-pilus model, with the pilus and its TrwJ/VirB5 tips. The VirB10’s potential functions by region/domain during pilus biogenesis are indicated. See main text for details.
Figure EV1
Figure EV1. Summary of maps and structure and workflow for OMCC maps.
(A) Summary of maps and structures. Top: unsharpened cryo-EM maps displayed. Sigma level at which the maps have been contoured are reported. Bottom: structures derived from maps and colour-coded as in Fig. 1. “Side chains” and “secondary structures” labels indicate which structures are reported with side and main chains, respectively. (B) Image processing workflow for the obtained OMCC maps. This panel provides details about the image processing workflow for the OMCC maps. It reports on all steps during processing Final sharpened maps coloured by local resolution are shown. FSC curve and angle distribution are reported.
Figure EV2
Figure EV2. Image processing workflow for stalk, arches asymmetric unit, extended IMC protomer and stalk-arches-IMC.
This figure provides a detailed overview of the image processing workflow for the stalk, arches asymmetric unit, extended IMC protomer and stalk-arches-IMC cryo-EM maps. It reports on all steps during processing. Final sharpened maps coloured by local resolution are shown. FSC curve and angle distribution are reported.
Figure EV3
Figure EV3. AlphaFold models with top-scoring co-evolving residue pairs mapped.
(A) Co-evolving residues at the interface of VirB8-A with VirB8-B, VirB8-C and VirB8-D. The ten top-scoring residue pairs listed in Dataset EV1 are mapped for each interaction onto the corresponding Alphafold model. Colour coding for proteins is green, purple, yellow, and cyan blue for VirB8-A, VirB8-B, VirB8-C and VirB8-D, respectively. Residue pairs are shown by bars between their Calpha atoms, colour-coded red, blue, and yellow for VirB8-A and B, VirB8-A and C and VirB8-A and D interactions, respectively. (B) Co-evolving residues at the interface of VirB10 and VirB8.The ten top-scoring residue pairs in Dataset EV1 are mapped onto the corresponding Alphafold model. Colour coding for proteins is as in Fig. 1. Residue pairs are shown by red bars between their Calpha atoms. (C) Co-evolving residues at the interface of VirB10 and VirB6. The ten top-scoring residue pairs in Dataset EV1 are mapped onto the corresponding Alphafold model presented below. Colour coding for proteins is as in Fig. 1. Residue pairs are shown by yellow bars between their Calpha atoms. (D) Co-evolving residues at the interface of VirB10 with VirB3 and VirB4. The ten top-scoring residue pairs in Dataset EV1 are mapped for each interaction onto the corresponding Alphafold model. Colour coding for proteins is as in Fig. 1. Residue pairs are shown by bars between their Calpha atoms, colour-coded red, yellow and orange for VirB3-VirB10NT, VirB4central-VirB10NT and VirB4outside-VirB10NT interactions, respectively.

Similar articles

Cited by

References

    1. Adams PD, Afonine PV, Bunkoczi G, Chen VB, Davis IW, Echols N, Headd JJ, Hung LW, Kapral GJ, Grosse-Kunstleve RW et al (2010) PHENIX: a comprehensive Python-based system for macromolecular structure solution. Acta Crystallogr D Biol Crystallogr 66:213–221 10.1107/S0907444909052925 - DOI - PMC - PubMed
    1. Aly KA, Baron C (2007) The VirB5 protein localizes to the T-pilus tips in Agrobacterium tumefaciens. Microbiology 153:3766–3775 10.1099/mic.0.2007/010462-0 - DOI - PubMed
    1. Amin H, Ilangovan A, Costa TRD (2021) Architecture of the outer-membrane core complex from a conjugative type IV secretion system. Nat Commun 12:6834 10.1038/s41467-021-27178-8 - DOI - PMC - PubMed
    1. Banta LM, Kerr JE, Cascales E, Giuliano ME, Bailey ME, McKay C, Chandran V, Waksman G, Christie PJ (2011) An Agrobacterium VirB10 mutation conferring a type IV secretion system gating defect. J Bacteriol 193:2566–2574 10.1128/JB.00038-11 - DOI - PMC - PubMed
    1. Barlow M (2009) What antimicrobial resistance has taught us about horizontal gene transfer. Methods Mol Biol 532:397–411 10.1007/978-1-60327-853-9_23 - DOI - PubMed

MeSH terms

Substances

LinkOut - more resources