. 2024 Jul;56(7):1377-1385.
doi: 10.1038/s41588-024-01790-y. Epub 2024 Jun 17.

Interaction between MED12 and ΔNp63 activates basal identity in pancreatic ductal adenocarcinoma

Affiliations

Interaction between MED12 and ΔNp63 activates basal identity in pancreatic ductal adenocarcinoma

Diogo Maia-Silva et al. Nat Genet. 2024 Jul.

Abstract

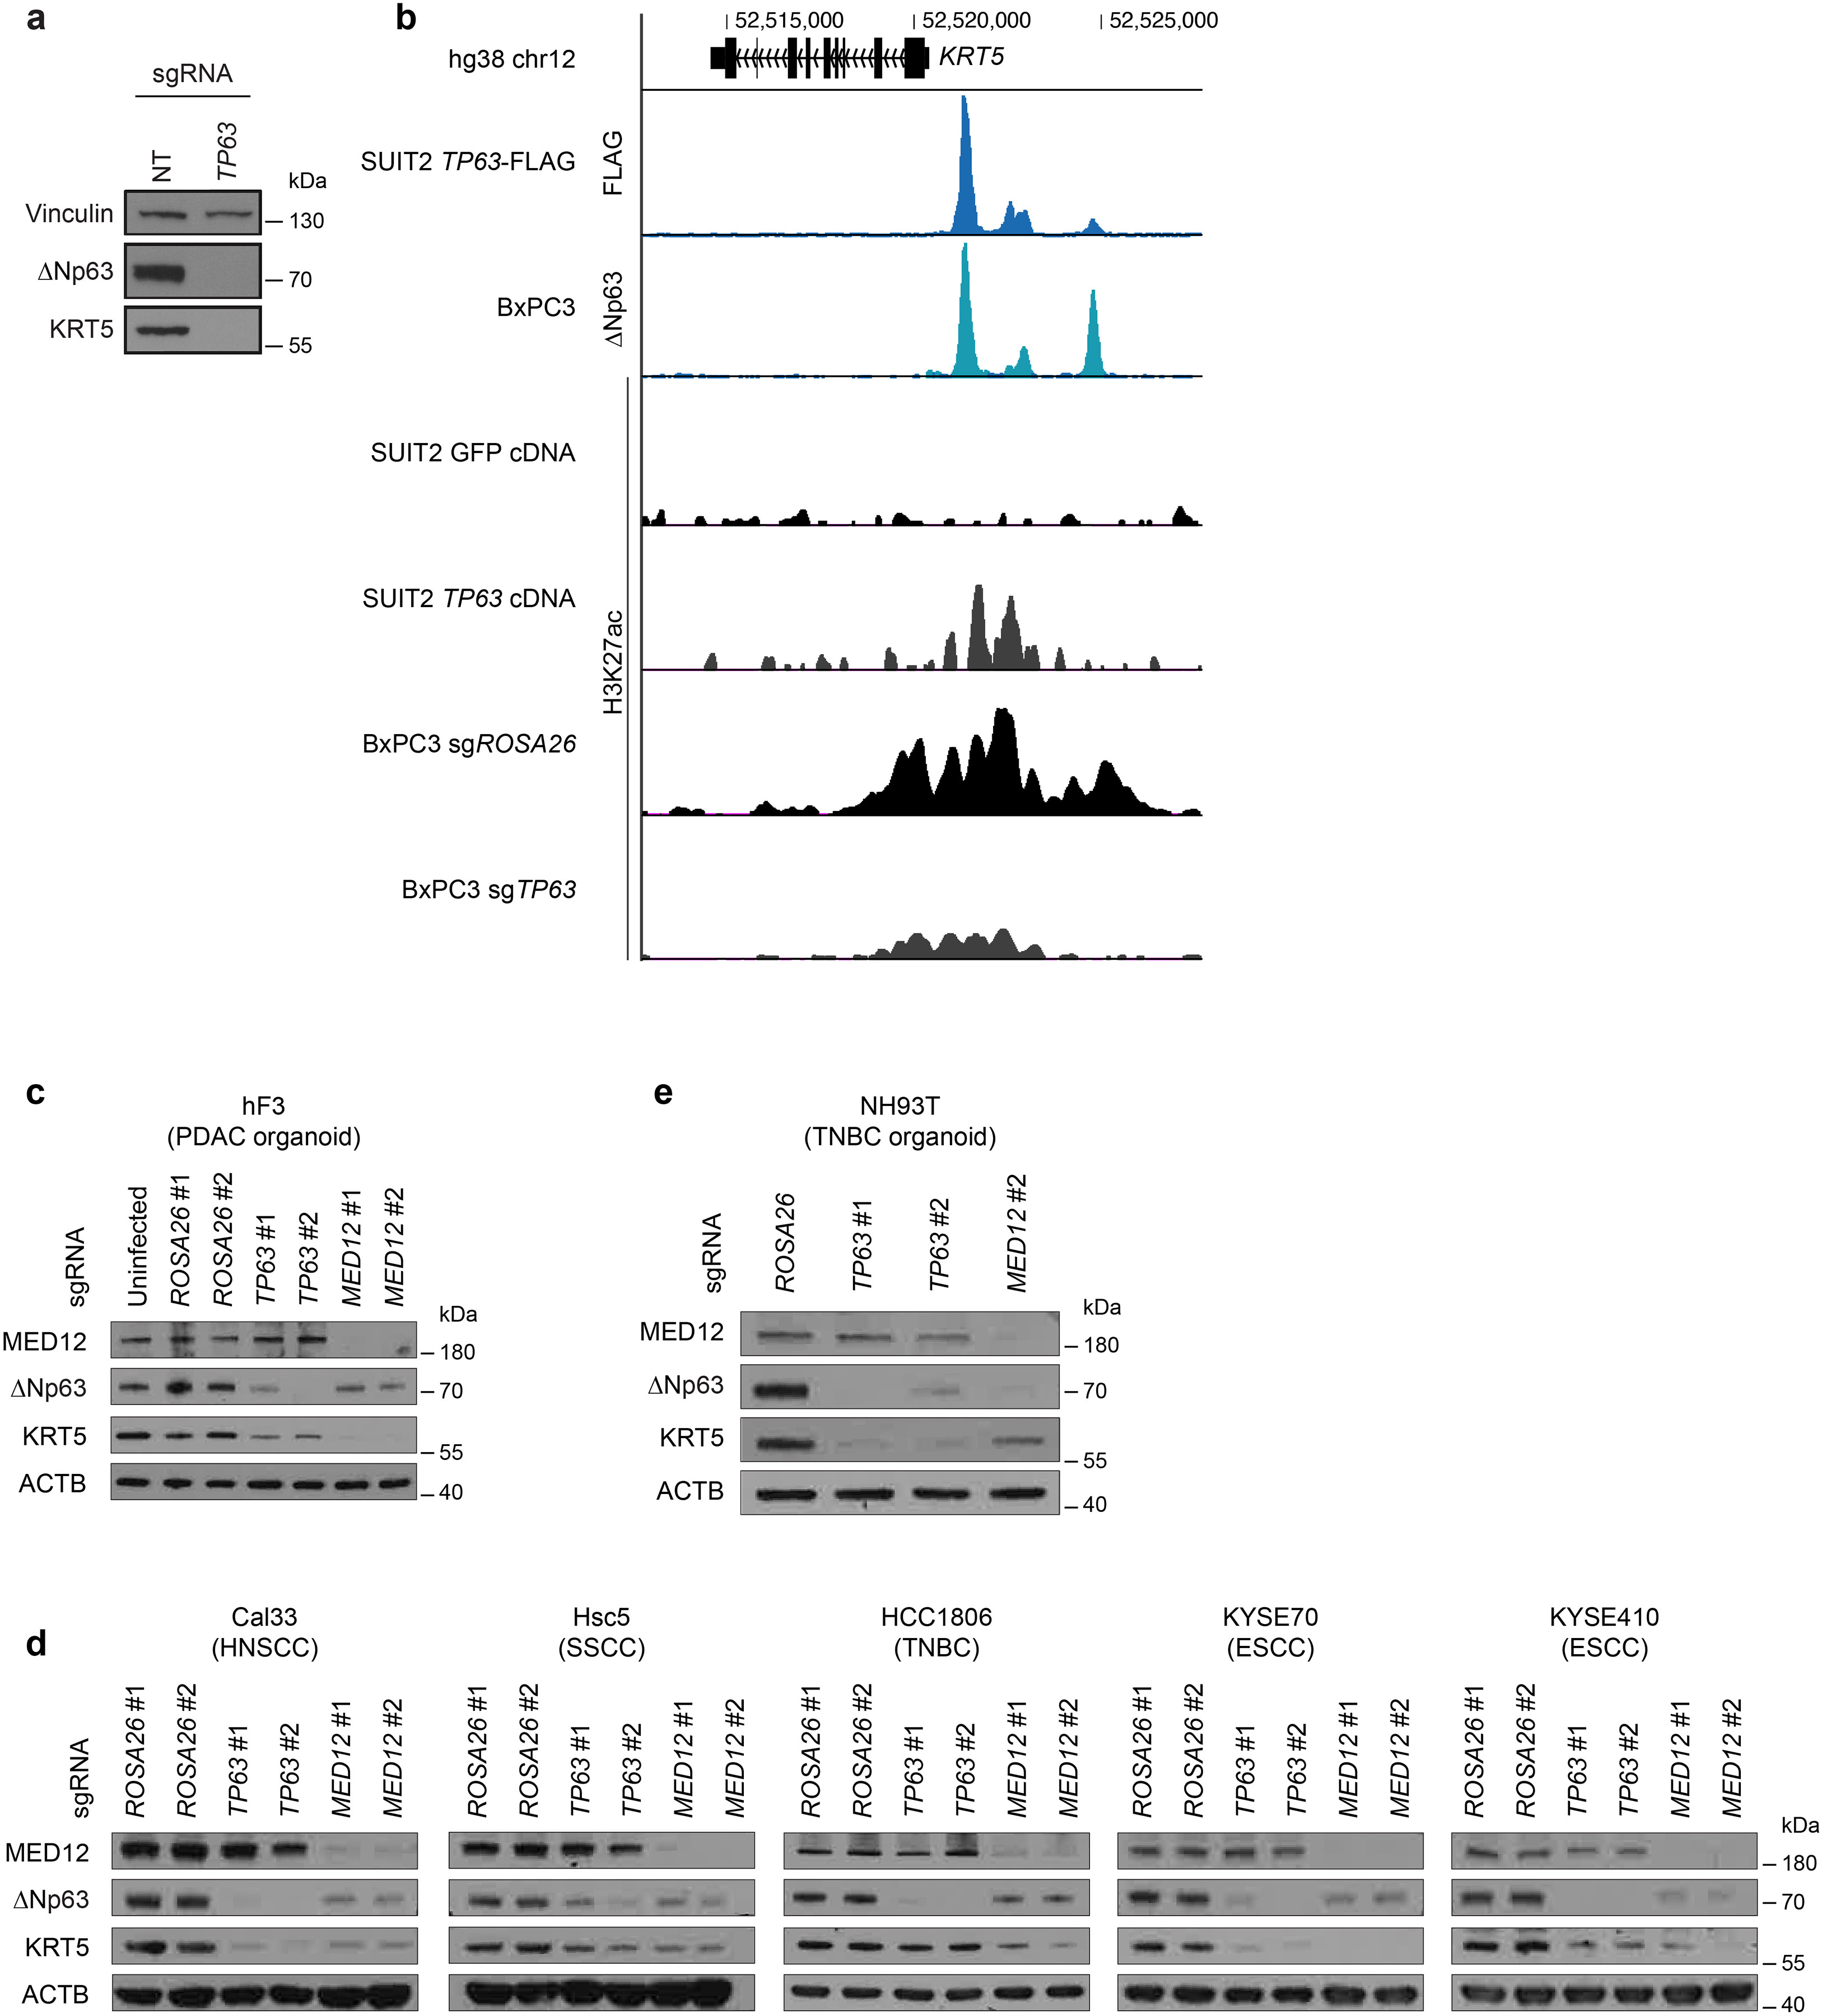
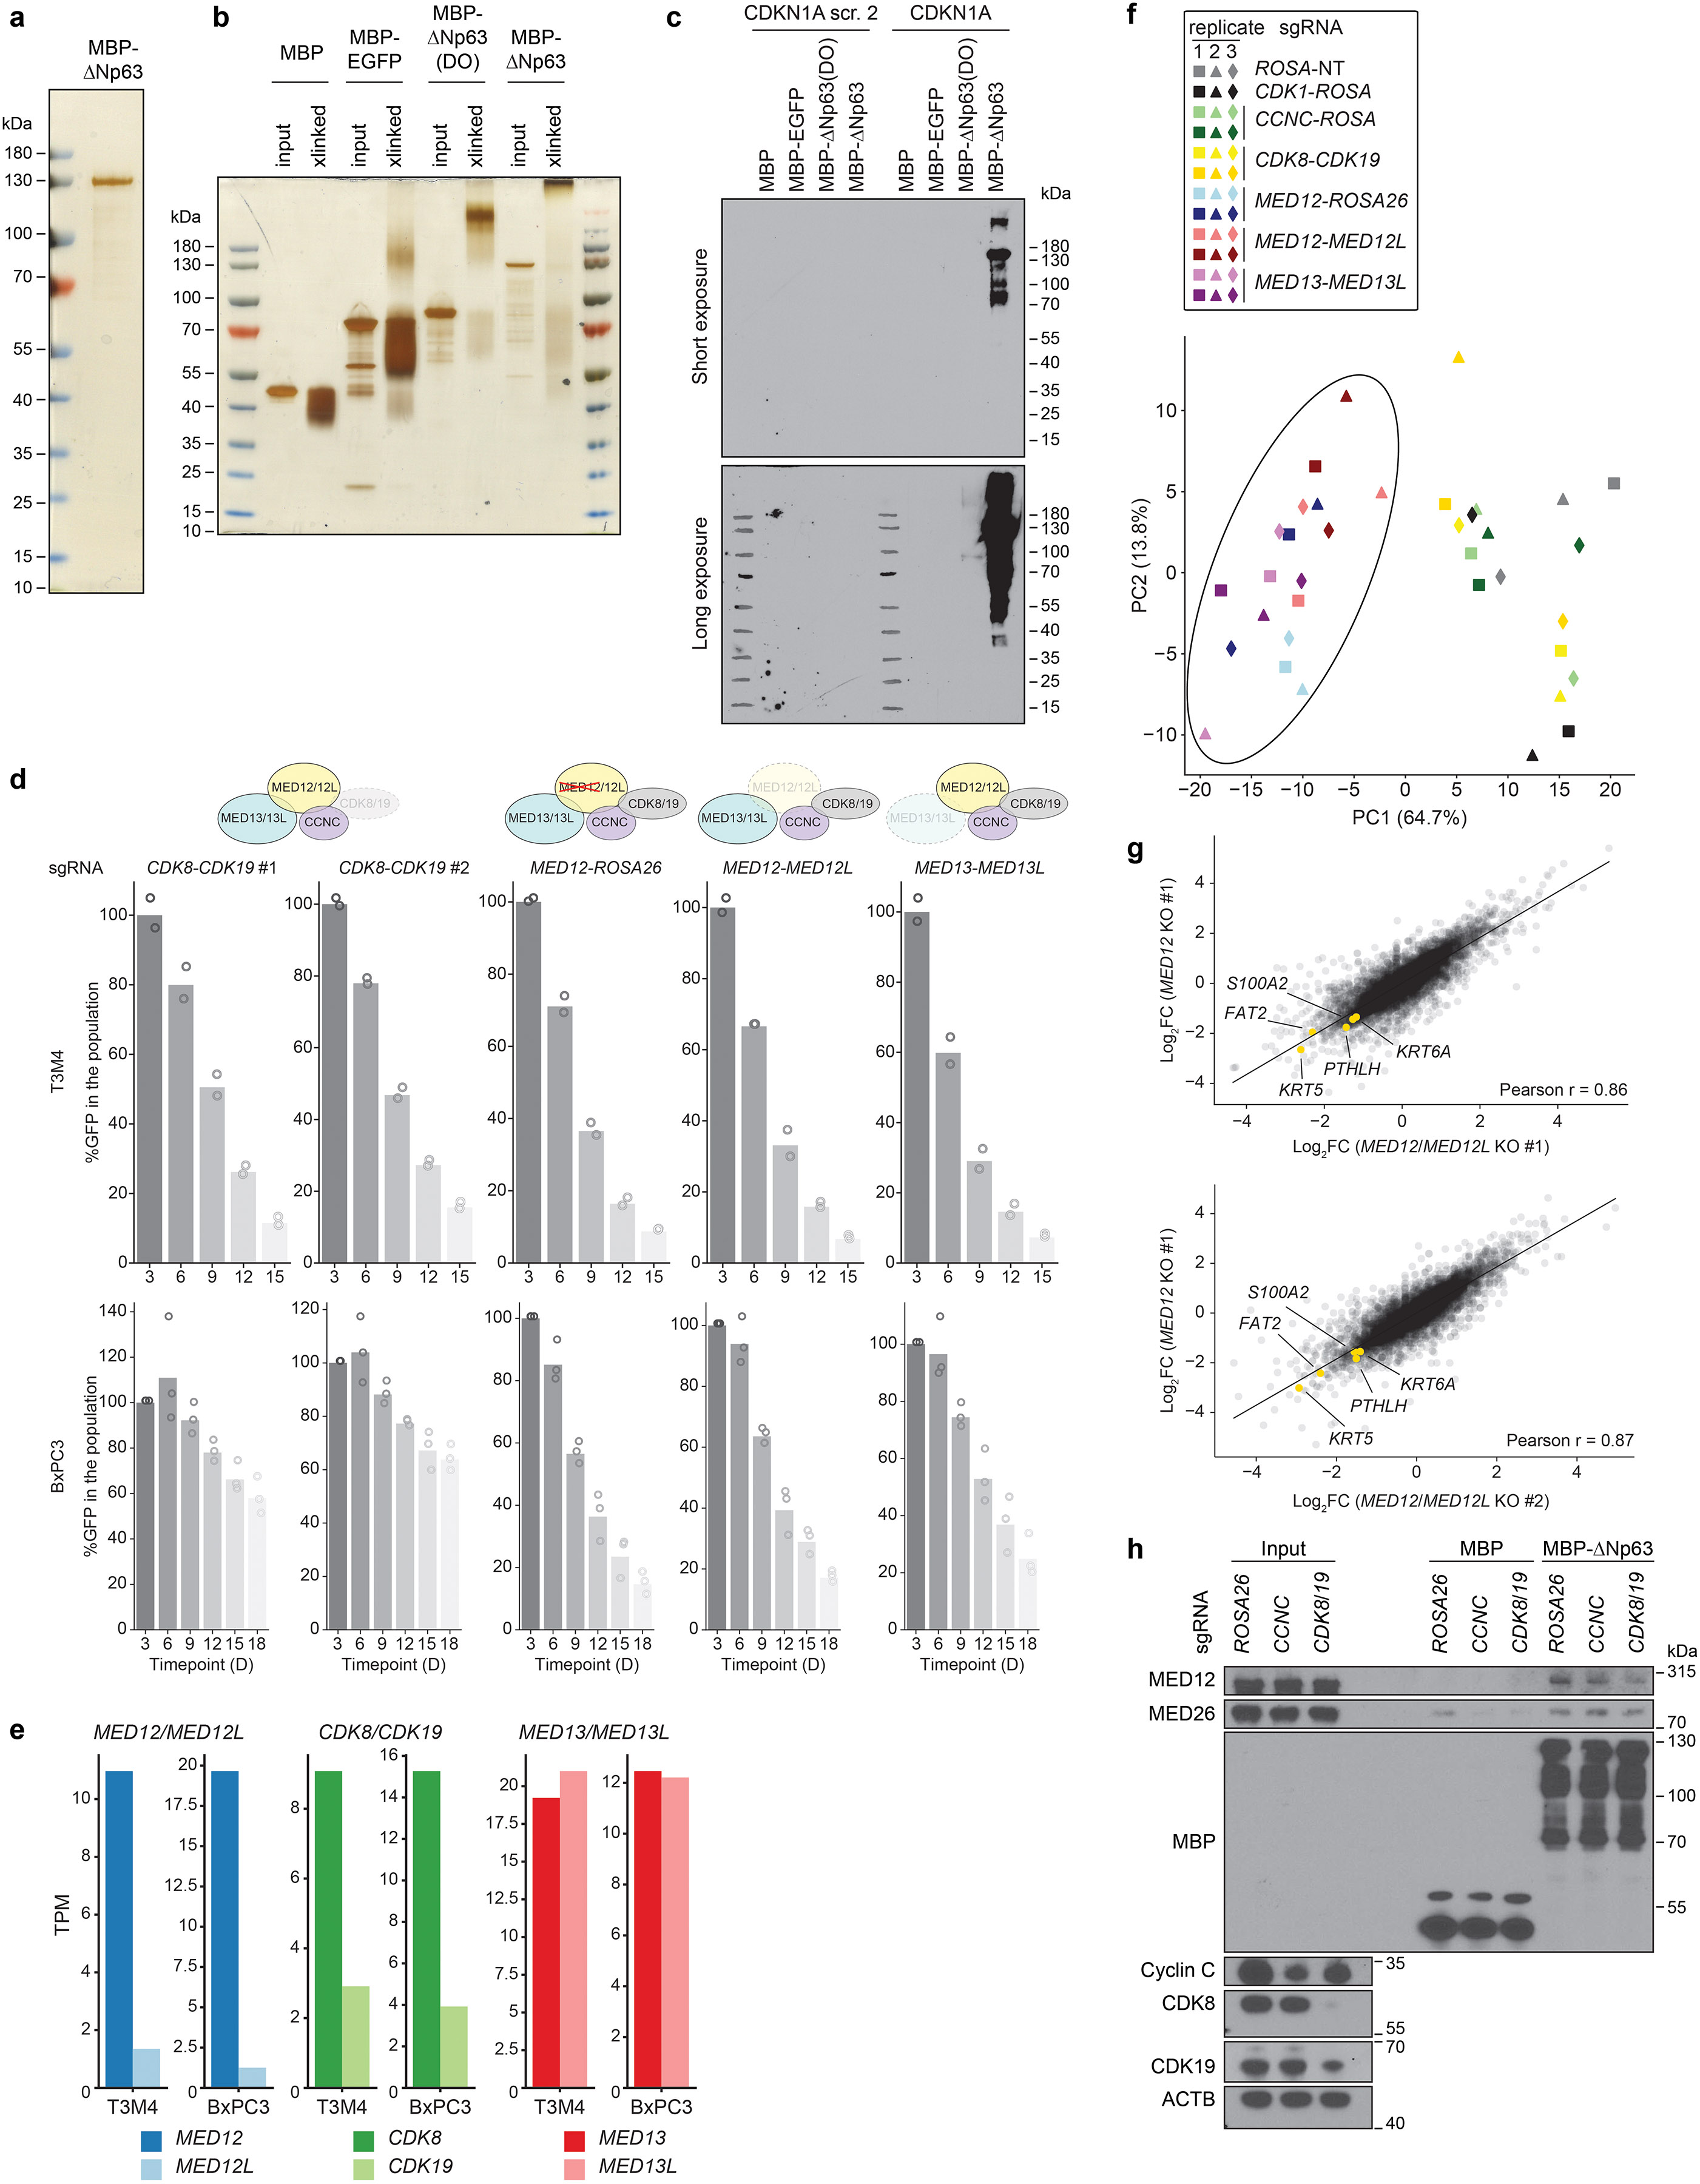
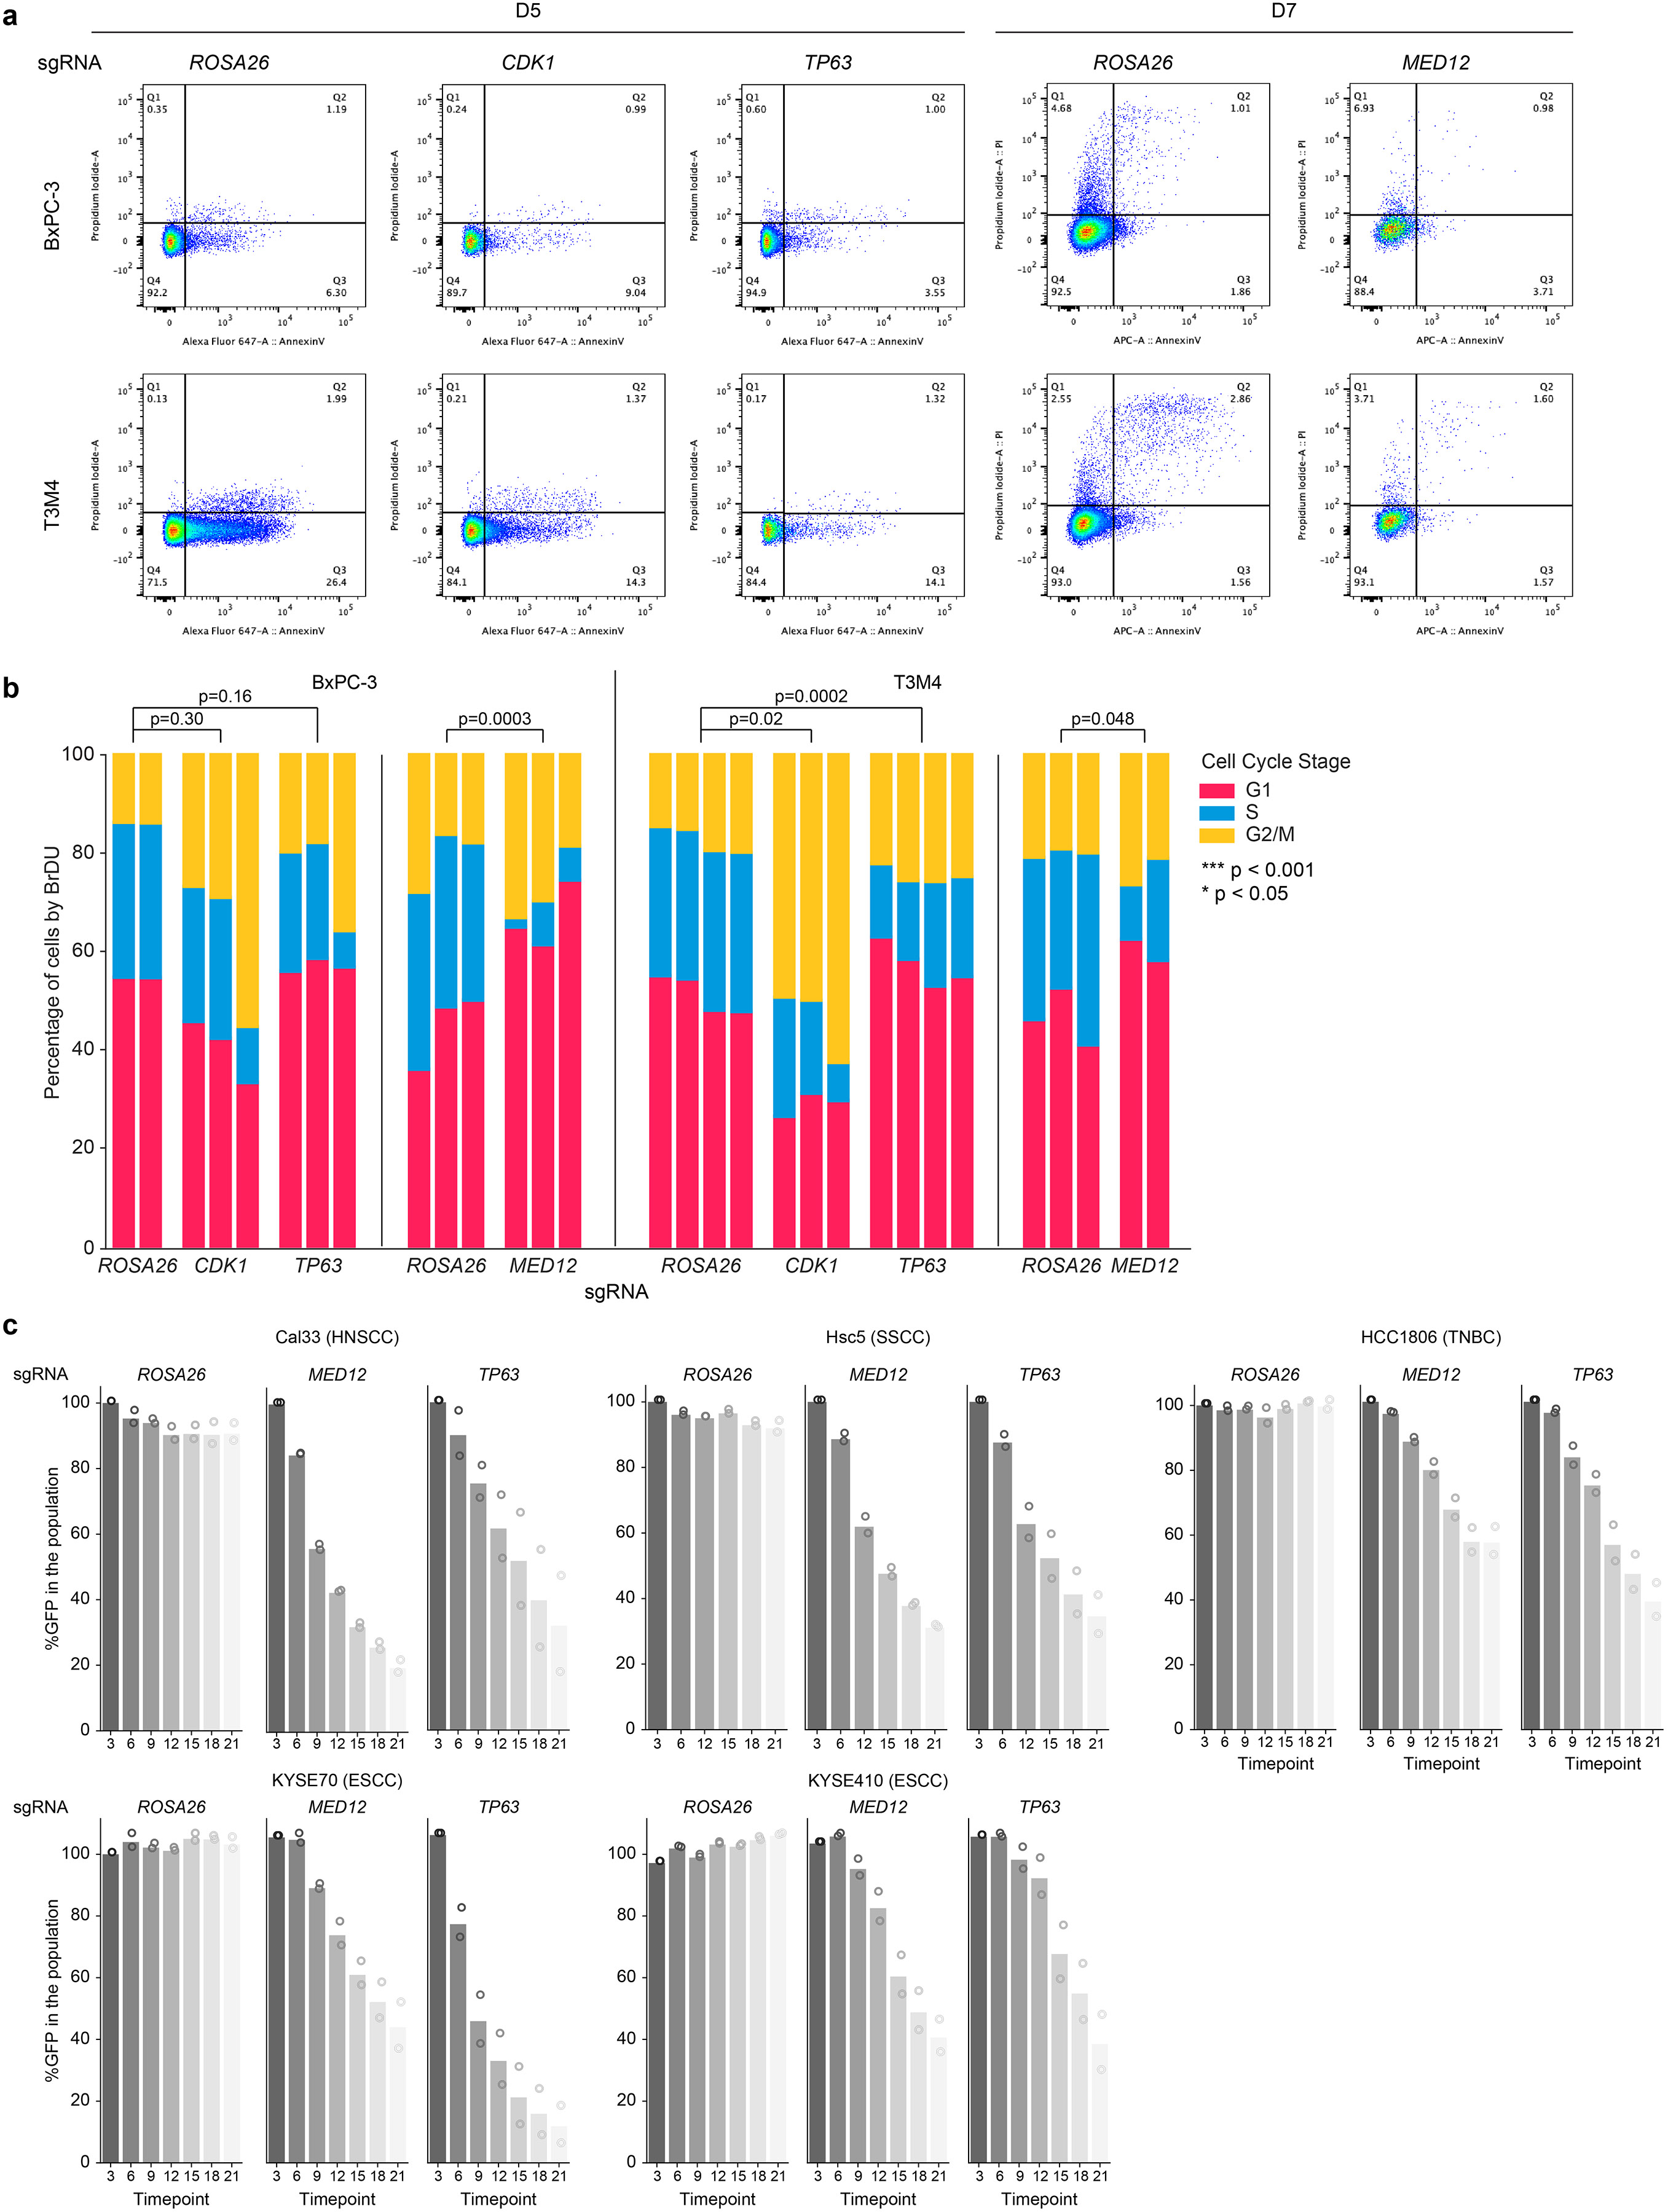
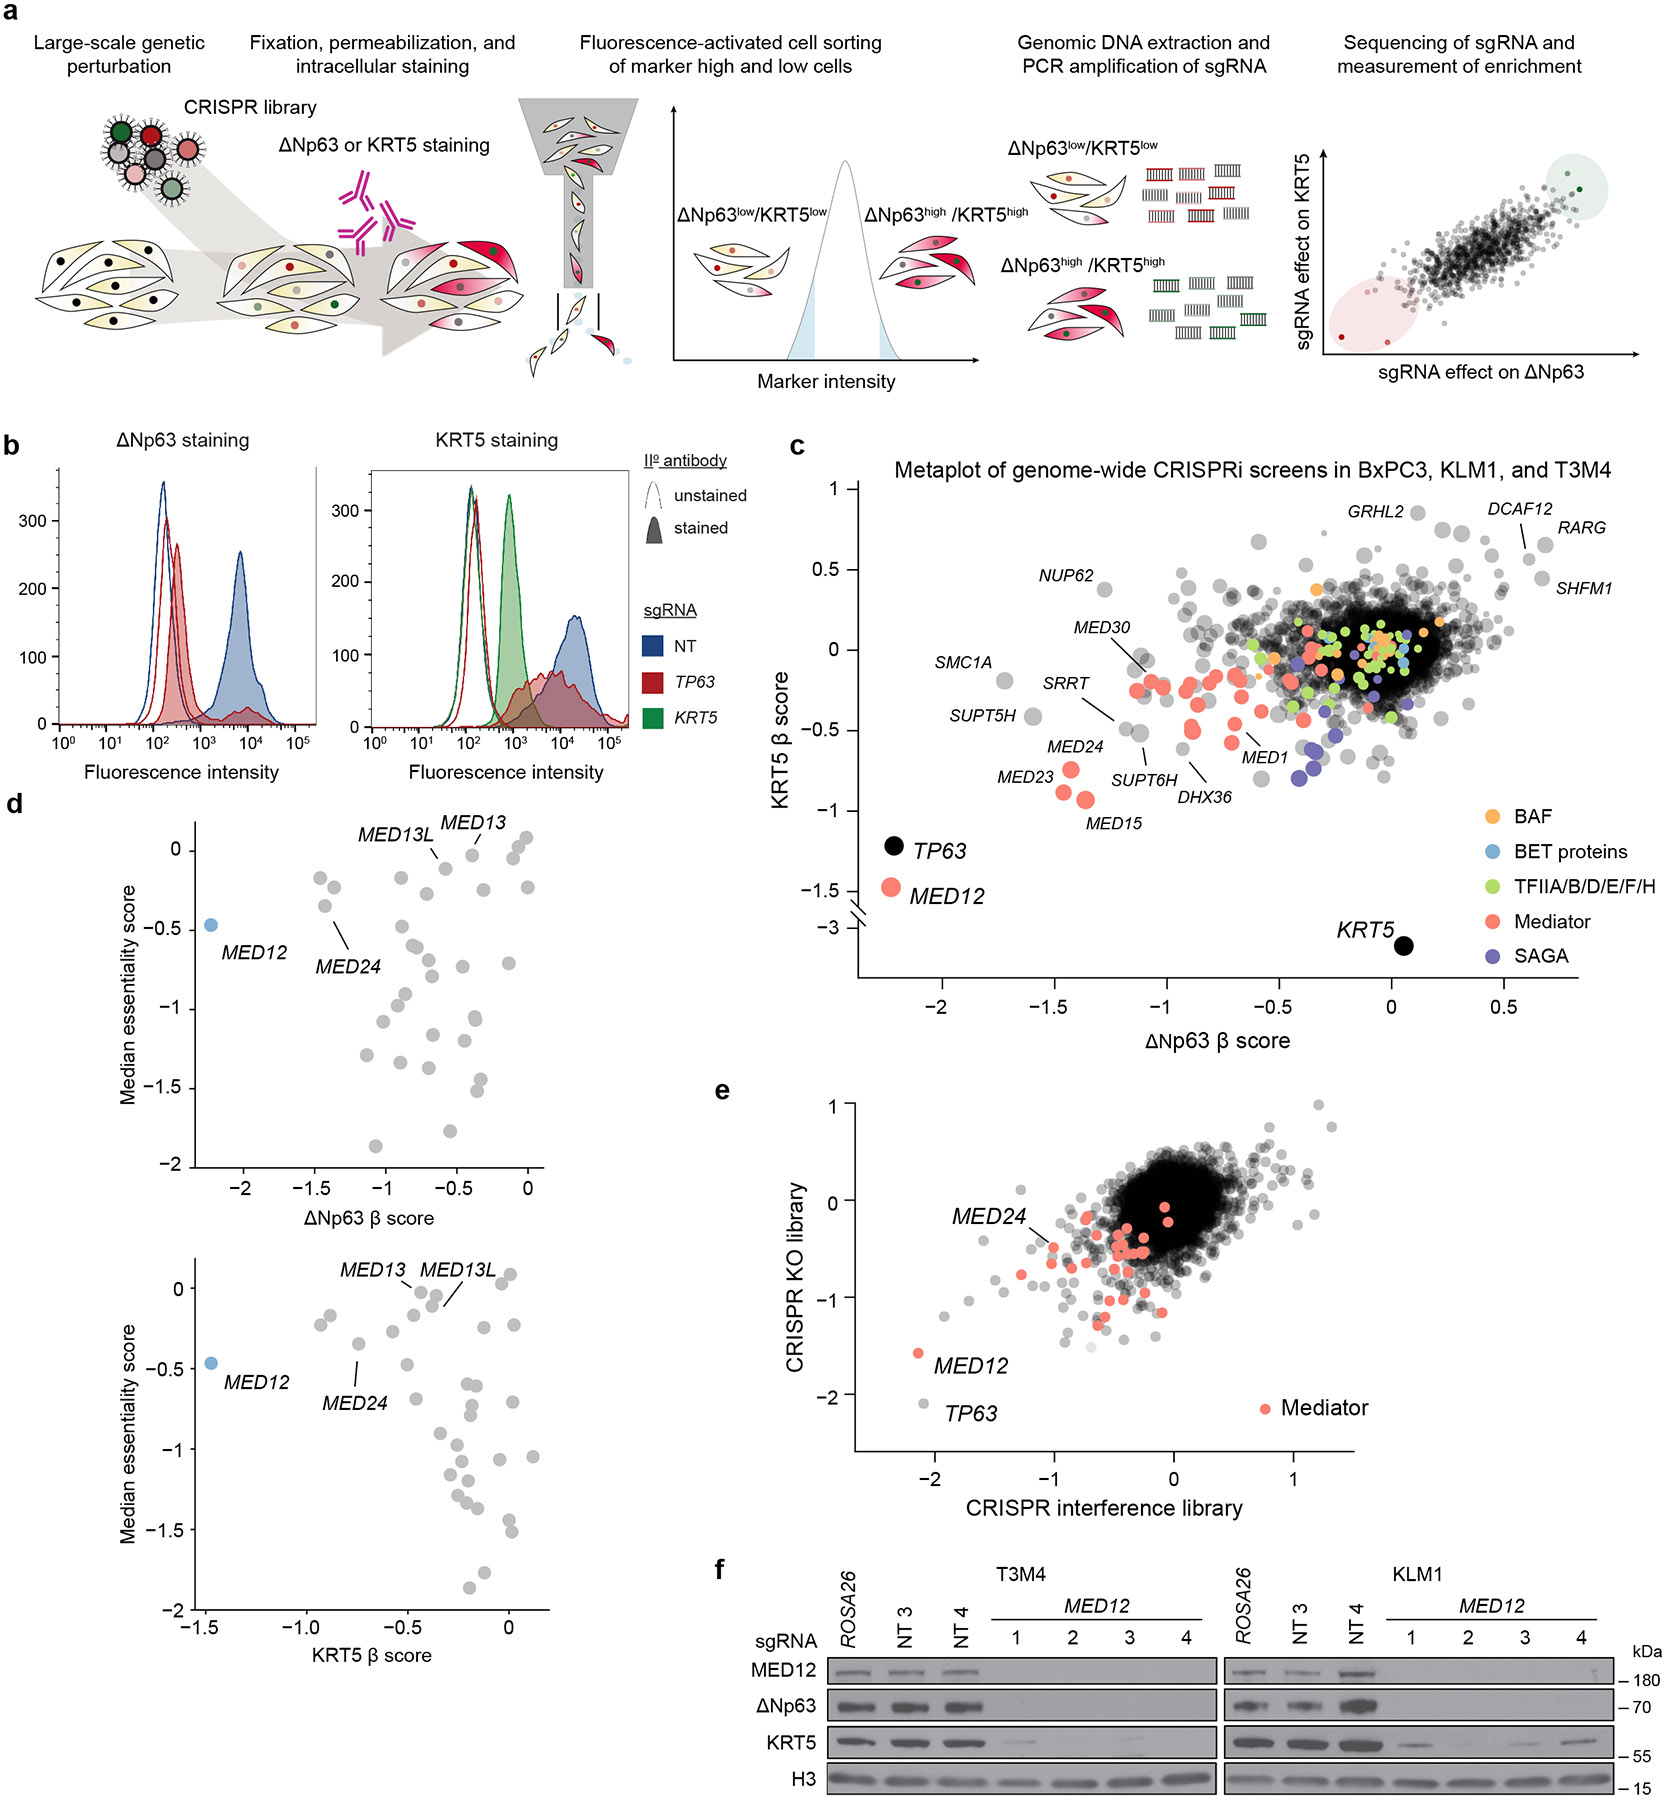
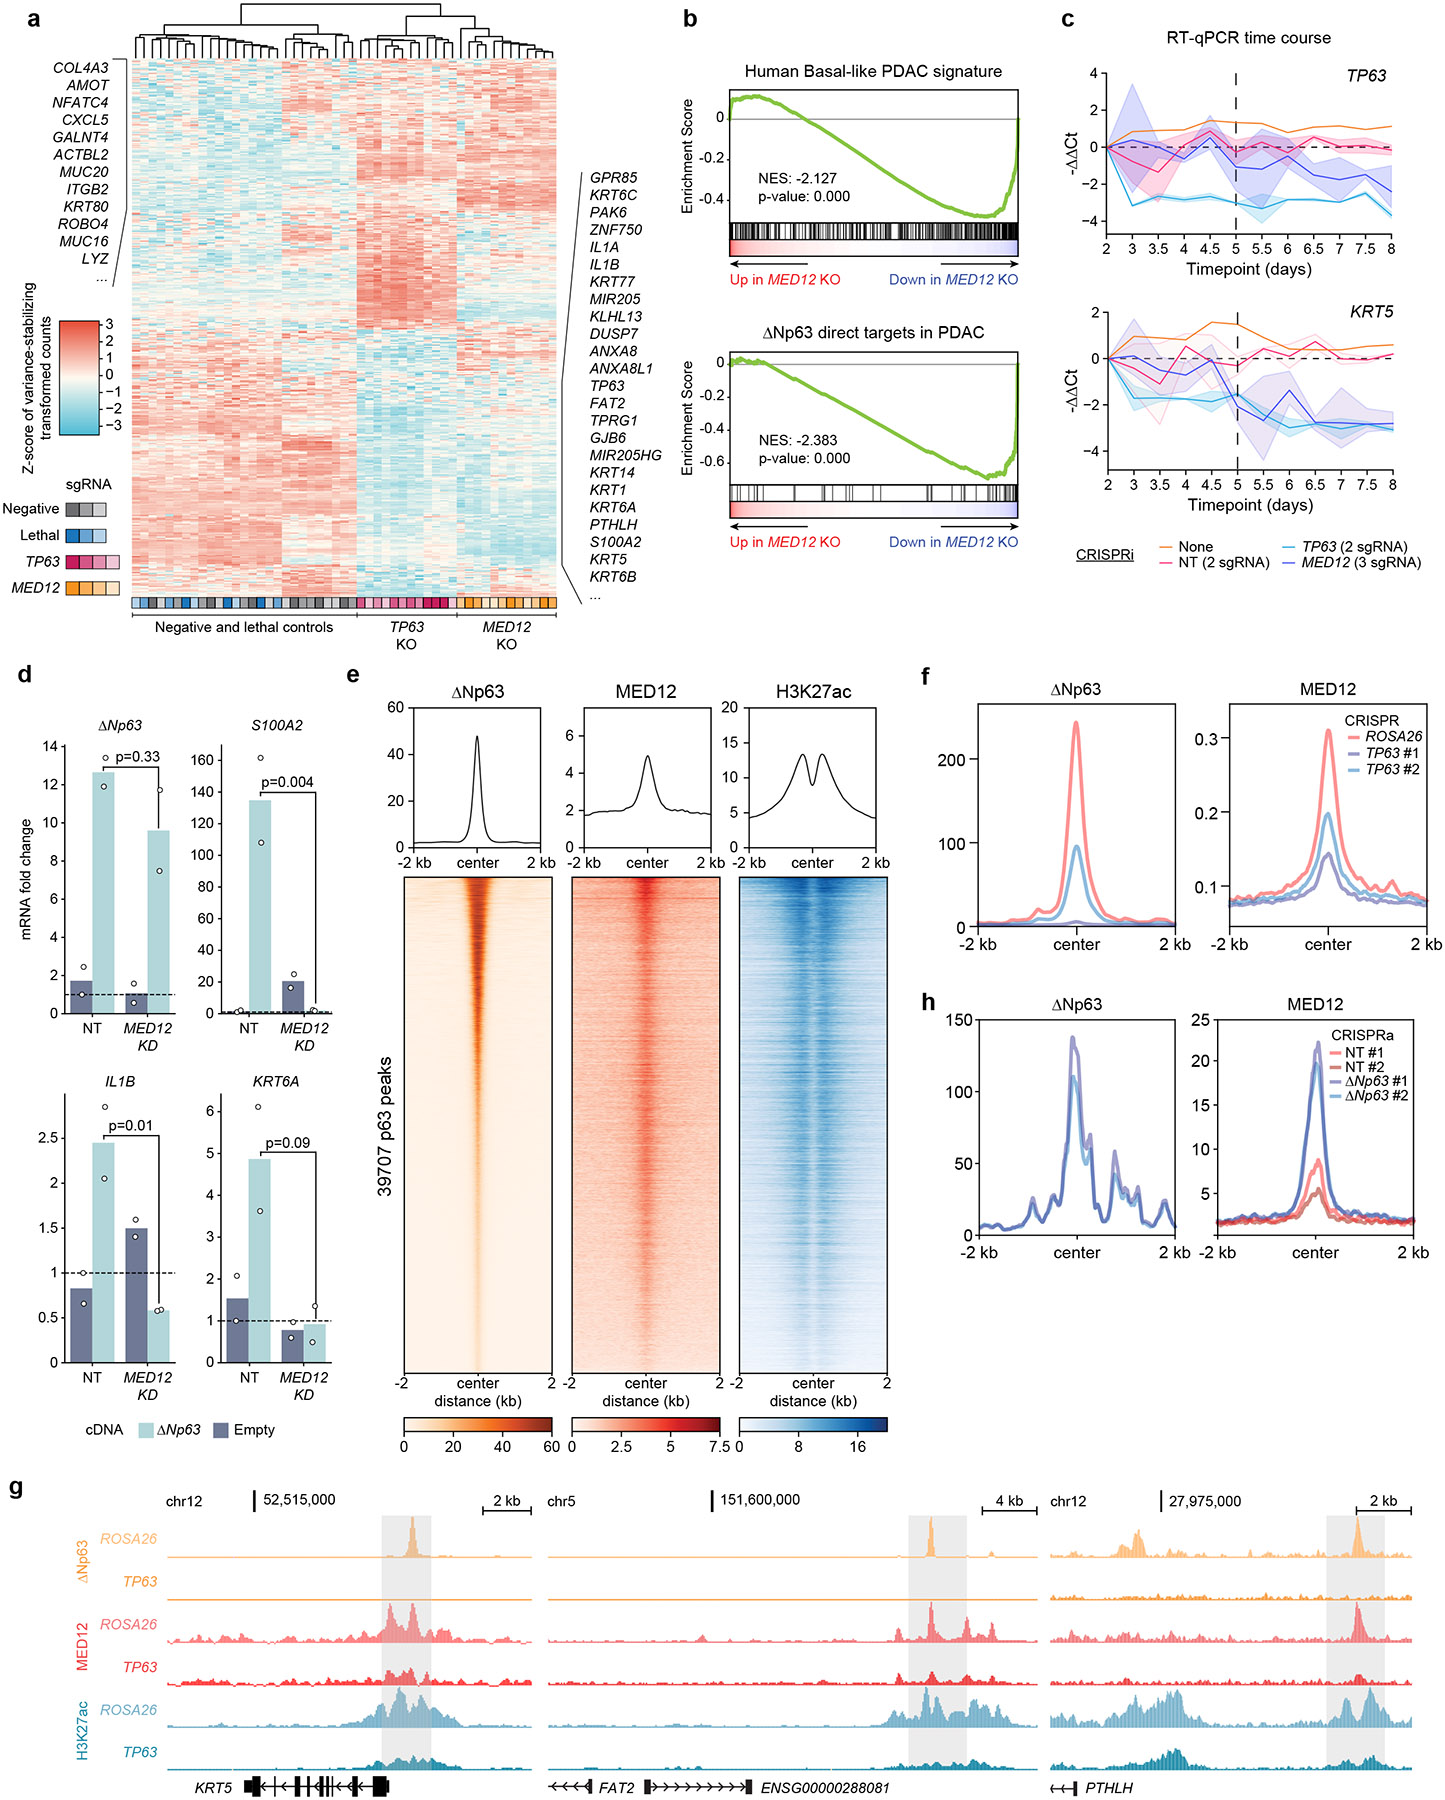
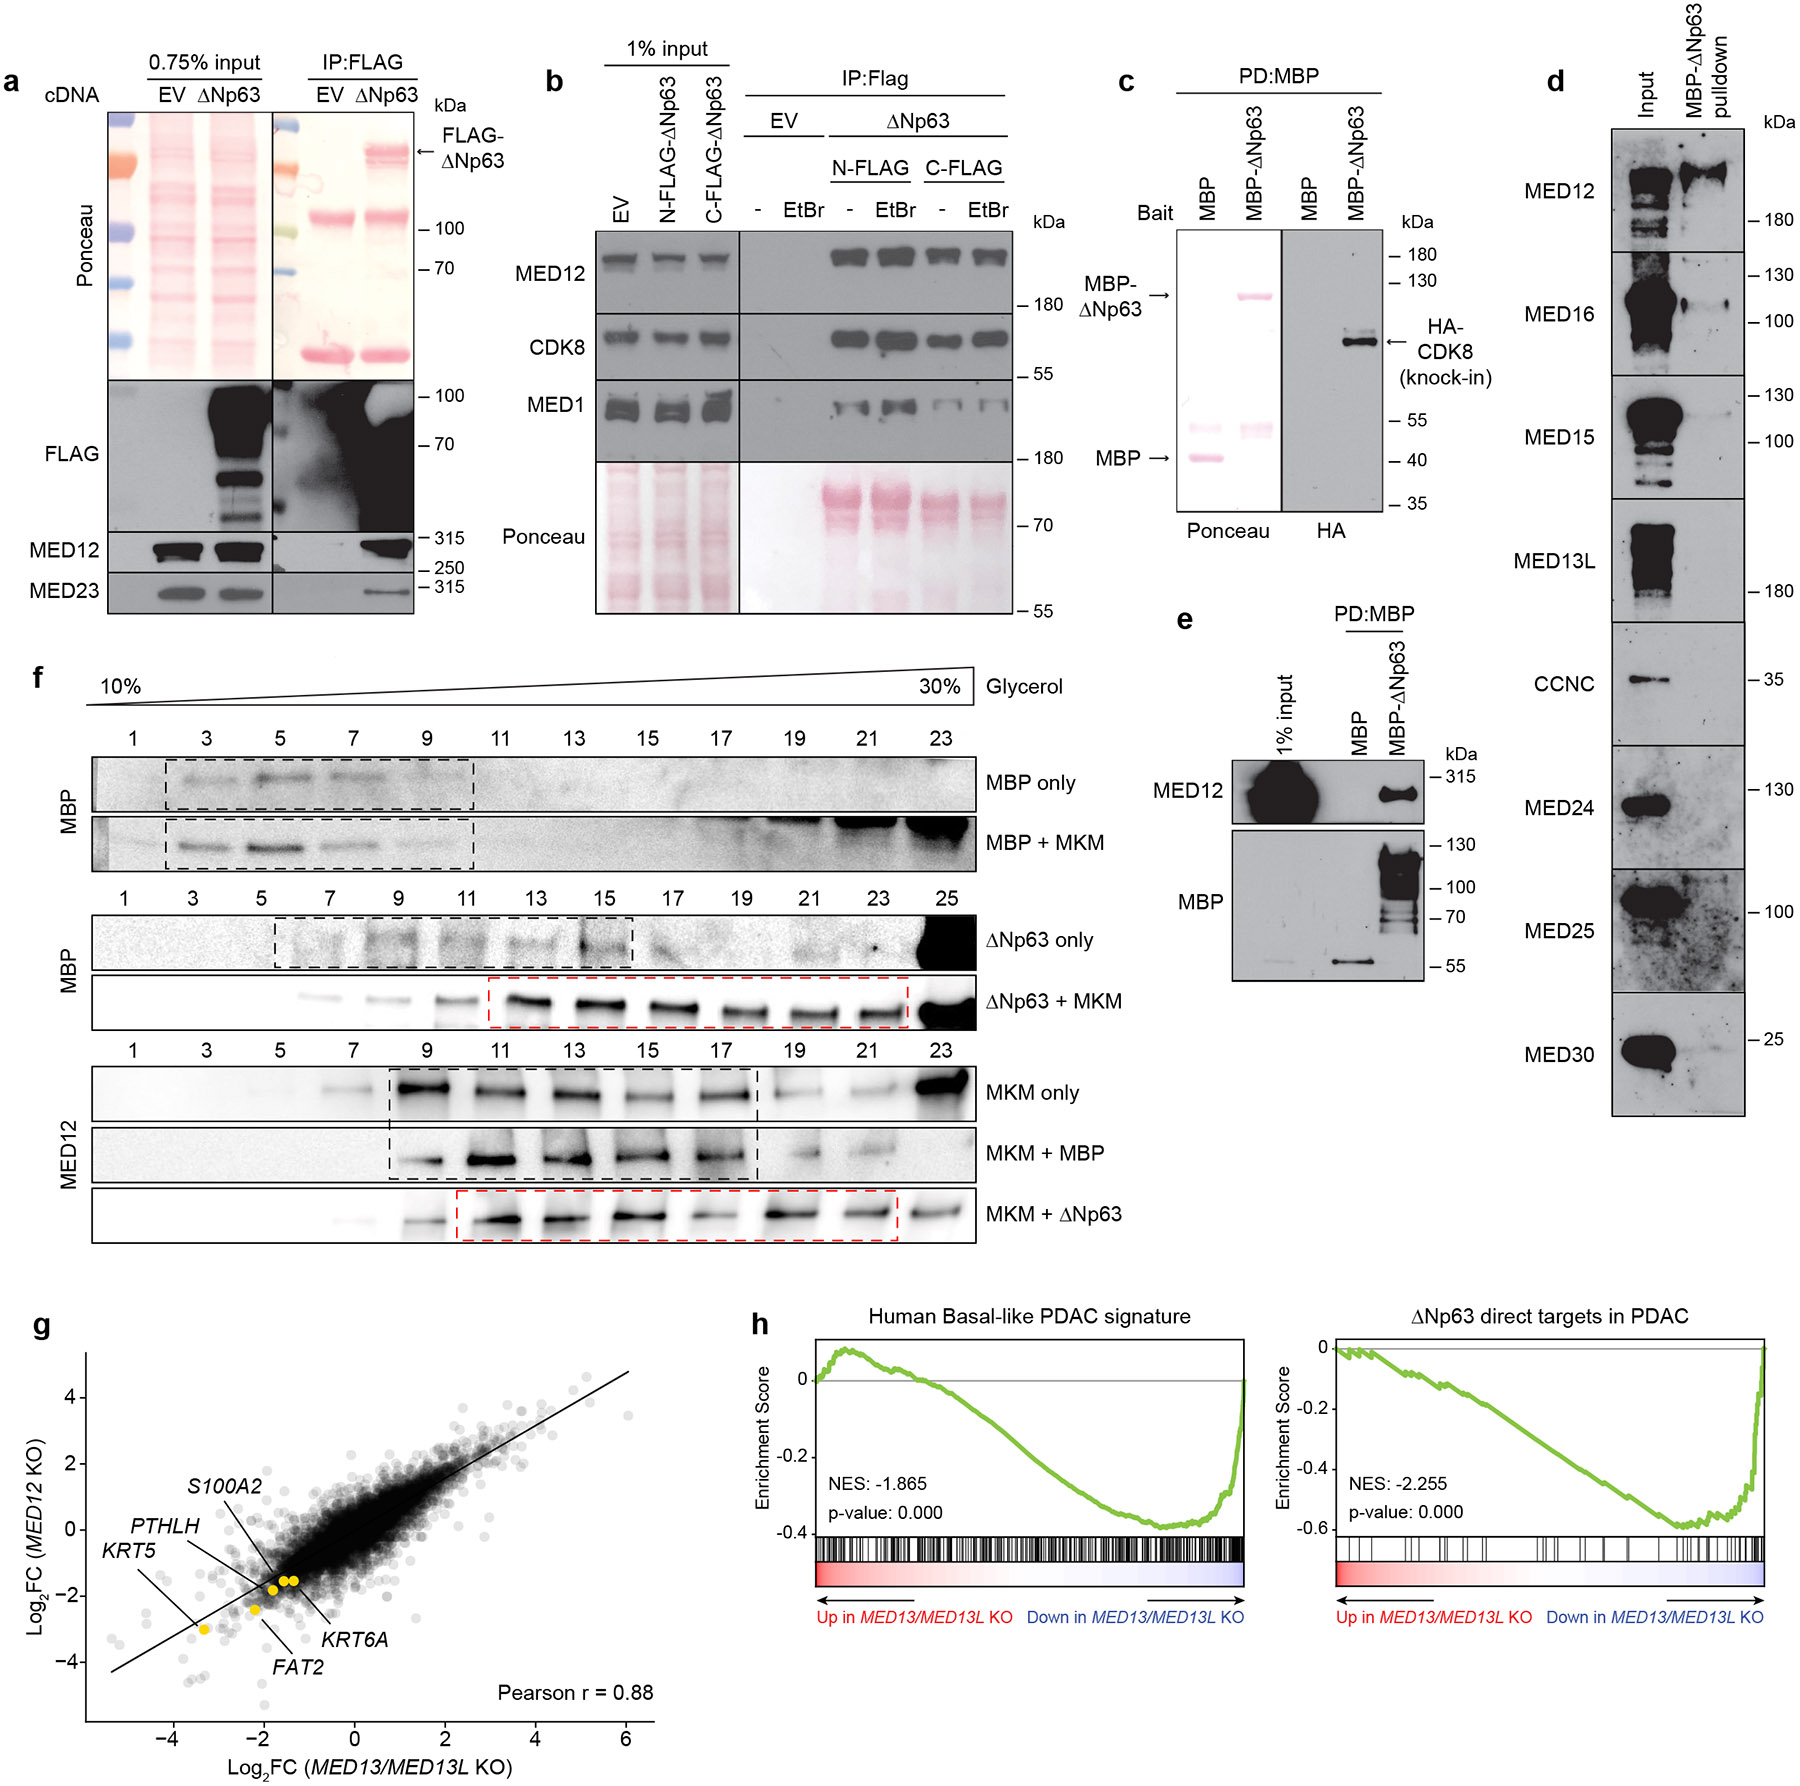
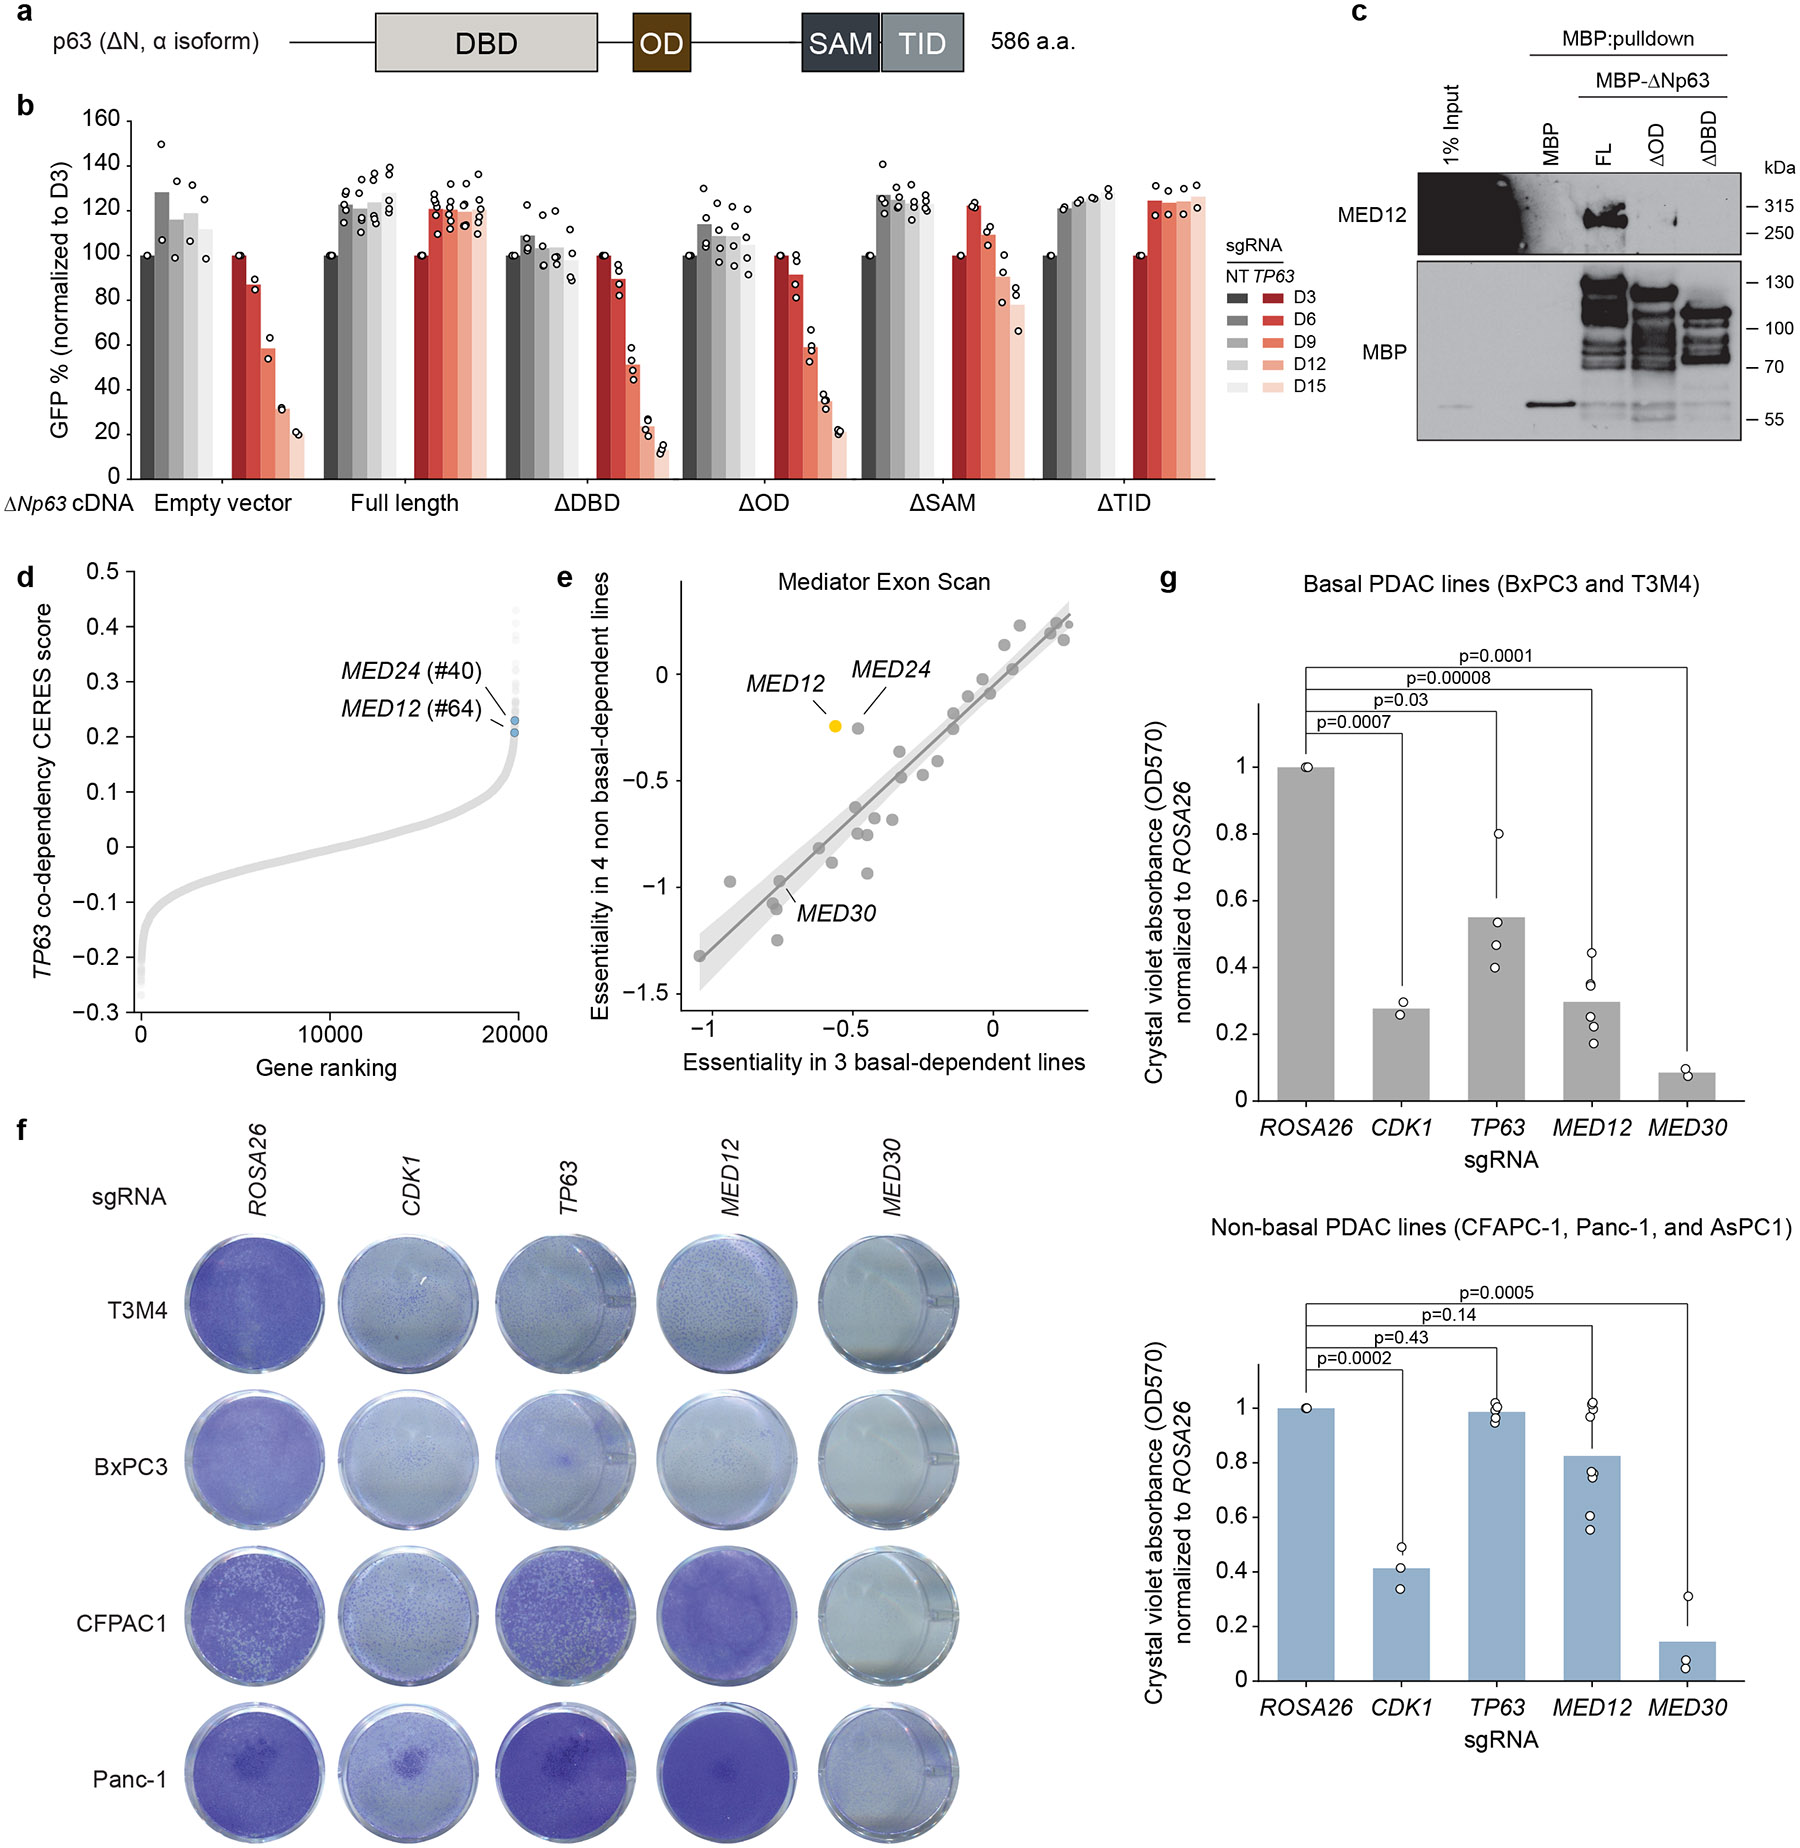
The presence of basal lineage characteristics signifies hyperaggressive human adenocarcinomas of the breast, bladder and pancreas. However, the biochemical mechanisms that maintain this aberrant cell state are poorly understood. Here we performed marker-based genetic screens in search of factors needed to maintain basal identity in pancreatic ductal adenocarcinoma (PDAC). This approach revealed MED12 as a powerful regulator of the basal cell state in this disease. Using biochemical reconstitution and epigenomics, we show that MED12 carries out this function by bridging the transcription factor ΔNp63, a known master regulator of the basal lineage, with the Mediator complex to activate lineage-specific enhancer elements. Consistent with this finding, the growth of basal-like PDAC is hypersensitive to MED12 loss when compared to PDAC cells lacking basal characteristics. Taken together, our genetic screens have revealed a biochemical interaction that sustains basal identity in human cancer, which could serve as a target for tumor lineage-directed therapeutics.


Figures

Extended Data Fig. 1
Extended Data Fig. 1. KRT5 expression is directly regulated by ΔNp63 and MED12 controls basal marker gene expression.
a, Western blot of CRISPRi-mediated TP63 knockdown in KLM1 cells. b, ChIP–seq genomic occupancy tracks zoomed in the KRT5 locus. The two upper tracks show normalized enrichment of endogenous (BxPC3) or overexpressed (ΔNp63-FLAG SUIT2) ΔNp63. The bottom four tracks show H3K27ac normalized enrichment after GFP or ΔNp63 overexpression in SUIT2 cells or ROSA26 or TP63 knockout in BxPC3 cells. ChIP signal was calculated using deepTools with the option BamCompare subtract to normalize each sample to its input. All tracks plotting ChIP data obtained with the same antibody are plotted in the same scale. c–e, Western blot of basal-like markers in TP63 or MED12 knockout human patient-derived basal-like PDAC organoid hF3 (c), HNSCC (Cal33), SSCC (Hsc5), basal-like TNBC (HCC1806) and ESCC (KYSE70 and KYSE410) human cancer cell lines (d), and patient-derived TNBC organoid NH93T (e). HNSCC: head and neck squamous cell carcinoma; SSCC: skin squamous cell carcinoma; TNBC: triple-negative breast cancer; ESCC: esophageal squamous cell carcinoma.
Extended Data Fig. 2
Extended Data Fig. 2. MED12 and ΔNp63 co-regulate the basal gene expression program.
a, Representative GSEA plots of KLM1 MED12 knockout using gene signatures derived from human basal PDAC tumors and direct ΔNp63 gene targets in PDAC. Three biological replicates were used for each sample. Complete GSEA analysis for all the sgRNA and cell lines tested can be found in Supplementary Table 3. b, Representative GSEA plots of HCC1806 (basal-like TNBC) and Cal33 (HNSCC) MED12 knockout using ΔNp63 target gene signatures. Two biological replicates were used for each sample, and two different sgRNAs were tested per gene. Complete GSEA analysis for all the sgRNA tested can be found in Supplementary Table 4. c, UMAPs of BxPC3 (top row), T3M4 (middle row) and hF3 (bottom row) scRNA-seq upon CRISPR knockout of TP63 or MED12. Each unique cell sequenced is colored according to its knockout genotype on the leftmost column to illustrate the distribution of cells in the UMAP. UMAP heatmaps colored by intensity of basal-like PDAC, classical PDAC and Interferon alpha/beta (MSigDB R-HSA-909733 v2023.1) signatures are shown on the right. Pre-processing and data filtering were performed as described in Methods. d, Violin plots of gene expression of basal-like marker genes KRT5 and KRT6A, classical genes GATA6 and CEACAM6 and Interferon-related genes IFI6 and IFI27 across BxPC3, T3M4 and hF3 knockout scRNA-seq. When density of cells expressing non-negligible levels of assessed genes was low across all conditions, individual cell expression values were depicted as single dots. e, Time-course RT-qPCR of S100A2 after lentiviral infection with CRISPRi sgRNA targeting TP63 (2 sgRNA), MED12 (3 sgRNA), non-targeting sgRNAs (2 sgRNA) or uninfected control T3M4 cells. −ΔΔCt values are plotted as the average of each sgRNA normalized to the average of housekeeping genes ACTB and B2M (three measurements per condition). For each gene perturbation, the average −ΔΔCt value is shown in a solid line, and the 95% confidence intervals are shown as translucid intervals. The inflection points of TP63 and other basal markers upon MED12 knockdown (~day 5) is marked by a vertical black dashed line.
Extended Data Fig. 3
Extended Data Fig. 3. MED12 and ΔNp63 co-occupy basal-like loci.
a, Metaplot of genomic occupancy of ΔNp63 and MED12 centered around ΔNp63 peaks in T3M4 cells. b, ChIP–seq tracks of ΔNp63, MED12 and H3K27ac normalized occupancy at select basal-specific ΔNp63 direct target loci in KLM1 cells upon ROSA26 or TP63 knockout (sgRNA, 2). Normalized enrichment values were generated with deepTools bamCoverage -RPCG. c, Western blot of SUIT2 CRISPR-activated TP63 (ΔNp63 isoform-specific) cells. BxPC3, which endogenously expresses the ΔN isoform of p63, is shown as a positive control in the rightmost lane. d, Genomic tracks of ΔNp63 and MED12 occupancy at direct ΔNp63 targets ANXA8, S100A2 and ANXA8L1 in SUIT2-VPR lines infected with non-targeting (NT) or TP63-targeting sgRNAs. a,b,d, One independent measurement is shown per condition.
Extended Data Fig. 4
Extended Data Fig. 4. Characterization of recombinantly expressed and purified full length MBP-p63 protein and MKM-dependent association of ΔNp63 with Mediator.
a, Silver stain of full length purified MBP-ΔNp63. The single protein band was confirmed to be the expected MBP-ΔNp63 peptide by western blotting and mass spectrometry. b, Silver stain of 0.025% glutaraldehyde crosslinked (‘xlinked’) and input purified full length MBP-ΔNp63, MBP-ΔNp63 truncation mutant (DO, DBD through OD), MBP-EGFP or MBP alone. c, Western blot of DNA pulldown experiment using purified proteins and biotinylated DNA oligos containing the p63-binding sequence of the CDKN1A promoter or a scramble DNA control. d, Competition-based proliferation assays in Cas9-expressing T3M4 (top row) and BxPC3 (bottom row) cells after lentiviral expression of the indicated sgRNA pairs linked with GFP. Bars represent the mean normalized percentage of GFP to day 3 after infection, and dots represent independent measurements (n=3 biological replicates). e, Transcripts per million gene expression levels of paralog pairs of the MKM in T3M4 and BxPC3 cell lines. Data extracted from the CCLE dataset. f, Principal component analysis of gene expression changes upon MKM paralog double knockout. MED12, MED12/MED12L and MED13/MED13L double knockouts are encircled together. g, Scatterplots depicting gene expression changes in MED12 or MED12/MED12L knockout T3M4 cells. DESeq2-derived log2(FC) of all significantly expressed genes in three biological replicates per sgRNA are plotted. Select basal genes are highlighted in yellow. h, Western blot of MBP or MBP-ΔNp63 pulldown of endogenous Mediator components from nuclear lysates of ROSA26, CCNC or CDK8/CDK19 knockout HEK293T cells.
Extended Data Fig. 5
Extended Data Fig. 5. MED12 is a preferential genetic dependency in basal-like PDAC.
a, Western blots of T3M4 cells stably expressing N-FLAG-tagged overexpressed truncated ΔNp63 cDNA used in gene complementation assays in Fig. 4b. b, Coomassie blue of purified MBP-ΔNp63 mutants lacking the DNA-binding domain (ΔDBD) or oligomerization domain (ΔOD). c, Crystal violet staining of basal-like (T3M4, BxPC3) or classical (CFPAC1, Panc-1) knockout cell lines of TP63, MED12, or pan-essential core Mediator subunits MED11 and MED14. d, Luminescence reading of CellTiter-Glo assay at day 8 post-infection with lentivirally-encoded sgRNA (n=2–3 independent replicates). Two-sided t-test p-values are shown in the figure. e, Orthotopically transplanted basal-like ΔNp63+ (T3M4) or ΔNp63- (Panc-1) knockout cells were followed over time by luciferase imaging (n=4 mice per group per cell line). Growth of TP63 and MED12 knockout tumor cells was compared with that of negative control (ROSA26 targeting sgRNA) and core Mediator (pan-essential MED30) knockout. Average of independent sample measurements is shown per timepoint, with error bars depicting the standard error of the mean. f, Resected tumor weight at endpoint in T3M4 and Panc-1 knockout cells (n=4 mice per group per cell line). Independent tumor samples are shown as dots, and their average value is shown as bars along with error bars depicting the standard error of the mean. The fold decrease in tumor mass compared to ROSA26 knockout is shown next to the bar of each additional knockout condition. A one-way ANOVA was conducted to detect any overall differences among the groups, followed by Dunnett’s test to compare each sgRNA knockout against the ROSA26 knockout control. P-values are displayed to indicate the significance of these comparisons. g, Images of resected of T3M4 and Panc-1 orthotopic tumors. An asterisk indicates that despite initial injection of tumor cells, no tumor mass could be found at endpoint.
Extended Data Fig. 6
Extended Data Fig. 6. Flow cytometry-based cell cycle profiling reveals growth arrest in TP63 and MED12 knockout cells.
a, Flow cytometry plots of BxPC3 (top) or T3M4 (bottom) knockout cells stained with propidium iodide (y-axis) and AF647-Annexin V (x-axis). Events shown were previously gated on singlets by FSC-H vs FSC-W. Percentages of events relative to the total number of gated events is shown in each quadrant. b, Stacked bar plot representing the distribution of singlets in each cell cycle phase by BrdU staining in BxPC3 (left) or T3M4 (right) knockout cells. Each stacked bar represents the distribution of events for an independent measurement. Two-sided t-test p-value of proportion of cells in S phase are shown in the figure. c, Competition-based proliferation assays in Cas9-expressing Cal33 (HNSCC), Hsc5 (SSCC), HCC1806 (TNBC), KYSE70 (ESCC) and KYSE410 (ESCC) after lentiviral expression of TP63- or MED12-targeting sgRNAs. Bars represent the mean percentage GFP normalized to day 3 post-infection, and dots represent independent measurements (n=2 biological replicates). HNSCC: head and neck squamous cell carcinoma; SSCC: skin squamous cell carcinoma; TNBC: triple-negative breast cancer; ESCC: esophageal squamous cell carcinoma.
Fig. 1.
Fig. 1.. Intracellular FACS-based genome-wide CRISPR screens uncover MED12 as a critical regulator of basal lineage identity in PDAC.
a, Diagram illustrating the workflow of KRT5 or ΔNp63 genome-wide reporter screens. b, Representative flow cytometry staining profiles for CRISPRi-mediated TP63 or KRT5 knockdown in KLM1 cells. Secondary staining with AF647-conjugated anti-rabbit antibody (area-filled curves) or unstained controls (outline-only curves) show the signal distribution of ΔNp63- (left) or KRT5- (right) stained cells upon gene knockdown. A minimum of 10,000 events were collected and plotted for each sample. c, Metaplot of ΔNp63- and KRT5-based reporter genome-wide CRISPRi screen results in 3 independent cell lines (KLM1, T3M4 and BxPC3). Average β scores of ΔNp63 and KRT5 screens are plotted such that each dot represents one promoter-defined gene. The size of each dot is proportional to the inverse of the standard deviation of the β values across cell lines. Important mammalian general transcriptional regulators are highlighted according to the legend. β scores were calculated using MAGeCK with the MLE option, with negative β scores denoting enrichment in the markerlow population. d, Scatterplot of the average β scores in the ΔNp63 (top) or KRT5 (bottom) reporter screens across KLM1, T3M4, and BxPC3, and the median CERES cancer cell line essentiality score from the Cancer Dependency Map. e, Scatterplot of ΔNp63-based reporter screens β scores using genome-wide CRISPRi or CRISPR knockout libraries in KLM1 cells. Genes belonging to the Mediator complex are highlighted in red. f, Western blot of whole cell lysates at day 6 post-infection with lentiviral CRISPR knockout sgRNA targeting MED12 or negative control sgRNAs in T3M4 and KLM1 cells.
Fig. 2.
Fig. 2.. ΔNp63 recruits MED12 to chromatin to coactivate the basal transcriptional signature.
a, Heatmap of z-scored variance-stabilizing transformed gene counts of top 250 overexpressed and downregulated genes upon TP63 knockout in T3M4 cells. Columns correspond to individual knockout RNA-seq samples (n=3 biological replicates per sgRNA). Samples are clustered using Euclidean distance. Genes associated with basal (right) and classical (left) PDAC are labeled. b, Representative GSEA plots of T3M4 MED12 knockout using gene signatures derived from human basal PDAC tumors and direct ΔNp63 gene targets in PDAC. GSEA analysis for all sgRNA and cell lines tested can be found in Supplementary Table 3. c, Time-course RT-qPCR of TP63 and its target gene KRT5 after CRISPRi knockdown of TP63, MED12, or controls in T3M4 cells. −ΔΔCt values are plotted as the average of all sgRNA targeting each gene normalized to the average of ACTB and B2M (three measurements per condition). Average −ΔΔCt of independent sgRNA are shown as solid lines and the respective 95% confidence intervals as translucid intervals. d, RT-qPCR of TP63 and its target genes S100A2, IL1B, and KRT6A after ΔNp63 overexpression and MED12 CRISPRi knockdown. mRNA fold change values are calculated as 2−ΔΔCt normalized to the average of ACTB, B2M, and PPIA. Dots represent the average of 3 measurements per sgRNA, and bars represent the mean of two independent measurements. Double-sided t-test p-values are shown in the figure. e, Metaplots and heatmaps of ΔNp63, MED12, and acetylated H3K27 (H3K27ac) chromatin occupancy in KLM1 cells. Signal intensity values are centered around and sorted by ΔNp63 peak intensity. f, Metaplots of ΔNp63 (left) and MED12 (right) genome occupancy centered around MED12 peaks at basal enhancers in KLM1 cells upon ROSA26 or TP63 knockout (2 different sgRNA). g, ChIP-seq tracks of ΔNp63, MED12, and H3K27ac normalized occupancy at select basal-specific ΔNp63 direct target loci in KLM1 cells upon ROSA26 or TP63 knockout. One additional TP63 knockout sgRNA is shown in Extended Data Fig. 3b. h, Metaplots of ΔNp63 (left) and MED12 (right) genome occupancy centered around MED12-occupied peaks neighboring ΔNp63 direct target genes in SUIT2 CRISPRa-TP63 lines. e,f,h, One independent measurement per condition is shown.
Fig. 3.
Fig. 3.. ΔNp63 directly binds to MED12 and the Mediator Kinase Module to activate the basal lineage program.
a, Representative FLAG immunoprecipitation of transiently transfected ΔNp63-C-3xFLAG in HEK293T nuclear lysates. Ponceau staining and western blot of FLAG and endogenous MKM (MED12) and core Mediator (MED23) subunits are shown for input and IP samples. b, FLAG immunoprecipitation of transiently transfected N-3xFLAG-ΔNp63 or ΔNp63-C-3xFLAG in HEK293T nuclear lysates in the presence or absence of ethidium bromide (EtBr, final concentration of 50μg/mL). Ponceau and western blot of endogenous MKM (MED12, CDK8) and core Mediator (MED1) subunits are shown for input and IP samples. c, MBP-pulldown of purified MBP or MBP-ΔNp63 incubated with nuclear lysates of endogenously tagged N-3xHA-CDK8 HeLa cells. Ponceau (left) shows the immobilized MBP fusion proteins, and HA stains the 3xHA-tagged CDK8. Only pulldown results are shown, as no signal was detected in the 1% input. d, Western blot of MBP-pulldown of purified MBP-ΔNp63 incubated with Sf9 cell lysates expressing different individual human Mediator subunits. 1% input is shown in the left lane. e, MBP pulldown of MBP or MBP-ΔNp63 incubated with human MED12-expressing Sf9 lysates. f, Glycerol gradient sedimentation of purified MBP or MBP-ΔNp63 incubated with human 4-subunit MKM. Glycerol percentages are indicated above the blots; larger complexes will migrate farther down the gradient. Black dashed boxes show glycerol gradient eluted fractions of individual ΔNp63, MBP, or MKM, as well as MBP-MKM incubation samples which did not display shifted migration pattern. Red dashed boxes highlight ΔNp63-MKM glycerol gradients that eluted in size-shifted fractions. g, Scatterplot depicting gene expression changes upon MED12 or MED13/MED13L knockout. DESeq2-derived log2FC of all significantly expressed genes in three biological replicates per sgRNA are plotted. Representative plot of 2 different sgRNA per gene. Select basal genes are highlighted in yellow. h, GSEA plots of MED13/MED13L double knockout (three biological replicates per sgRNA) using gene signatures derived from human basal PDAC tumors (left) and direct ΔNp63 gene targets in PDAC (right). Complete GSEA analysis for all the MKM double knockout sgRNA tested can be found in Supplementary Table 6.
Fig. 4.
Fig. 4.. MED12 is a lineage-biased genetic vulnerability of basal-like PDAC.
a, Diagram of ΔNp63 (N-terminus ΔN, C-terminus α isoform of p63) domain architecture. b, Gene complementation competition-based proliferation assay of different overexpressed ΔNp63 truncation mutants upon endogenous TP63 CRISPRi-induced knockdown. Dots represent the average GFP% difference to day 3 GFP measurements of n=2-4 biologically independent samples, and bars represent their mean. c, MBP pulldown assay using purified MBP, full length MBP-ΔNp63 (FL), or MBP fusion ΔNp63 mutants lacking the oligomerization domain (ΔOD) or DNA-binding domain (ΔDBD). Purified protein was incubated with MED12-expressing Sf9 lysates overnight, followed by pulldown and western blot. d, Pearson r of >17.000 DepMap CERES gene codependencies with TP63 across ~1000 cell lines. e, Scatterplot of mean essentiality scores of all sgRNAs targeting each of 33 genes in the Mediator complex in ΔNp63-dependent (T3M4, BxPC3, and PK-1) and non ΔNp63-dependent (SUIT2, AsPC-1, KLM1, and MiaPaCa-2) cell lines. Linear regression and 95% confidence interval are drawn. f, Crystal violet staining of basal (T3M4, BxPC3) or non-basal (CFPAC1, Panc-1) human PDA lines grown for 10 days after knockout of negative control (ROSA26), lethal control (CDK1), TP63, MED12, or panessential Mediator gene MED30. Additional sgRNA tested are shown in Extended Data Fig. 5c. g, Quantification of re-solubilized crystal violet stain of basal (T3M4, BxPC3; top) or non-basal (CFPAC1, Panc-1, AsPC-1; bottom) grown for 10 days, as quantified by OD570. Dots represent independent OD570 measurements of n=1-3 independent measurements per gene across basal and non-basal cell lines, and bars represent their mean. Two-sided t-test p-values are shown in the figure.

Update of

References

    1. Hanahan D. Hallmarks of Cancer: New Dimensions. Cancer Discov 12, 31–46 (2022). - PubMed
    1. Quintanal-Villalonga Á. et al. Lineage plasticity in cancer: a shared pathway of therapeutic resistance. Nat Rev Clin Oncol 17, 360–371 (2020). - PMC - PubMed
    1. Badve S. et al. Basal-like and triple-negative breast cancers: a critical review with an emphasis on the implications for pathologists and oncologists. Modern Pathol 24, 157–167 (2011). - PubMed
    1. Risom T. et al. Differentiation-state plasticity is a targetable resistance mechanism in basal-like breast cancer. Nat Commun 9, 3815 (2018). - PMC - PubMed
    1. Choi W. et al. Identification of Distinct Basal and Luminal Subtypes of Muscle-Invasive Bladder Cancer with Different Sensitivities to Frontline Chemotherapy. Cancer Cell 25, 152–165 (2014). - PMC - PubMed

METHODS-ONLY REFERENCES

    1. Bhatia S. et al. Patient-Derived Triple-Negative Breast Cancer Organoids Provide Robust Model Systems That Recapitulate Tumor Intrinsic Characteristics. Cancer Res. 82, 1174–1192 (2022). - PMC - PubMed
    1. Li W et al. MAGeCK enables robust identification of essential genes from genome-scale CRISPR/Cas9 knockout screens. Genome Biol 15, 554 (2014). - PMC - PubMed
    1. Dobin A. et al. STAR: ultrafast universal RNA-seq aligner. Bioinformatics 29, 15–21 (2013). - PMC - PubMed
    1. Putri GH, Anders S, Pyl PT, Pimanda JE & Zanini F Analysing high-throughput sequencing data in Python with HTSeq 2.0. Bioinformatics 38, 2943–2945 (2022). - PMC - PubMed
    1. Love MI, Huber W & Anders S Moderated estimation of fold change and dispersion for RNA-seq data with DESeq2. Genome Biol 15, 550 (2014). - PMC - PubMed

MeSH terms

LinkOut - more resources