. 2024 Aug;30(8):2362-2370.
doi: 10.1038/s41591-024-03068-6. Epub 2024 Jun 17.

Peripheral blood mononuclear cell respiratory function is associated with progressive glaucomatous vision loss

Affiliations

Peripheral blood mononuclear cell respiratory function is associated with progressive glaucomatous vision loss

Bledi Petriti et al. Nat Med. 2024 Aug.

Abstract

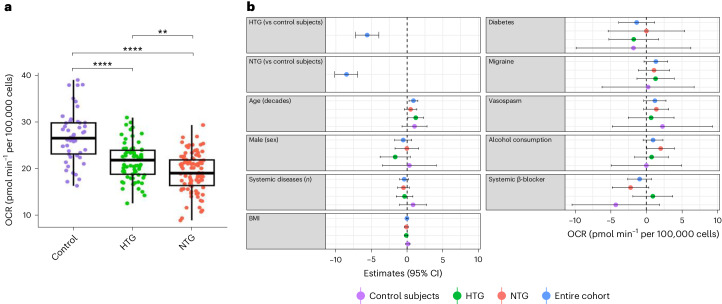
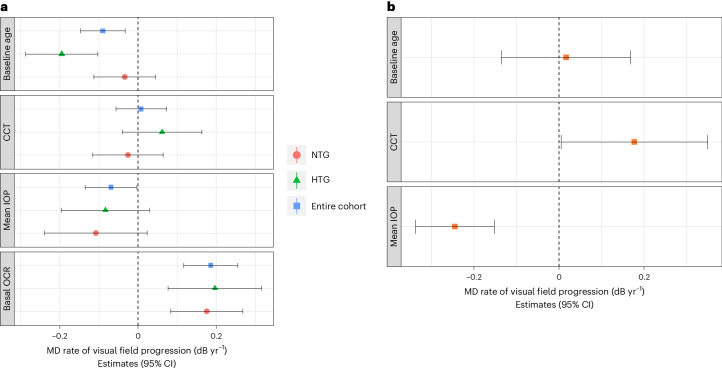
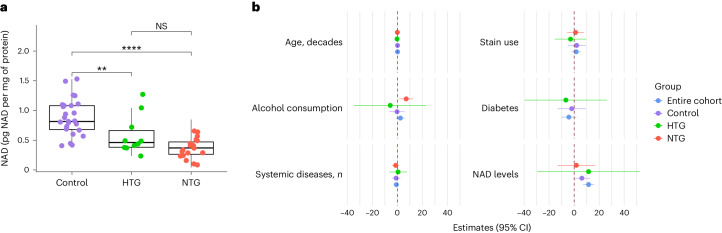
Intraocular pressure (IOP) is currently the only modifiable risk factor for glaucoma and all licensed treatments lower IOP. However, many patients continue to lose vision despite IOP-lowering treatment. Identifying biomarkers for progressive vision loss would have considerable clinical utility. We demonstrate that lower peripheral blood mononuclear cell (PBMC) oxygen consumption rate (OCR) is strongly associated with faster visual field (VF) progression in patients treated by lowering IOP (P < 0.001, 229 eyes of 139 participants), explaining 13% of variance in the rate of progression. In a separate reference cohort of untreated patients with glaucoma (213 eyes of 213 participants), IOP explained 16% of VF progression variance. OCR is lower in patients with glaucoma (n = 168) than in controls (n = 50; P < 0.001) and is lower in patients with low baseline IOP (n = 99) than those with high baseline IOP (n = 69; P < 0.01). PBMC nicotinamide adenine dinucleotide (NAD) levels are lower in patients with glaucoma (n = 29) compared to controls (n = 25; P < 0.001) and strongly associated with OCR (P < 0.001). Our results support PBMC OCR and NAD levels as new biomarkers for progressive glaucoma.


Conflict of interest statement

D.G.-H. received consultation fees from Abbvie, Janssen, Omikron, Roche, Santen and Viatris. G.M. received consultation fees from Alcon and Omikron. G.L. has research funding from Aerie, Abbvie and other remuneration received by Glaukos and Rayner. P.A.W. is an inventor on an awarded US patent held by The Jackson Laboratory for NAM treatment in glaucoma (Treatment and prevention of ocular neurodegenerative disorder, US11389439B2).

Figures

Fig. 1
Fig. 1. Mitochondrial respiration in PBMCs.
a, Box plots and Tukey HSD post hoc test for basal OCR in PBMCs as a function of diagnostic category. OCR was measured using the XFe24 Analyzer in 218 participants (50 controls, 69 HTG and 99 NTG). NTG patients had the lowest basal OCR (mean (s.d.): 19.2 (±4.1) pmol min−1 per 100,000 cells) followed by HTG (mean (s.d.): 21.6 (±3.9) pmol min−1 per 100,000 cells) and controls (mean (s.d.): 26.8 (±5.5) pmol min−1 per 100,000 cells). The box plots display the distribution of basal OCR values within each diagnostic category. Each box plot represents the IQR of the data, with the horizontal line inside the box indicating the median value. The lower and upper bounds of the box represent the first and third quartiles, respectively. The ‘whiskers’ extend to the minimum and maximum values within 1.5 times the IQR from the lower and upper quartiles, respectively. One-way ANOVA with Tukey’s HSD test to control family type I errors for post hoc pairwise comparisons. No adjustment for multiple comparisons was made for all other tests. Specifically, NTG versus control comparison yielded a P value of <0.0001, HTG versus control comparison yielded a P value of <0.0001 and HTG versus NTG comparison yielded a P value of 0.001. Significant differences with **P < 0.01 and ****P < 0.0001. b, Forest plot shows the results of the multivariable linear regression model for factors associated with basal OCR in 218 participants (50 controls, 69 HTG and 99 NTG). Blue, red, green and purple circles represent β estimates from the multivariable regression model, and the horizontal bars represent the corresponding 95% CIs. The model predicts that having NTG is associated with basal OCR being 8.5 pmol min−1 per 100,000 cells lower than controls (P < 0.001) and having HTG is associated with basal OCR being 5.6 pmol min−1 per 100,000 cells lower than controls (P < 0.001).
Fig. 2
Fig. 2. Association of mitochondrial respiration and IOP with VF progression.
a, Forest plot shows the results of the basal OCR mixed effect model for factors associated with the MD VF progression, expressed as dB yr−1. The relationship between the rate of MD change and OCR was evaluated with linear mixed models with random slopes and random intercepts. Blue squares, green triangles and red circles represent standardized estimates, whereas horizontal bars represent their corresponding 95% CIs. All independent variables were standardized (that is, zero mean and unit s.d.). A total of 229 eyes (NTG: 144 eyes, HTG: 85 eyes) of 139 patients were included in this analysis. Older age was associated with faster rates of progression in the entire cohort (for a 10-year increase, estimate (s.e.): −0.09 (0.03) dB yr−1, P = 0.002). Higher mean IOP was associated with faster rates of progression in the entire cohort (for 1 s.d. (2.8 mmHg) increase, estimate (s.e.): −0.07 (0.03) dB yr−1, P =0.04). Lower basal OCR was associated with faster rates of progression in the entire cohort (for 1 s.d. (4.3 pmol min−1 per 100,000 cells) reduction, estimate (s.e.): 0.19 (0.04) dB yr−1, P < 0.001), NTG cohort (for 1 s.d. (4.1 pmol min−1 per 100,000 cells) reduction, estimate (s.e.): 0.18 (0.05) dB yr−1, P < 0.001) and HTG cohort (for 1 s.d. (4.0 pmol min−1 per 100,000 cells) reduction, estimate (s.e.): 0.20 (0.06) dB yr−1, P = 0.002). b, Forest plot shows the results of the mean IOP mixed effect model for factor associated with the MD VF progression, in the placebo arm of the UKGTS cohort. The relationship between the rate of MD change and IOP was evaluated with linear mixed models with random slopes and random intercepts. A total of 213 eyes were included in the analysis. Red squares represent standardized estimates, whereas horizontal bars represent their corresponding 95% CIs. All independent variables were standardized (that is, zero mean and unit s.d.) using the s.d. and mean of the parameters from the main paper to facilitate comparison. Higher mean IOP was significantly associated with faster VF progression (for 1 s.d. increase, estimate (s.e.): −0.25 (0.05) dB yr−1, P < 0.001), while thicker CCT with slower VF progression (for 1 s.d. increase, estimate (s.e.): 0.18 (0.09) dB yr−1, P = 0.046).
Fig. 3
Fig. 3. NAD levels in PBMCs and the association with basal OCR.
a, Box plots and results of the Tukey HSD post hoc test for total cellular NAD levels in PBMC as a function of diagnostic category. Total NAD levels were measured in 54 (24.8%) subjects (25 controls, 10 HTG and 19 NTG). Total NAD levels followed the same pattern as basal OCR, with NTG patients having the lowest NAD levels (mean (s.d.): 0.4 (±0.2) pg NAD per mg of protein), followed by HTG (mean (s.d.): 0.6 (±0.3) pg NAD per mg of protein) and controls (mean (s.d.): 0.9 (±0.3) pg NAD per mg of protein). The box plots display the distribution of total NAD values within each diagnostic category. Each box plot represents the IQR of the data, with the horizontal line inside the box indicating the median value. The lower and upper bounds of the box represent the first and third quartiles, respectively. The ‘whiskers’ extend to the minimum and maximum values within 1.5 times the IQR from the lower and upper quartiles, respectively. One-way ANOVA with Tukey’s HSD test to control family type I errors for post hoc pairwise comparisons. No adjustment for multiple comparisons was made for all other tests. Specifically, NTG versus control comparison yielded a P value of <0.0001, HTG versus control comparison yielded a P value of 0.009 and HTG versus NTG comparison yielded a P value of 0.1. Significant change with *P < 0.05, **P < 0.01 and ****P < 0.0001. b, Forest plot showing the results of multivariable linear regression model for predicting basal OCR in the subset of participants who have total cellular NAD measurements (25 controls, 10 HTG and 19 NTG). Blue, red, green and purple circles represent β estimates from the multivariable regression model, and the horizontal bars represent the corresponding 95% CIs. The model predicts that an increase in total NAD levels of 1 pg NAD per mg of protein is associated with an increase in basal OCR of 11.6 pmol min−1 per 100,000 cells in the entire cohort (P < 0.001). The same trend, although not reaching statistical significance, was noted in each subgroup.

References

    1. Quigley, H. A. Glaucoma. Lancet377, 1367–1377 (2011). - PubMed
    1. Heijl, A., Leske, M. C., Bengtsson, B., Bengtsson, B. & Hussein, M. Measuring visual field progression in the Early Manifest Glaucoma Trial. Acta Ophthalmol. Scand.81, 286–293 (2003). - PubMed
    1. Garway-Heath, D. F. et al. Latanoprost for open-angle glaucoma (UKGTS): a randomised, multicentre, placebo-controlled trial. Lancet385, 1295–1304 (2015). - PubMed
    1. Investigators, A. The Advanced Glaucoma Intervention Study (AGIS): 7. The relationship between control of intraocular pressure and visual field deterioration. Am. J. Ophthalmol.130, 429–440 (2000). - PubMed
    1. Heijl, A. et al. Reduction of intraocular pressure and glaucoma progression: results from the Early Manifest Glaucoma Trial. Arch. Ophthalmol.120, 1268–1279 (2002). - PubMed

LinkOut - more resources