. 2024 Jul;30(7):2076-2087.
doi: 10.1038/s41591-024-03057-9. Epub 2024 Jun 17.

Personalized brain circuit scores identify clinically distinct biotypes in depression and anxiety

Affiliations

Personalized brain circuit scores identify clinically distinct biotypes in depression and anxiety

Leonardo Tozzi et al. Nat Med. 2024 Jul.

Abstract

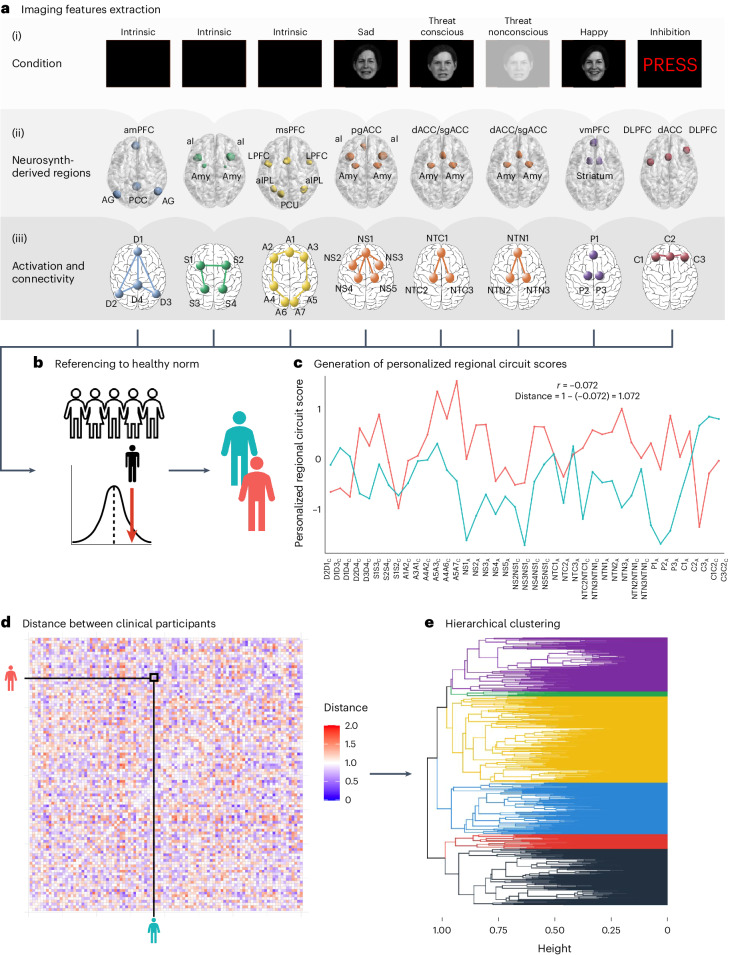
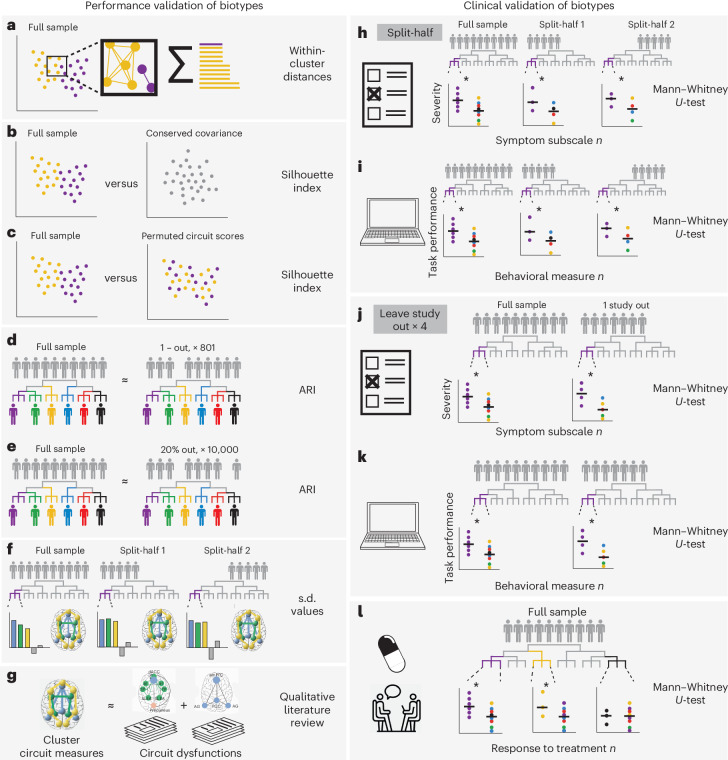
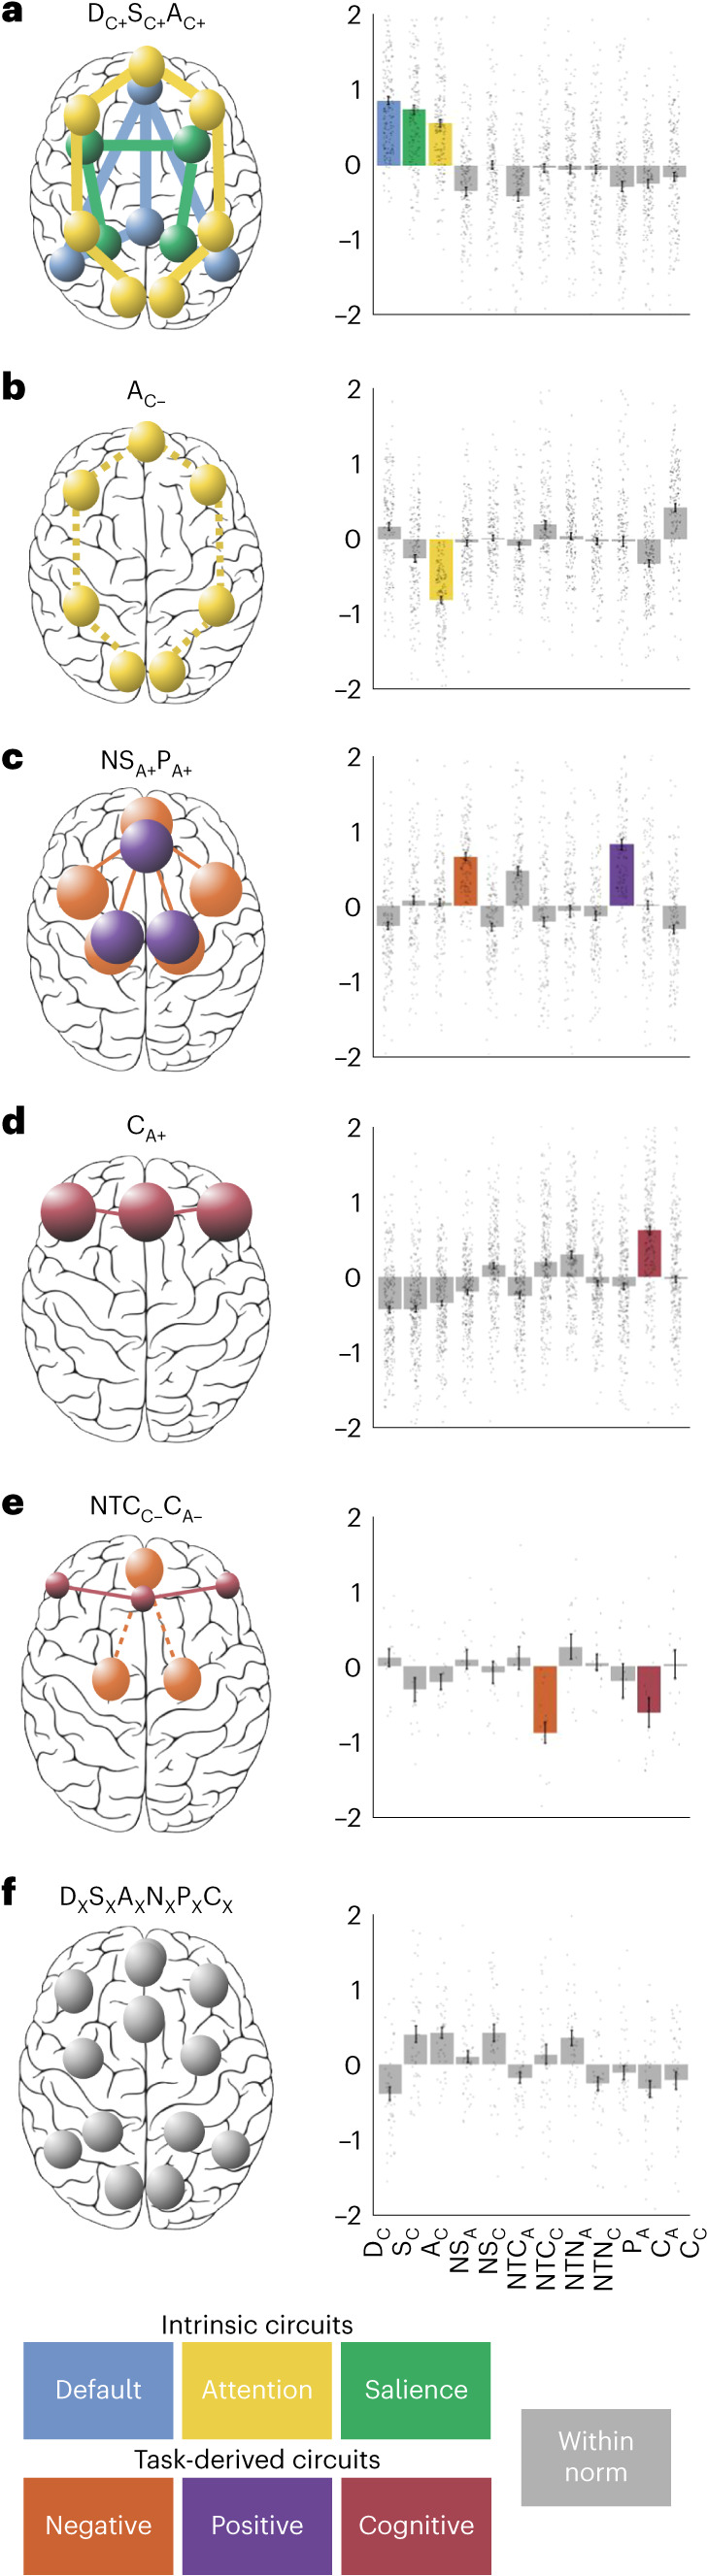
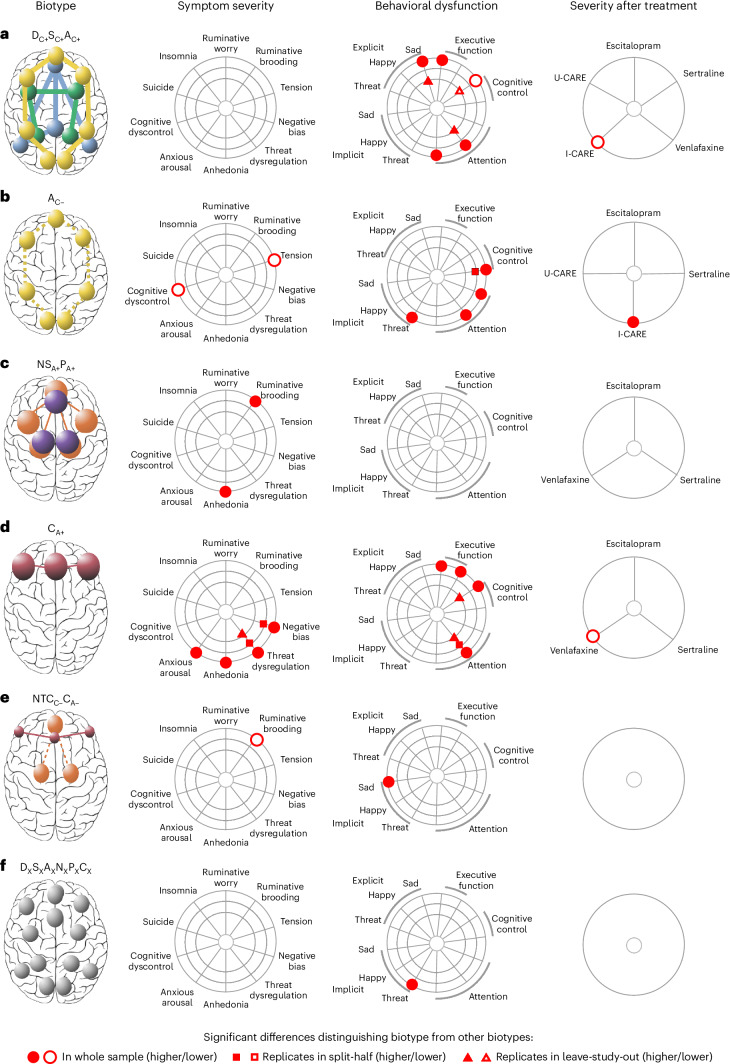
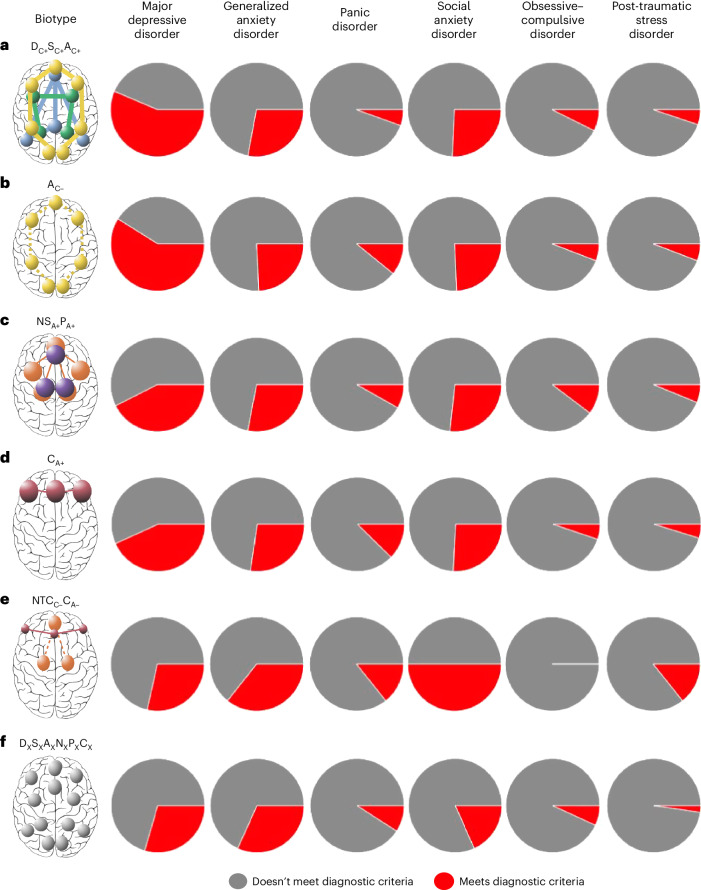
There is an urgent need to derive quantitative measures based on coherent neurobiological dysfunctions or 'biotypes' to enable stratification of patients with depression and anxiety. We used task-free and task-evoked data from a standardized functional magnetic resonance imaging protocol conducted across multiple studies in patients with depression and anxiety when treatment free (n = 801) and after randomization to pharmacotherapy or behavioral therapy (n = 250). From these patients, we derived personalized and interpretable scores of brain circuit dysfunction grounded in a theoretical taxonomy. Participants were subdivided into six biotypes defined by distinct profiles of intrinsic task-free functional connectivity within the default mode, salience and frontoparietal attention circuits, and of activation and connectivity within frontal and subcortical regions elicited by emotional and cognitive tasks. The six biotypes showed consistency with our theoretical taxonomy and were distinguished by symptoms, behavioral performance on general and emotional cognitive computerized tests, and response to pharmacotherapy as well as behavioral therapy. Our results provide a new, theory-driven, clinically validated and interpretable quantitative method to parse the biological heterogeneity of depression and anxiety. Thus, they represent a promising approach to advance precision clinical care in psychiatry.


Conflict of interest statement

L.M.W. declares US patent application nos. 10/034,645 and 15/820,338: ‘Systems and methods for detecting complex networks in MRI data’. In the past 3 years L.M.H. participated on a Roche Advisory Board. L.T. has been employed by Ceribell Inc. since 30 October 2023. The remaining authors declare no competing interests.

Figures

Fig. 1
Fig. 1. Overview of the participant-level image-processing and analysis pipeline.
a, Measures of task-based activation and functional connectivity and task-free connectivity derived from regions belonging to six circuits for which we have established relevance to depression and anxiety. (i) Default mode (D), salience (S) and attention (A) circuits were derived from the task-free periods of the fMRI. The Negative and Positive (P) circuits were engaged by a facial expressions task. In particular, the Negative circuit was engaged in Threat Conscious (NTC), Threat Non-conscious (NTN) and Sad (NS) conditions. The cognitive control circuit (C) was engaged by a Go–NoGo task. (ii) We defined the regions of interest comprising each circuit from the meta-analytic platform Neurosynth and refined them based on quality control, a set of psychometric criteria and whether they were implicated in depression and anxiety. (iii) We extracted functional connectivity between circuit regions for task-free circuits, and activation and connectivity of regions for task-engaged circuits (regions shown as sphere, connectivity shown as lines). b, We then expressed these measures as s.d. values compared with healthy participants to obtain personalized regional circuit scores for each individual. See Supplementary Table 18 for the full list of scores. c, We computed the distance between each pair of individuals as 1 − the correlation of their regional circuit scores. d, We show the distance matrix between the first 100 participants as a heatmap for illustrative purposes. e, We then used the distances obtained as input for a hierarchical clustering analysis. The individuals depicted have given permission to be included in published facial emotion stimulus sets,. AG, angular gyrus; aI, anterior insula; aIPL, anterior inferior parietal lobule; amPFC, anterior medial prefrontal cortex; Amy, amygdala; dACC, dorsal anterior cingulate cortex; DLPFC, dorsolateral prefrontal cortex; LPFC, lateral prefrontal cortex; msPFC, medial superior prefrontal cortex; PCC, posterior cingulate cortex; PCU, precuneus; pgACC, pregenual anterior cingulate cortex; sgACC, subgenual anterior cingulate cortex; vmPFC, venteromedial prefrontal cortex.
Fig. 2
Fig. 2. Overview of biotype validation.
a, We selected candidate biotype solutions selected based on the sum of within-cluster distances. b, We evaluated the silhouette index of our solutions relative to a null multinormal distribution with conserved covariance between individuals. c, We compared the silhouette index of our solutions relative to a solution using permuted participant labels, such that participant–brain correspondence was broken. d,e, We repeated our clustering approach leaving one participant out, 801× (d), as well as leaving out 20% of participants, 10,000× (e). In each iteration, we subsequently evaluated the overlap between participant biotype assignment in our original solution and each iterative solution by calculating the ARI. f, We evaluated the circuit measurements associated with each biotype across our original dataset and in two random halves of our original dataset separately. Circuit measurements that were consistently >0.5 s.d. from the mean across all these three samples were considered to be stable. g, We referenced the profile of circuit dysfunction to those found in the literature. h,i, To establish the clinical validity of our biotypes, we evaluated the cluster-specific differences in reported symptoms (h) and performances in a computerized cognitive battery (i). After establishing these differences in the full sample, we evaluated the stability of these symptom and behavioral profiles across two random half-splits of our data, deriving, each time, biotypes from the first half and assigning participants in the second half to a biotype derived from the first. We also followed the same procedure in a leave-study-out framework, leaving one of four of our studies out in each iteration. j,k, We subsequently evaluated the stability of biotype-specific symptom (j) and cognitive (k) differences relative to out-of-biotype participants in each iteration. We considered a difference to be stable when it was statistically significant in the whole sample and in each of the two random half-splits or in each of the two splits of a leave-study-out iteration. l, To evaluate the clinical utility of our cluster biotypes, we tested for differential symptom severity of each biotype to multiple depression treatments. Plots in this figure are only for illustrating the steps of our analysis.
Fig. 3
Fig. 3. Clustering of regional brain circuit scores identifies six biotypes of depression and anxiety.
af, Schematic circuit images illustrating the profile of circuit dysfunction defining each biotype (biotypes are labeled af). Circuits are distinguished by colors that correspond to the circuit measure inputs (Fig. 1c). Spheres represent the regions within each biotype-defining circuit and the size of the spheres represents the magnitude of activation deviation from the healthy reference (small spheres, activation ≤0.5 s.d. below the healthy reference; large spheres, activation ≥0.5 s.d. above the healthy reference). The thickness of lines between the spheres denotes a connectivity deviation (dashed lines, decreased connectivity ≤0.5 s.d. below the healthy reference; thick lines, increased connectivity ≥0.5 s.d. above the healthy reference). Column plots display the average activity across regions that define each circuit or the average connectivity between regions that define each circuit. A visualization of each regional circuit score by biotype is in Supplementary Fig. 5. In bar plots, we highlight circuits that showed a mean difference of at least 0.50 s.d. below or above the healthy reference. We named each biotype according to the features that differentiated it from the healthy reference. Each circuit is indicated with a letter, the distinguishing circuit feature is indicated as a subscript and the direction of dysfunction is indicated by + or −. The subscript x indicates that the sixth biotype is not differentiated by a prominent circuit dysfunction. Besides this nomenclature, we suggest a short description for each biotype, which connects them with our theoretically synthesized biotypes: DC+SC+AC+, default with salience and attention hyperconnectivity (n = 169 participants); AC−, attention hypoconnectivity (n = 161 participants); NSA+PA+, sad-elicited negative affect with positive affect hyperactivation (n = 154 participants); CA+, cognitive control hyperactivation (n = 258 participants); NTCC−CA−, cognitive control hypoactivation with conscious threat-elicited negative affect hypoconnectivity (n = 15 participants); and DXSXAXNXPXCX, intact activation and connectivity (n = 44 participants).
Fig. 4
Fig. 4. Summary results of clinical features distinguishing each biotype from the other biotypes.
af, Circuit biotypes are visualized using circuit schematics on the left (biotypes are labeled af). We first compared these circuit biotypes on symptoms of depression and related anxiety (column ‘Symptom severity’). Next, we compared biotypes on behavioral performance on general and emotional cognitive tests relevant to social and occupational function (column ‘Behavioral dysfunction’). We compared biotypes on severity after treatment with one of three antidepressant pharmacotherapies (escitalopram, sertraline or venlafaxine XR), a behavioral problem-solving therapy (I-CARE) or usual care (U-CARE) (column ‘Severity after treatment’). To facilitate comparison across units of analysis, all measures were scaled between 0 and 1 so that 0 would represent minimum severity/dysfunction and 1 maximum severity/dysfunction. The column ‘Severity after treatment’ shows differences in symptom severity posttreatment (that is, lower values correspond to better treatment response). Comparisons on severity after treatment were conducted only for biotype/treatment combinations having n ≥ 5, so only those are shown. We used the biotype nomenclature used previously. The subscript x indicates that the sixth biotype is not differentiated by a prominent circuit dysfunction relative to other biotypes. Besides this nomenclature, we suggest a short plain-English description for each biotype (in quotes), which connects them with our theoretically synthesized biotypes (as shown in Fig. 3).
Fig. 5
Fig. 5. Frequency of diagnoses across biotypes.
We show the proportion of participants in each biotype who meet diagnostic criteria for major depressive disorder, generalized anxiety disorder, panic disorder, social anxiety disorder, obsessive–compulsive disorder and post-traumatic stress disorder (biotypes are labeled af). χ2 tests revealed that the frequency of major depressive disorder was significantly different across biotypes (two-sided χ2 = 24.235, P = 0.0002). We used the same biotype nomenclature as previously. The subscript x indicates that the sixth biotype is not differentiated by a prominent circuit dysfunction relative to other biotypes. Besides this nomenclature, we suggest a short plain-English description for each biotype (in quotes), which connects them with our theoretically synthesized biotypes, again as expressed in the legend to Fig. 3.

References

    1. Friedrich, M. J. Depression is the leading cause of disability around the world. JAMA317, 1517 (2017). - PubMed
    1. Ansara, E. D. Management of treatment-resistant generalized anxiety disorder. Ment. Health Clin.10, 326–334 (2020). 10.9740/mhc.2020.11.326 - DOI - PMC - PubMed
    1. Ruberto, V. L., Jha, M. K. & Murrough, J. W. Pharmacological treatments for patients with treatment-resistant depression. Pharmaceuticals13, 116 (2020). 10.3390/ph13060116 - DOI - PMC - PubMed
    1. Drysdale, A. T. et al. Resting-state connectivity biomarkers define neurophysiological subtypes of depression. Nat. Med23, 28–38 (2017). 10.1038/nm.4246 - DOI - PMC - PubMed
    1. Liang, S. et al. Biotypes of major depressive disorder: neuroimaging evidence from resting-state default mode network patterns. Neuroimage Clin.28, 102514 (2020). 10.1016/j.nicl.2020.102514 - DOI - PMC - PubMed