. 2024 Jun 18;17(1):45.
doi: 10.1186/s13045-024-01566-1.

Remodeling of anti-tumor immunity with antibodies targeting a p53 mutant

Affiliations

Remodeling of anti-tumor immunity with antibodies targeting a p53 mutant

Dafei Chai et al. J Hematol Oncol. .

Abstract

Background: p53, the most frequently mutated gene in cancer, lacks effective targeted drugs.

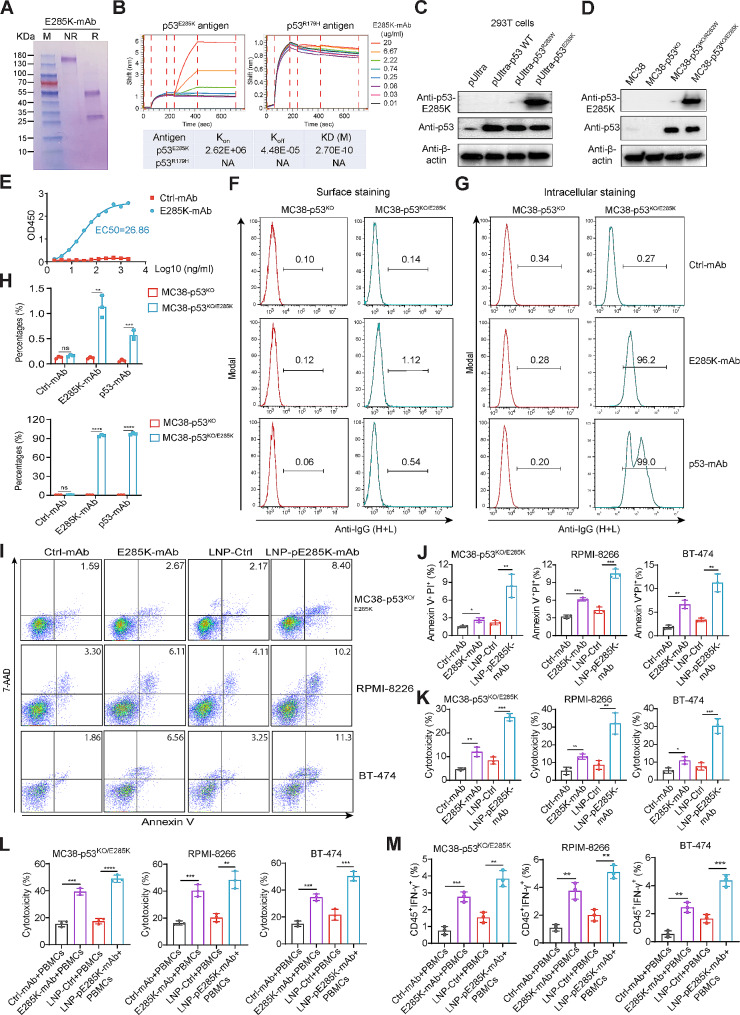
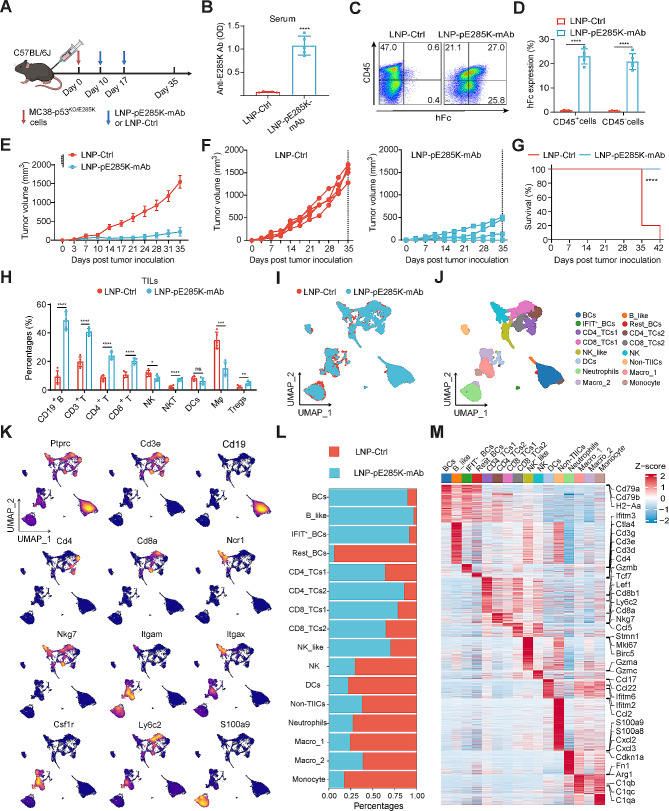
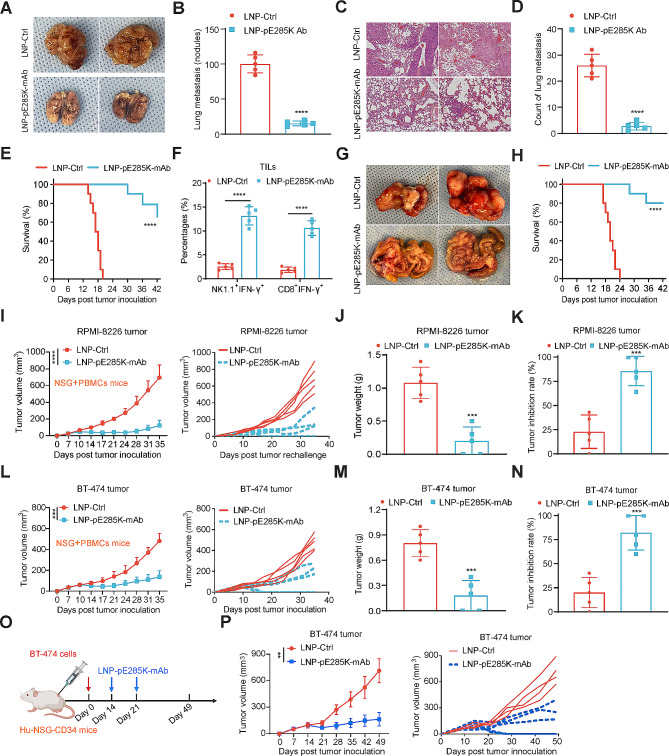
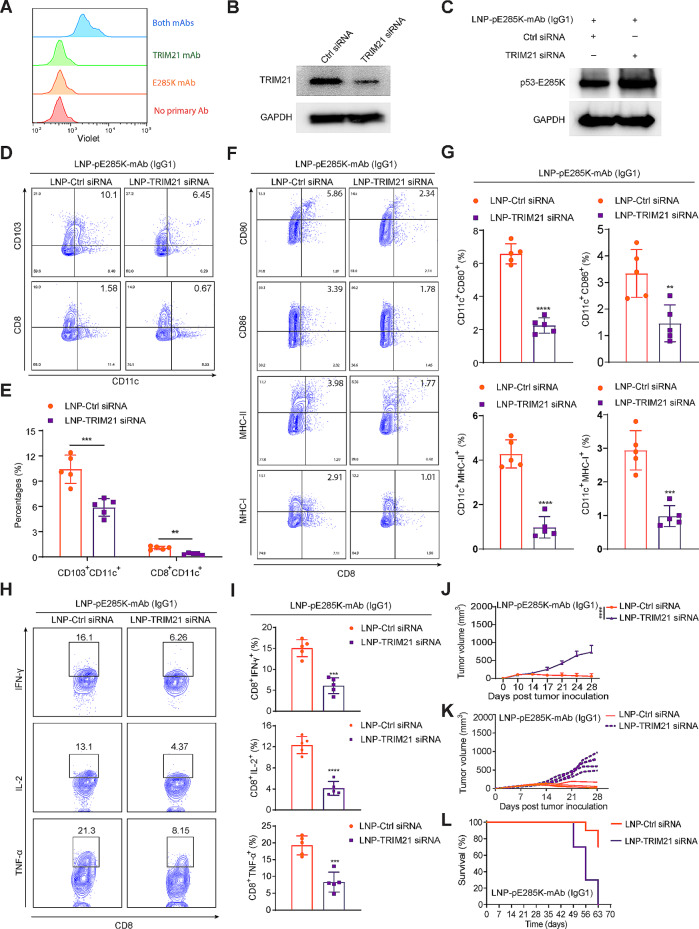
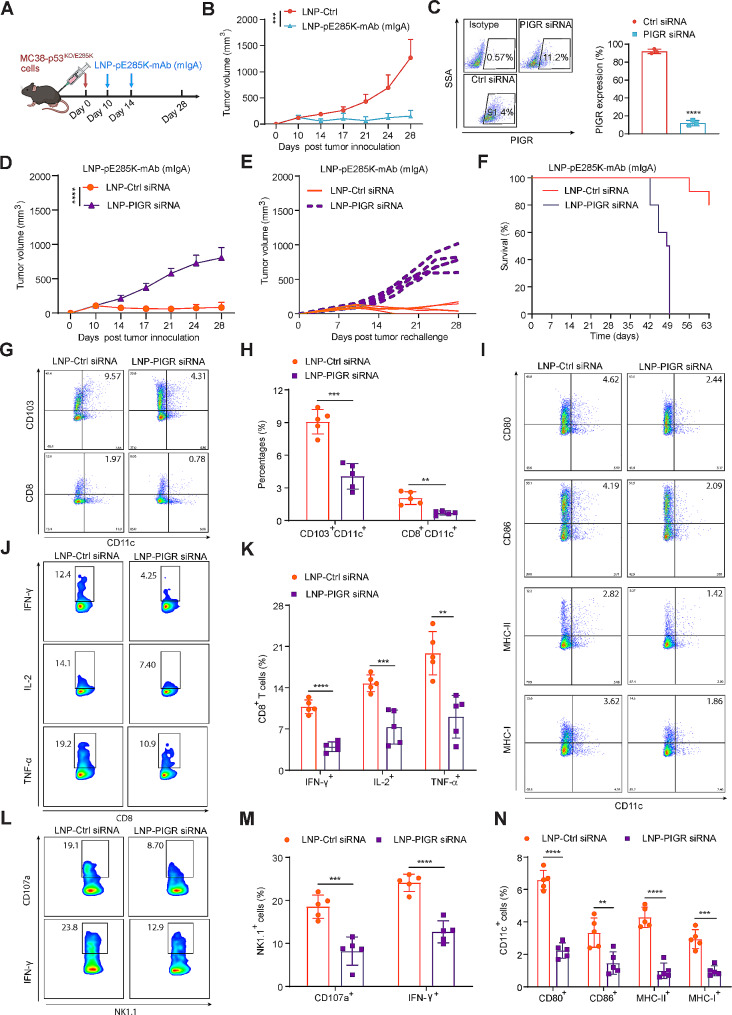
Methods: We developed monoclonal antibodies (mAbs) that target a p53 hotspot mutation E285K without cross-reactivity with wild-type p53. They were delivered using lipid nanoparticles (LNPs) that encapsulate DNA plasmids. Western blot, BLI, flow cytometry, single-cell sequencing (scRNA-seq), and other methods were employed to assess the function of mAbs in vitro and in vivo.

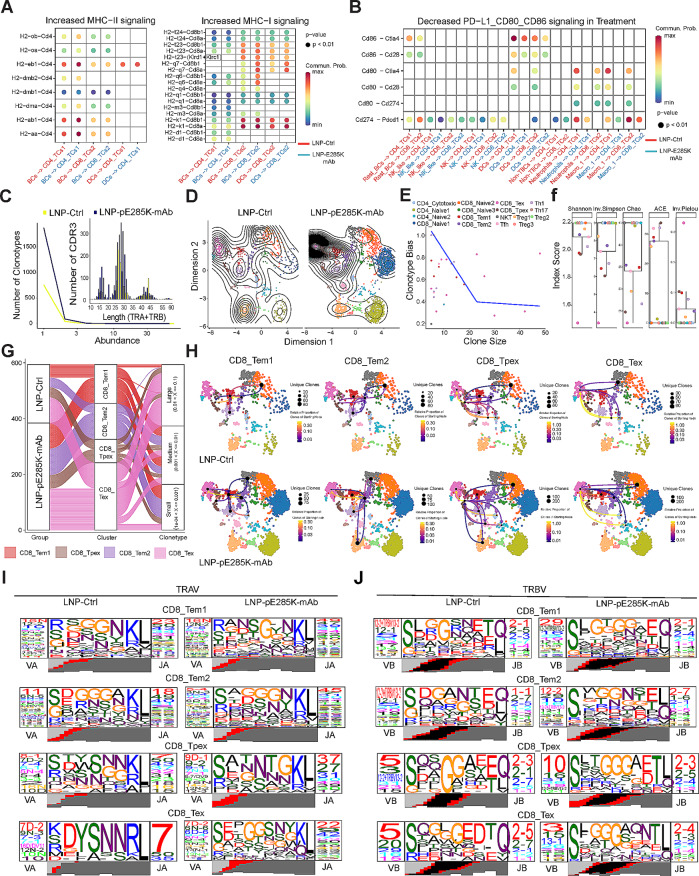
Results: These LNP-pE285K-mAbs in the IgG1 format exhibited a robust anti-tumor effect, facilitating the infiltration of immune cells, including CD8+ T, B, and NK cells. scRNA-seq revealed that IgG1 reduces immune inhibitory signaling, increases MHC signaling from B cells to CD8+ T cells, and enriches anti-tumor T cell and B cell receptor profiles. The E285K-mAbs were also produced in the dimeric IgA (dIgA) format, whose anti-tumor activity depended on the polymeric immunoglobulin receptor (PIGR), a membrane Ig receptor, whereas that of IgG1 relied on TRIM21, an intracellular IgG receptor.

Conclusions: Targeting specific mutant epitopes using DNA-encoded and LNP-delivered mAbs represents a potential precision medicine strategy against p53 mutants in TRIM21- or PIGR-positive cancers.

Keywords: E285K; IgG1; Monoclonal antibody; Mutant p53; dIgA.


Conflict of interest statement

The authors declare no competing interests.

Figures

Fig. 1
Fig. 1
The cytotoxicity of E285K-mAb and LNP-pE285K-mAb to tumor cells with p53E285K. A Purified E285K-mAb was analyzed on an SDS-PAGE gel and visualized with Coomassie staining. Lane M: Protein ladder; Lane NR: Non-reducing; Lane R: Reducing. B BLI kinetics of E285K-mAb binding to the antigen. C Western blot analysis of WT p53, p53E285K, and p53R282W in 293T cells 48 h post transfection. D Western blot of p53E285K in MC38-p53KO/E285K cells (p53-null MC38 cells with exogenous p53E285K). E ELISA of E285K-mAb with the antigen. The “Ctrl-mAb” refers to HEL-mAb, which contains a human Fc and a Fab targeting the hen egg lysozyme (HEL). F-H FACS of MC38-p53KO/E285K cells using E285K-mAb. Cells were treated with the BD Cytofix™ Fixation Buffer in (F) and with the Cytofix/Cytoperm™ Fixation/Permeabilization Kit in (G). Bar graphs were shown (H). I and J FACS to analyze cellular apoptosis of MC38-p53KO/E285K, RPIM-8226, and BT-474 cells. Both RPIM-8226 and BT-474 cell lines harbor endogenous p53E285K mutation. Cells were treated with Ctrl-mAb, E285K-mAb, LNP-Ctrl, or LNP-pE285K-mAb for 72 h. K and L Cytotoxicity of cells treated with mAbs and PBMCs. Cells were treated with E285K-mAb (10 µg/ml) for 30 min at 4 °C or LNP-pE285K-mAb (5 µg/ml) for 24 h at 37 °C before co-cultured with PBMCs at a 50:1 E: T ratio in 96-well plates for 72 h. Cytotoxicity was measured by an LDH release assay. M, IFN-γ expression in PBMCs co-cultured with cancer cells and mAbs. Data were representative of three experiments. Presented as means ± SD. Statistical significance: *p < 0.05, **p < 0.01, and ****p < 0.0001; ns, not significant
Fig. 2
Fig. 2
Therapeutic efficacy of LNP-pE285K-mAb to treat MC38-p53KO/E285Ktumors. A Schematic representation of the subcutaneous tumor model. Established tumors from MC38-p53KO/E285K cells were treated by intratumoral injection of 40 µg DNA plasmids encoding pE285K-mAb (20 µg each for light-chain and heavy-chain) per tumor 10 days after tumor cell inoculation (n = 5 mice). B Serum levels of E285K-mAb detected using ELISA. C and D FACS analysis of E285K-mAb expression and binding in tumors using anti-hFc mAb. E Tumor volumes in each group were measured at different times after inoculation. The initial tumor size was approximately 50–100 mm3, and treatment with LNP-pE285K-mAb began 10 days after tumor inoculation. F The volumes of each tumor. G Survival rate of the two mouse groups (n = 10 mice). H Proportions of CD19+B, CD3+T, CD4+T, CD8+T, NK, NKT, DCs, Mφ, and Tregs in TILs from the two groups. I and J scRNA-seq of CD45+ immune cells isolated from two groups of tumors, visualized through unified manifold approximation and projection (UMAP). K Identification expression of representative marker genes, such as Ptprc (Cd45) for pan-leukocytes and Cd19 for B cells. L Immune cell subtype changes in tumors treated with LNP-pE285K-mAb. M Comparative analysis of DEGs in immune cells from the two groups. Data were presented as means ± SD. Statistical significance was set at *p < 0.05, **p < 0.01, and ****p < 0.0001; ns, not significant
Fig. 3
Fig. 3
Anti-tumor response induced by LNP-pE285K-mAb in lung metastasis. A Representative images of metastatic nodules on the lung surface in different treatment groups. B The number of visible nodules present on the lung surface (n = 5 mice). C Histological examination of lung tissues. D Enumeration of microscopic lung metastases as identified in (C). E Survival analysis in mice with lung metastatic tumors (n = 10 mice). F The percentages of IFN-γ expression in NK or CD8+ T cells within TILs from lung metastatic tumors. G Representative images of rectal MC38-p53KO/E85K tumors. H Survival analysis of mice with rectal MC38-p53KO/E285K tumors (n = 10 mice). I Tumor development from RPMI-8226 cells. NSG mice were inoculated RPMI-8226 cells on day 0, treated by 1 × 107 PBMCs/mouse intravenously on day 10 and LNP-pE285K-mAb on day 14 (n = 5 mice). J and K Tumor weight and inhibition on day 45 post inoculation of RPMI-8226 cells. L BT-474 tumor development (n = 5 mice). M and N Tumor weight and inhibition in BT-474 models. O Schematic representation of LNP-pE285K-mAb treatment in the Hu-NSG-CD34 tumor model. Hu-NSG-CD34 mice with BT-474 tumors were treated by intratumoral injection of LNP-pE285K-mAb (40 µg DNA plasmids) per tumor 14 and 21 days after tumor cell inoculation. P BT-474 tumor growth (LNP-Ctrl group, n = 4 mice; LNP-pE285K-mAb group, n = 5 mice). Data were represented as means ± SD. Statistical significance was set at ***p < 0.001, ****p < 0.0001
Fig. 4
Fig. 4
B cells and NK-like cells interacting with CD8+ T cells mediated by LNP-pE285K-mAb in TME. A Heat map depicting the differential number (left) and strength (right) of interactions in the cell-cell communication network between the LNP-pE285K-mAb-treated and LNP-Ctrl-treated groups. Red indicates up-regulated signaling, and blue indicates downregulated signaling. B Scatter plots comparing the outgoing and incoming interaction strengths in the 2D space between groups. C UMAP visualization of T cell-associated populations pooled across samples and conditions, clustered using the Louvain algorithm into 17 distinct clusters. Bar graphs showed the percentages of various T cell subtypes in the tumors from each group. D Heatmap presenting DEGs in T cells between the groups. E Expression profiles of signature genes (from C) and genes crucial for T cell function. F Developmental trajectory analysis indicating the dynamic shift in cell states, with arrows predicting the direction of cell state transition. G Proportion of IFN-γ expression in CD8+ T cells from TILs. Shown were representative FACS results from one of three experiments (n = 5 mice). H UMAP projections illustrating NK cell subtypes and their heterogeneity in tumors from each group. I UMAP plot of several NK-like cell subtypes. J Percentages of CD107a expression in NK1.1+ cells from TILs evaluated by FACS (n = 5 mice). K UMAP projections of B cell subtypes within tumors across groups. L-N, The impact of blocking CD8+ T, NK, and B cells on animal survival. Each animal (n = 10 per group) was intraperitoneally injected with 0.5 mg anti-mouse CD8α, CD19, or NK1.1 mAb 2 days before the first dose of LNP-pE285K-mAb (second and third on days 5 and 12). Data were represented as means ± SD. Statistical significance was set at ***p < 0.001
Fig. 5
Fig. 5
scRNA-seq unveils unique CD8+ T cell subpopulation induced by LNP-pE285K-mAb. A UMAP representation delineating the developmental trajectory of Tex, Tpex, Tem1 and Tem2 cells within CD8+ T cell populations. B Pseudotime analysis of the states indicated in (A). C Quantification and expression intensity of marker genes from (A) superimposed on the UMAP plot. D Heatmap displaying the top DEGs in CD8+ T cell subpopulations and NKT cells. E Boxplots showing the expression of genes like transcription factor, memory, effector, and checkpoint markers. Data were analyzed using the Kruskal-Wallis test. F Identification of specific signaling alterations in two CD8+ T cell subtypes between the two groups. G The contribution of PD-1 blockade to the long-term therapeutic efficacy of LNP-pE285K-mAb. comparison in mice treated with LNP-pE285K-mAb, αPD-1, or their combination, followed by challenge with MC38-p53E285K tumor cells (n = 5 mice per group). H Tumor volumes of individual mice from (G). I Animal survival (n = 10 mice per group). J Representative images of FACS of CD44 and CD62L expression in CD8+ T cells from different groups. K Statistical analysis of the percentages of naive (CD44CD62Lhigh), central memory (CD44+CD62Lhigh), and effector memory (CD44+CD62Llow) CD8+ T cells in (J). Data were from one representative of three experiments, presented as mean ± SD. Statistical significance was set at **p < 0.01, ***p < 0.001 and ****p < 0.0001; ns, not significant
Fig. 6
Fig. 6
LNP-pE285K-mAb stimulates special TCR motifs for anti-tumor CD8 T cell responses. A Enhanced signaling of MHC-I and MHC-II identified by comparing communication probabilities mediated by ligand–receptor pairs from B cells, DCs, to T cell subtypes. B Identification of altered ligand–receptor pairs from APCs to CD4+ and CD8+ T cells by comparing communication probabilities between the two groups. C Analysis of total TCR clonotype abundance by sample and type using the abundance contig function. Assessment of CDR3 peptide length by sample using the length contig function. D UMAP visualization of TCRs identified in T cells, with clonal overlay using dimensional reduction graphs. E Assessment of clonotype bias. F TCR clonal diversity. G Alluvial plots illustrating the frequencies of TCR clonotypes from each sample, in relationship to the top V(D)J pairing frequencies of expanded clonotypes in each group (right) and contacts (left) among four CD8+ T cell clusters. H UMAP visualization overlay identifying the network interaction of clonotypes shared between clusters along the single cell dimension reduction. The relative proportion of clones transitioning from a starting node to a different cluster, visualized by arrows in four CD8+ T cell cluster networks. I and J Analysis of TCR sequence motifs of α and β chains for the clonotypes within CD8+ T cell clusters by profiles of V and J regions and the CDR3 motif
Fig. 7
Fig. 7
The anti-tumor effect induced by E285K-mAb in the IgG1 format requires TRIM21. A Protein interaction between TRIM21 and E285K-mAb assayed by FACS in MC38-p53KO/E285K cell treated with E285K-mAb and TRIM21-mAb. B and C Detection of TRIM21 knockdown efficiency and p53-E285K expression levels post siRNA treatment in MC38-p53KO/E285K cells by western blot. D and E Analysis of CD103+CD11c+ and CD8+CD11c+ cell percentages in tumors from mice treated with LNP-TRIM21 siRNA and LNP-pE285K-mAb (n = 5 mice). F and G The expression of activation markers (CD80, CD86, and MHC) on CD11c+ cells within tumors using FACS. H and I IL-2, IFN-γ, and TNF-α expression on CD8+ T cells. J Tumor volumes measured at different times after inoculation. K Tumor diameter of individual mice from the groups in (j) as a function of time. Each group consisted of five tested mice. L Animal survival (n = 10 mice). Data presented as means ± SD. Statistical significance was set at **p < 0.01, ***p < 0.001, and ****p < 0.0001
Fig. 8
Fig. 8
The anti-tumor effect of E285K-mAb in the dIgA format via PIGR. A Schema of the subcutaneous MC38-p53KO/E285K tumor model by intratumoral injection of LNP-pE285K-mAb in mouse dIgA isotype (mIgA) on days 10 and 14 post tumor inoculation (n = 5 mice). B Tumor volumes. C Assessment of PIGR expression in MC38 cells treated with PIGR siRNA or control siRNA. D Tumor volumes in mice treated with mIgA and LNP-PIGR siRNA (n = 5 mice per group). E Individual tumor volumes over time in mice specified in (D). F Animal survival (n = 10 mice per group). G and H Percentages of DC subsets (CD103+CD11c+, CD8+CD11c+) within TILs of tumors treated with LNP-PIGR-siRNA. I and N CD80, CD86, and MHC expression on CD11c+ cells within TILs. J and K IL-2, IFN-γ, and TNF-α expression on CD8+ T cells within TILs. L and M CD107a and IFN-γ expression in NK cells within TILs. Data were presented as means ± SD. Statistical significance was set at **p < 0.01, ***p < 0.001, and ****p < 0.0001

References

    1. Finlay CA, Hinds PW, Levine AJ. The p53 proto-oncogene can act as a suppressor of transformation. Cell. 1989;57(7):1083–93. doi: 10.1016/0092-8674(89)90045-7. - DOI - PubMed
    1. Guo G, Yu M, Xiao W, Celis E, Cui Y. Local activation of p53 in the Tumor Microenvironment overcomes Immune suppression and enhances Antitumor Immunity. Cancer Res. 2017;77(9):2292–305. doi: 10.1158/0008-5472.CAN-16-2832. - DOI - PMC - PubMed
    1. Olivier M, Hollstein M, Hainaut P. TP53 mutations in human cancers: origins, consequences, and clinical use. Cold Spring Harb Perspect Biol. 2010;2(1):a001008. doi: 10.1101/cshperspect.a001008. - DOI - PMC - PubMed
    1. Bykov VJ, Issaeva N, Shilov A, Hultcrantz M, Pugacheva E, Chumakov P, Bergman J, Wiman KG, Selivanova G. Restoration of the tumor suppressor function to mutant p53 by a low-molecular-weight compound. Nat Med. 2002;8(3):282–8. doi: 10.1038/nm0302-282. - DOI - PubMed
    1. Lemos C, Schulze L, Weiske J, Meyer H, Braeuer N, Barak N, Eberspacher U, Werbeck N, Stresemann C, Lange M, et al. Identification of small molecules that modulate mutant p53 condensation. iScience. 2020;23(9):101517. doi: 10.1016/j.isci.2020.101517. - DOI - PMC - PubMed

Publication types

Substances